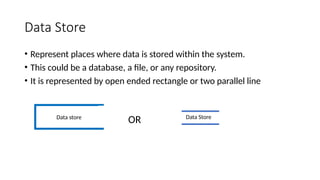
System Analyst and
DFD
PRESENTED BY
• Ichchha Ramtel
• Janis Adhikari
• Dikshant Shrestha
• Madav Acharya
National College of Management
and Technical Science
Samakhushi, Kathmandu
PRESENTATION ON
2024/08/24
Table of content
• System Analyst
• Role of system Analyst
• Skills required for system analyst
• Data flow diagram
• Component of DFD
• Levels of DFD
• Guidelines for creating DFD
• Benefits of DFD
• Limitations of DFD
• Practical Applications of DFD
System Analyst
• System Analysis is the process of studying and understanding a
system, identifying its components, and designing solutions to
improve its efficiency.
• A System Analyst is a professional who uses analysis and design
techniques to solve business problems using information
technology.
• To bridge the gap between business needs and IT solutions.
Role of System analyst
• Requirement gathering
• System design
• System implementation
• System testing
• Documentation
• Trouble shooting and support
Skills required for a system analyst
• Technical skills
• Analytical skills
• Communication skills
• Problem skills
• Project management
Data Flow Diagram (DFD)
• A data flow diagram (DFD) is a graphical representation of the
movement of data between external entities, processes and data stores
within a system
• Simply put, DFD’s show how data moves through an information
system.
Components of DFD
• Source/Sinks (External Entity)
• Process
• Data store
• Dataflow
External Entity (Source/Sink)
• People or organization that sends or receive data into or from system
• It is denoted by Rectangle symbol.
• For example , Customer in a E-commerce system.
Customer
Process
• Represent tasks, activities, or functions where data is processed. Each
process transforms incoming data into outgoing data.
• It is represented by Circle or rounded Rectangle
• For example: Order process in E-commerce software
Order Orders
OR
Data Store
• Represent places where data is stored within the system.
• This could be a database, a file, or any repository.
• It is represented by open ended rectangle or two parallel line
Data store Data Store
OR
Data flow
• Represent the movement of data between processes, data stores, and
external entities.
• Represented by arrow
• The direction of the arrow indicates the flow of data
Levels of DFD
Level 0 DFD:
Represents the highest level of abstraction, showing the system as a
single process with external entities.
Level 1 DFD:
Breaks down the system into major processes and shows the
interactions between them.
Level 2 DFD:
Further decomposes the processes into sub-processes to provide more
detailed information.
Guidelines for creating DFD
• Process Flows: Each process must have at least one outgoing and
one ingoing data flow.
• Data Store Connectivity: Data stores should have at least one
incoming and outgoing data flow.
• Entity-Process Link: Entities must be connected to a process by a
data flow.
• Avoiding Crossings: Data flows cannot cross with each other.
• External Entity Access: Data stores cannot directly connect to
external entities.
Benefit of DFD
• A graphical technique that is relatively easy to understand for
stakeholders and other users.
• Provides a detailed view of the system components and
boundaries.
• Provide clear and detailed information about the processes
within a system.
• Shows the logic of the data flow.
• Presents a functional breakdown of the system.
• Used as a part of the system documentation.
Limitations of Data Flow Diagram
• 1. Lack of Detail:DFDs provide a broad overview of a system and its data
flows, but they do not capture the details of how data is processed within
each process. This can lead to an oversimplified understanding of the
system.
• 2. Ambiguity:DFDs can be interpreted differently by different people
because there is no strict standardization in terms of symbols and
notations. This ambiguity can cause miscommunication among
stakeholders.
• 3. Lack of Control Information:DFDs do not represent the control flow or
decision logic within the system, making it difficult to understand the
conditional paths that might exist.
• 4. Scalability Issues:For large systems, DFDs can become extremely
complex and hard to manage, leading to diagrams that are difficult to
understand and maintain.
• 5. Not Suitable for All Systems:DFDs are not well-suited for systems where
data flow is not the primary concern, such as systems that are more
focused on complex algorithms or user interfaces.
• 6. Maintenance Challenges:As the system evolves, keeping the DFD up to
date can be challenging. Changes in the system require the DFD to be
revised, which can be time-consuming.
Practical Application of DFD
• 1.Requirement Analysis: During the initial stages of system
development, DFDs are used to capture the functional requirements
of a system. They help in understanding the data inputs, processes,
and outputs of the system, providing a clear picture of the business
processes and information flow.
• 2.Process Improvement: Businesses use DFDs to model and analyze
their existing processes. By mapping out how data flows through
different business functions, organizations can identify bottlenecks,
inefficiencies, and areas for improvement.
• 3.Documentation: DFDs serve as part of the system documentation, providing
a visual reference that can be used throughout the software development
lifecycle. This is especially useful for maintaining and updating systems over
time.
• 4.Data Modeling: DFDs are used to identify the data needs of a system and
how data should be organized. They help in designing the structure of
databases by showing how data flows into and out of various data stores.
• 5.Quality Assurance: In quality assurance processes, DFDs are used to verify
that the system’s design aligns with the business requirements and that data
flows as expected.
• 6.Progress Tracking: DFDs help in tracking the progress of system development
by serving as a reference point for what has been completed and what is still
in progress.

Presentation on DFD and System Analyst.pptx

  • 1.
    System Analyst and DFD PRESENTEDBY • Ichchha Ramtel • Janis Adhikari • Dikshant Shrestha • Madav Acharya National College of Management and Technical Science Samakhushi, Kathmandu PRESENTATION ON 2024/08/24
  • 2.
    Table of content •System Analyst • Role of system Analyst • Skills required for system analyst • Data flow diagram • Component of DFD • Levels of DFD • Guidelines for creating DFD • Benefits of DFD • Limitations of DFD • Practical Applications of DFD
  • 3.
    System Analyst • SystemAnalysis is the process of studying and understanding a system, identifying its components, and designing solutions to improve its efficiency. • A System Analyst is a professional who uses analysis and design techniques to solve business problems using information technology. • To bridge the gap between business needs and IT solutions.
  • 4.
    Role of Systemanalyst • Requirement gathering • System design • System implementation • System testing • Documentation • Trouble shooting and support
  • 5.
    Skills required fora system analyst • Technical skills • Analytical skills • Communication skills • Problem skills • Project management
  • 6.
    Data Flow Diagram(DFD) • A data flow diagram (DFD) is a graphical representation of the movement of data between external entities, processes and data stores within a system • Simply put, DFD’s show how data moves through an information system.
  • 7.
    Components of DFD •Source/Sinks (External Entity) • Process • Data store • Dataflow
  • 8.
    External Entity (Source/Sink) •People or organization that sends or receive data into or from system • It is denoted by Rectangle symbol. • For example , Customer in a E-commerce system. Customer
  • 9.
    Process • Represent tasks,activities, or functions where data is processed. Each process transforms incoming data into outgoing data. • It is represented by Circle or rounded Rectangle • For example: Order process in E-commerce software Order Orders OR
  • 10.
    Data Store • Representplaces where data is stored within the system. • This could be a database, a file, or any repository. • It is represented by open ended rectangle or two parallel line Data store Data Store OR
  • 11.
    Data flow • Representthe movement of data between processes, data stores, and external entities. • Represented by arrow • The direction of the arrow indicates the flow of data
  • 12.
    Levels of DFD Level0 DFD: Represents the highest level of abstraction, showing the system as a single process with external entities. Level 1 DFD: Breaks down the system into major processes and shows the interactions between them. Level 2 DFD: Further decomposes the processes into sub-processes to provide more detailed information.
  • 13.
    Guidelines for creatingDFD • Process Flows: Each process must have at least one outgoing and one ingoing data flow. • Data Store Connectivity: Data stores should have at least one incoming and outgoing data flow. • Entity-Process Link: Entities must be connected to a process by a data flow. • Avoiding Crossings: Data flows cannot cross with each other. • External Entity Access: Data stores cannot directly connect to external entities.
  • 14.
    Benefit of DFD •A graphical technique that is relatively easy to understand for stakeholders and other users. • Provides a detailed view of the system components and boundaries. • Provide clear and detailed information about the processes within a system. • Shows the logic of the data flow. • Presents a functional breakdown of the system. • Used as a part of the system documentation.
  • 15.
    Limitations of DataFlow Diagram • 1. Lack of Detail:DFDs provide a broad overview of a system and its data flows, but they do not capture the details of how data is processed within each process. This can lead to an oversimplified understanding of the system. • 2. Ambiguity:DFDs can be interpreted differently by different people because there is no strict standardization in terms of symbols and notations. This ambiguity can cause miscommunication among stakeholders. • 3. Lack of Control Information:DFDs do not represent the control flow or decision logic within the system, making it difficult to understand the conditional paths that might exist.
  • 16.
    • 4. ScalabilityIssues:For large systems, DFDs can become extremely complex and hard to manage, leading to diagrams that are difficult to understand and maintain. • 5. Not Suitable for All Systems:DFDs are not well-suited for systems where data flow is not the primary concern, such as systems that are more focused on complex algorithms or user interfaces. • 6. Maintenance Challenges:As the system evolves, keeping the DFD up to date can be challenging. Changes in the system require the DFD to be revised, which can be time-consuming.
  • 17.
    Practical Application ofDFD • 1.Requirement Analysis: During the initial stages of system development, DFDs are used to capture the functional requirements of a system. They help in understanding the data inputs, processes, and outputs of the system, providing a clear picture of the business processes and information flow. • 2.Process Improvement: Businesses use DFDs to model and analyze their existing processes. By mapping out how data flows through different business functions, organizations can identify bottlenecks, inefficiencies, and areas for improvement.
  • 18.
    • 3.Documentation: DFDsserve as part of the system documentation, providing a visual reference that can be used throughout the software development lifecycle. This is especially useful for maintaining and updating systems over time. • 4.Data Modeling: DFDs are used to identify the data needs of a system and how data should be organized. They help in designing the structure of databases by showing how data flows into and out of various data stores. • 5.Quality Assurance: In quality assurance processes, DFDs are used to verify that the system’s design aligns with the business requirements and that data flows as expected. • 6.Progress Tracking: DFDs help in tracking the progress of system development by serving as a reference point for what has been completed and what is still in progress.