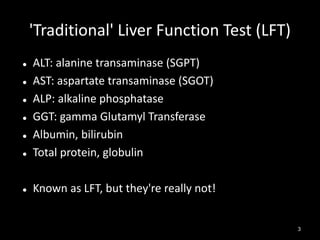
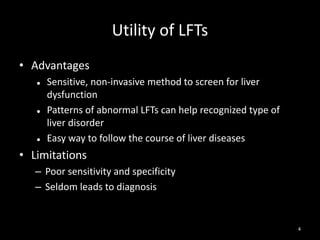
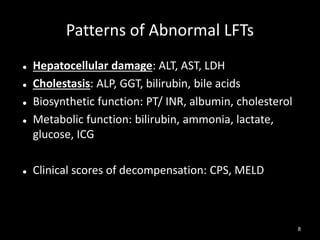
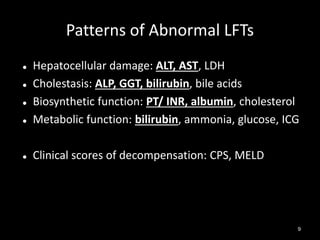
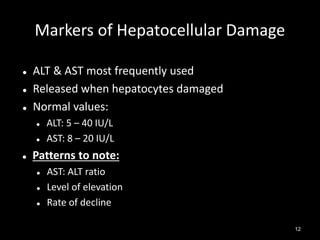
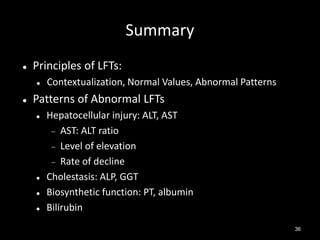
Liver Function Tests
An Approach for Primary Care
Dr Jarrod Lee
Consultant Gastroenterologist & Advanced Endoscopist
Mt Elizabeth Novena Hospital
1
Scope



Principles of interpreting LFTs
Patterns of abnormal LFTs





Hepatocellular Damage
Cholestasis
Biosynthetic function
Bilirubin

2
'Traditional' Liver Function Test (LFT)



ALT: alanine transaminase (SGPT)
AST: aspartate transaminase (SGOT)
ALP: alkaline phosphatase
GGT: gamma Glutamyl Transferase
Albumin, bilirubin
Total protein, globulin



Known as LFT, but they're really not!







3
Utility of LFTs
• Advantages






Sensitive, non-invasive method to screen for liver
dysfunction
Patterns of abnormal LFTs can help recognized type of
liver disorder
Easy way to follow the course of liver diseases

• Limitations
– Poor sensitivity and specificity
– Seldom leads to diagnosis

4
Interpreting LFTs
the Principles

5
Broad Principles


Contextualization




Normal





LFT interpretation must be contextualized for each
individual patient
Different labs have different ‘normal’ values
‘Abnormal’ values may be ‘normal’

Patterns



LFTs rarely provide specific diagnosis
Rather, suggests the general category of liver disorder
through the pattern of abnormal LFT
6
Normal vs Abnormal
Normal

Abnormal

2 SD





Normal values = mean ± 2SD of normal population
Normal: 95% of normal, asymptomatic patients have
numbers in this range on a “bell shaped curve”
Abnormal: By definition, 2.5% of normal patients have lab
values either above or below the “normal” range
7
Patterns of Abnormal LFTs







Hepatocellular damage: ALT, AST, LDH
Cholestasis: ALP, GGT, bilirubin, bile acids
Biosynthetic function: PT/ INR, albumin, cholesterol
Metabolic function: bilirubin, ammonia, lactate,
glucose, ICG
Clinical scores of decompensation: CPS, MELD

8
Patterns of Abnormal LFTs



Hepatocellular damage: ALT, AST, LDH
Cholestasis: ALP, GGT, bilirubin, bile acids
Biosynthetic function: PT/ INR, albumin, cholesterol
Metabolic function: bilirubin, ammonia, glucose, ICG



Clinical scores of decompensation: CPS, MELD





9
Interpreting LFTs
the Patterns

10
Hepatocellular Damage

11
Markers of Hepatocellular Damage




ALT & AST most frequently used
Released when hepatocytes damaged
Normal values:





ALT: 5 – 40 IU/L
AST: 8 – 20 IU/L

Patterns to note:




AST: ALT ratio
Level of elevation
Rate of decline
12
ALT vs AST
ALT




Cytosol
Half life: 47H
Low concentration in
other tissues:




Skeletal muscle, kidney,
heart

More specific for liver







AST
Cytosol 20%,
mitochondria 80%
Half life: cytosol 17H,
mitochondria 87H
Other tissues:


heart, RBC, skeletal
muscle, kidneys,
pancreas, brain, lung

13
AST: ALT Ratio




Normal: 0.6 – 0.8
< 1: most liver disorders
> 2:







Alcoholic hepatitis: AST < 300
Drugs & toxins
Extra-hepatic source
Ischemia
Cirrhosis
Fulminant Wilson’s disease (> 4)
14
AST: ALT Ratio
90

80

70

60

50

AST/ALT >1
AST/ALT >2

40

30

20

10

0

alcoholic

post necrotic
cirrhosis

chronic
hepatitis

obstructive
jaundice

viral hepatitis
Level of Elevation


ALT > 600 (15x):




ALT < 200 (5x):




Acute hepatic injury
Chronic hepatic injury, improved acute injury

ALT 200-600 (5-15x):



Less useful
Most common scenario!

16
ALT > 600 (15x)







Acute viral hepatitis
Acetaminophen
overdose
Ischemic hepatitis aka
shock liver







Drugs & toxins
Autoimmune hepatitis
Wilson's disease
Acute bile duct obstruction
Acute Budd Chiari
Syndrome

Can cause ALT > 3000
(75x)

17
ALT < 200 (5x)
ALT Predominant





Chronic hepatitis B, C
Acute viral hepatitis
NASH
Drugs, toxins



Autoimmune hepatitis
Metabolic disorders



AST Predominant





Almost any liver disease





Alcoholic liver disease
Drugs, toxins
NASH
Cirrhosis
Non-hepatic source:




Haemolysis, myopathy,
strenuous exercise

Macro-AST: 15-60% of
tertiary referrals
18
Rate of Decline
FAST





Short half life drug
Ischemic hepatitis
Acute biliary tract obstruction
Fulminant hepatitis

SLOW





Acute viral hepatitis
Long half life drug
Autoimmune hepatitis
Metabolic disorders

Green: Ischemic hepatitis
Blue: Acute viral hepatitis

19
Cholestasis

20
Alkaline Phosphatase (ALP)





Main marker of cholestasis
Normal: 20-70 IU/L
Half life: 7 days
Sources:





Hepatocytes
Osteoblasts, gut, kidney, placenta

Biliary obstruction:



Raised levels due to induction of ALP synthesis
May not rise until 1-2 days later
21
Raised ALP: Causes
Physiologic Causes
 Age > 60 yrs
 Children, adolescents
 Pregnancy
 Blood group O
 Post meal (fatty meal)

Pathologic Causes
 Intrahepatic cholestasis
 Extrahepatic
cholestasis (bile duct
obstruction)

22
Normal ALP Values vs Age

23
Raised ALP: Pathologic Causes
Intrahepatic Obstruction




Drugs
Sepsis
Others

Infiltrative liver disease

Primary biliary cirrhosis

Primary sclerosing
cholangitis (PSC)

Paraneoplastic syndromes

Extrahepatic Obstruction
 Intraluminal:




Bile duct wall:




Gallstones
Cholangiocarcinoma

Extraluminal:


Pancreatic cancer,
lymph nodes, gallstones
(Mirizzi's Syndrome)

24
-Glutamyl Transpeptidase (GGT)


Main utility







Differentiate ALP source
Not found in bone; not raised in pregnancy/ childhood
Sources: liver, kidney, pancreas, intestine, prostate, spleen,
heart, brain

Half life: 7-10 days; 28 days in alcohol liver injury
Isolated GGT elevation:




Due to induction of hepatic microsomal GGT
Drugs: warfarin, anticonvulsants, barbiturates
Alcohol: also causes hepatocyte leakage
25
Biosynthetic Function

26
Coagulation Factors




All synthesized in liver except Factor VIII
Mostly present in excess
Prothrombin Time (PT): Factors I, II, V, VII, IX, X






Half life: Factor VII – 6H (shortest)

Abnormalities only occur when liver's biosynthetic
ability substantially impaired
Common causes:



Vit K deficiency (malnutrition, malabsorption)
Warfarin
27
Albumin








300 – 500 g in body fluid
Synthesis: 15 g/ day
Degradation: 4% daily
Half life: 19 – 21 days
Not reliable indicator of acute liver disease
Not specific


Depends on nutrition, volume status, vascular integrity,
catabolism, hormones, stool/ urine losses

28
Hypoalbuminemia


Decreased synthesis: protein malnutrition, chronic liver
disease, chronic inflammation



Increased loss: nephrotic syndrome, protein losing
enteropathy



Increased volume: ascites, over-hydration
Increased turnover: catabolic states, steroids



Clues: globulin, cholesterol/ TG



29
Bilirubin

30
'Bilirubin' Pathway
RE Cell

Plasma

Heme → UCB

UCB – Albumin

Hepatocyte

UCB + 'gluconate' → CB

Urobilinogen

Stercobilinogen

UCB: Unconjugated bilirubin
CB: Conjugated bilirubin
31
Bilirubin
Unconjugated Bilirubin








Indirect bilirubin
Normal: < 0.8 mg/ dL
(< 13.6 µmol/L)
Lipid soluble, water
insoluble
Bound to albumin in plasma
Not filtered by kidney →
not present in urine

Conjugated Bilirubin








Direct bilirubin
Normal: 0.3 – 1.0 mg/dL
(5.1 – 17.0 µmol/L)
Water soluble, lipid
insoluble
Excreted in bile
Filtered by glomerulus →
majority reabsorbed, small
amount excreted in urine
32
Isolated Unconjugated Hyperbilirubinemia



Unconjugated bilirubin > 85% of total bilirubin
Increased production:







Haemolysis: rarely > 5 mg/dL (85 µmol/L)
Ineffective erythropoiesis: folate/ iron deficiency
Drugs: rifampicin, ribavirin
Resolution of hematoma

Defects in hepatic uptake or conjugation:


Gilbert's syndrome, Criggler – Najjar syndrome

33
Conjugated Hyperbilirubinemia







Conjugated bilirubin > 50% total bilirubin
Cannot differentiate between obstructive &
parenchymal causes
Tea coloured urine + clay coloured stool: usually
cholestatic cause, although parenchymal cause
possible
Malignant obstruction usually higher values

34
Delta Bilirubin


Conjugated bilirubin covalently bound to albumin







Important fraction of total bilirubin in patients with
cholestasis & hepatobiliary disease
Prolonged half life: 19 – 21 days (albumin)

Late recovery phase: all bilirubin may be in this form
Explains 2 enigmas in patients with raised
conjugated bilirubin:



CB declines slowly in patients who are recovering well
No bilirubinuria during recovery phase as delta bilirubin
not filtered by glomeruli
35
Summary


Principles of LFTs:




Contextualization, Normal Values, Abnormal Patterns

Patterns of Abnormal LFTs






Hepatocellular injury: ALT, AST
 AST: ALT ratio
 Level of elevation
 Rate of decline
Cholestasis: ALP, GGT
Biosynthetic function: PT, albumin
Bilirubin
36
Conclusion








'LFT's are numerous & somewhat confusing
Have limited sensitivity & specificity
Not all liver ds have abnormal LFT
Not all normal LFTs have normal livers
Decrease in values may not mean improvement
What to do?




All abnormal LFTs should be investigated
LFTs must be contextualized for each patient
Refer when unsure
37
Thank You

38

Liver Function Tests - An Approach for Primary Care

  • 1.
    Liver Function Tests AnApproach for Primary Care Dr Jarrod Lee Consultant Gastroenterologist & Advanced Endoscopist Mt Elizabeth Novena Hospital 1
  • 2.
    Scope   Principles of interpretingLFTs Patterns of abnormal LFTs     Hepatocellular Damage Cholestasis Biosynthetic function Bilirubin 2
  • 3.
    'Traditional' Liver FunctionTest (LFT)  ALT: alanine transaminase (SGPT) AST: aspartate transaminase (SGOT) ALP: alkaline phosphatase GGT: gamma Glutamyl Transferase Albumin, bilirubin Total protein, globulin  Known as LFT, but they're really not!      3
  • 4.
    Utility of LFTs •Advantages    Sensitive, non-invasive method to screen for liver dysfunction Patterns of abnormal LFTs can help recognized type of liver disorder Easy way to follow the course of liver diseases • Limitations – Poor sensitivity and specificity – Seldom leads to diagnosis 4
  • 5.
  • 6.
    Broad Principles  Contextualization   Normal    LFT interpretationmust be contextualized for each individual patient Different labs have different ‘normal’ values ‘Abnormal’ values may be ‘normal’ Patterns   LFTs rarely provide specific diagnosis Rather, suggests the general category of liver disorder through the pattern of abnormal LFT 6
  • 7.
    Normal vs Abnormal Normal Abnormal 2SD    Normal values = mean ± 2SD of normal population Normal: 95% of normal, asymptomatic patients have numbers in this range on a “bell shaped curve” Abnormal: By definition, 2.5% of normal patients have lab values either above or below the “normal” range 7
  • 8.
    Patterns of AbnormalLFTs      Hepatocellular damage: ALT, AST, LDH Cholestasis: ALP, GGT, bilirubin, bile acids Biosynthetic function: PT/ INR, albumin, cholesterol Metabolic function: bilirubin, ammonia, lactate, glucose, ICG Clinical scores of decompensation: CPS, MELD 8
  • 9.
    Patterns of AbnormalLFTs  Hepatocellular damage: ALT, AST, LDH Cholestasis: ALP, GGT, bilirubin, bile acids Biosynthetic function: PT/ INR, albumin, cholesterol Metabolic function: bilirubin, ammonia, glucose, ICG  Clinical scores of decompensation: CPS, MELD    9
  • 10.
  • 11.
  • 12.
    Markers of HepatocellularDamage    ALT & AST most frequently used Released when hepatocytes damaged Normal values:    ALT: 5 – 40 IU/L AST: 8 – 20 IU/L Patterns to note:    AST: ALT ratio Level of elevation Rate of decline 12
  • 13.
    ALT vs AST ALT    Cytosol Halflife: 47H Low concentration in other tissues:   Skeletal muscle, kidney, heart More specific for liver    AST Cytosol 20%, mitochondria 80% Half life: cytosol 17H, mitochondria 87H Other tissues:  heart, RBC, skeletal muscle, kidneys, pancreas, brain, lung 13
  • 14.
    AST: ALT Ratio    Normal:0.6 – 0.8 < 1: most liver disorders > 2:       Alcoholic hepatitis: AST < 300 Drugs & toxins Extra-hepatic source Ischemia Cirrhosis Fulminant Wilson’s disease (> 4) 14
  • 15.
    AST: ALT Ratio 90 80 70 60 50 AST/ALT>1 AST/ALT >2 40 30 20 10 0 alcoholic post necrotic cirrhosis chronic hepatitis obstructive jaundice viral hepatitis
  • 16.
    Level of Elevation  ALT> 600 (15x):   ALT < 200 (5x):   Acute hepatic injury Chronic hepatic injury, improved acute injury ALT 200-600 (5-15x):   Less useful Most common scenario! 16
  • 17.
    ALT > 600(15x)     Acute viral hepatitis Acetaminophen overdose Ischemic hepatitis aka shock liver      Drugs & toxins Autoimmune hepatitis Wilson's disease Acute bile duct obstruction Acute Budd Chiari Syndrome Can cause ALT > 3000 (75x) 17
  • 18.
    ALT < 200(5x) ALT Predominant     Chronic hepatitis B, C Acute viral hepatitis NASH Drugs, toxins  Autoimmune hepatitis Metabolic disorders  AST Predominant     Almost any liver disease   Alcoholic liver disease Drugs, toxins NASH Cirrhosis Non-hepatic source:   Haemolysis, myopathy, strenuous exercise Macro-AST: 15-60% of tertiary referrals 18
  • 19.
    Rate of Decline FAST     Shorthalf life drug Ischemic hepatitis Acute biliary tract obstruction Fulminant hepatitis SLOW     Acute viral hepatitis Long half life drug Autoimmune hepatitis Metabolic disorders Green: Ischemic hepatitis Blue: Acute viral hepatitis 19
  • 20.
  • 21.
    Alkaline Phosphatase (ALP)     Mainmarker of cholestasis Normal: 20-70 IU/L Half life: 7 days Sources:    Hepatocytes Osteoblasts, gut, kidney, placenta Biliary obstruction:   Raised levels due to induction of ALP synthesis May not rise until 1-2 days later 21
  • 22.
    Raised ALP: Causes PhysiologicCauses  Age > 60 yrs  Children, adolescents  Pregnancy  Blood group O  Post meal (fatty meal) Pathologic Causes  Intrahepatic cholestasis  Extrahepatic cholestasis (bile duct obstruction) 22
  • 23.
  • 24.
    Raised ALP: PathologicCauses Intrahepatic Obstruction    Drugs Sepsis Others  Infiltrative liver disease  Primary biliary cirrhosis  Primary sclerosing cholangitis (PSC)  Paraneoplastic syndromes Extrahepatic Obstruction  Intraluminal:   Bile duct wall:   Gallstones Cholangiocarcinoma Extraluminal:  Pancreatic cancer, lymph nodes, gallstones (Mirizzi's Syndrome) 24
  • 25.
    -Glutamyl Transpeptidase (GGT)  Mainutility      Differentiate ALP source Not found in bone; not raised in pregnancy/ childhood Sources: liver, kidney, pancreas, intestine, prostate, spleen, heart, brain Half life: 7-10 days; 28 days in alcohol liver injury Isolated GGT elevation:    Due to induction of hepatic microsomal GGT Drugs: warfarin, anticonvulsants, barbiturates Alcohol: also causes hepatocyte leakage 25
  • 26.
  • 27.
    Coagulation Factors    All synthesizedin liver except Factor VIII Mostly present in excess Prothrombin Time (PT): Factors I, II, V, VII, IX, X    Half life: Factor VII – 6H (shortest) Abnormalities only occur when liver's biosynthetic ability substantially impaired Common causes:   Vit K deficiency (malnutrition, malabsorption) Warfarin 27
  • 28.
    Albumin       300 – 500g in body fluid Synthesis: 15 g/ day Degradation: 4% daily Half life: 19 – 21 days Not reliable indicator of acute liver disease Not specific  Depends on nutrition, volume status, vascular integrity, catabolism, hormones, stool/ urine losses 28
  • 29.
    Hypoalbuminemia  Decreased synthesis: proteinmalnutrition, chronic liver disease, chronic inflammation  Increased loss: nephrotic syndrome, protein losing enteropathy  Increased volume: ascites, over-hydration Increased turnover: catabolic states, steroids  Clues: globulin, cholesterol/ TG  29
  • 30.
  • 31.
    'Bilirubin' Pathway RE Cell Plasma Heme→ UCB UCB – Albumin Hepatocyte UCB + 'gluconate' → CB Urobilinogen Stercobilinogen UCB: Unconjugated bilirubin CB: Conjugated bilirubin 31
  • 32.
    Bilirubin Unconjugated Bilirubin      Indirect bilirubin Normal:< 0.8 mg/ dL (< 13.6 µmol/L) Lipid soluble, water insoluble Bound to albumin in plasma Not filtered by kidney → not present in urine Conjugated Bilirubin      Direct bilirubin Normal: 0.3 – 1.0 mg/dL (5.1 – 17.0 µmol/L) Water soluble, lipid insoluble Excreted in bile Filtered by glomerulus → majority reabsorbed, small amount excreted in urine 32
  • 33.
    Isolated Unconjugated Hyperbilirubinemia   Unconjugatedbilirubin > 85% of total bilirubin Increased production:      Haemolysis: rarely > 5 mg/dL (85 µmol/L) Ineffective erythropoiesis: folate/ iron deficiency Drugs: rifampicin, ribavirin Resolution of hematoma Defects in hepatic uptake or conjugation:  Gilbert's syndrome, Criggler – Najjar syndrome 33
  • 34.
    Conjugated Hyperbilirubinemia     Conjugated bilirubin> 50% total bilirubin Cannot differentiate between obstructive & parenchymal causes Tea coloured urine + clay coloured stool: usually cholestatic cause, although parenchymal cause possible Malignant obstruction usually higher values 34
  • 35.
    Delta Bilirubin  Conjugated bilirubincovalently bound to albumin     Important fraction of total bilirubin in patients with cholestasis & hepatobiliary disease Prolonged half life: 19 – 21 days (albumin) Late recovery phase: all bilirubin may be in this form Explains 2 enigmas in patients with raised conjugated bilirubin:   CB declines slowly in patients who are recovering well No bilirubinuria during recovery phase as delta bilirubin not filtered by glomeruli 35
  • 36.
    Summary  Principles of LFTs:   Contextualization,Normal Values, Abnormal Patterns Patterns of Abnormal LFTs     Hepatocellular injury: ALT, AST  AST: ALT ratio  Level of elevation  Rate of decline Cholestasis: ALP, GGT Biosynthetic function: PT, albumin Bilirubin 36
  • 37.
    Conclusion       'LFT's are numerous& somewhat confusing Have limited sensitivity & specificity Not all liver ds have abnormal LFT Not all normal LFTs have normal livers Decrease in values may not mean improvement What to do?    All abnormal LFTs should be investigated LFTs must be contextualized for each patient Refer when unsure 37
  • 38.