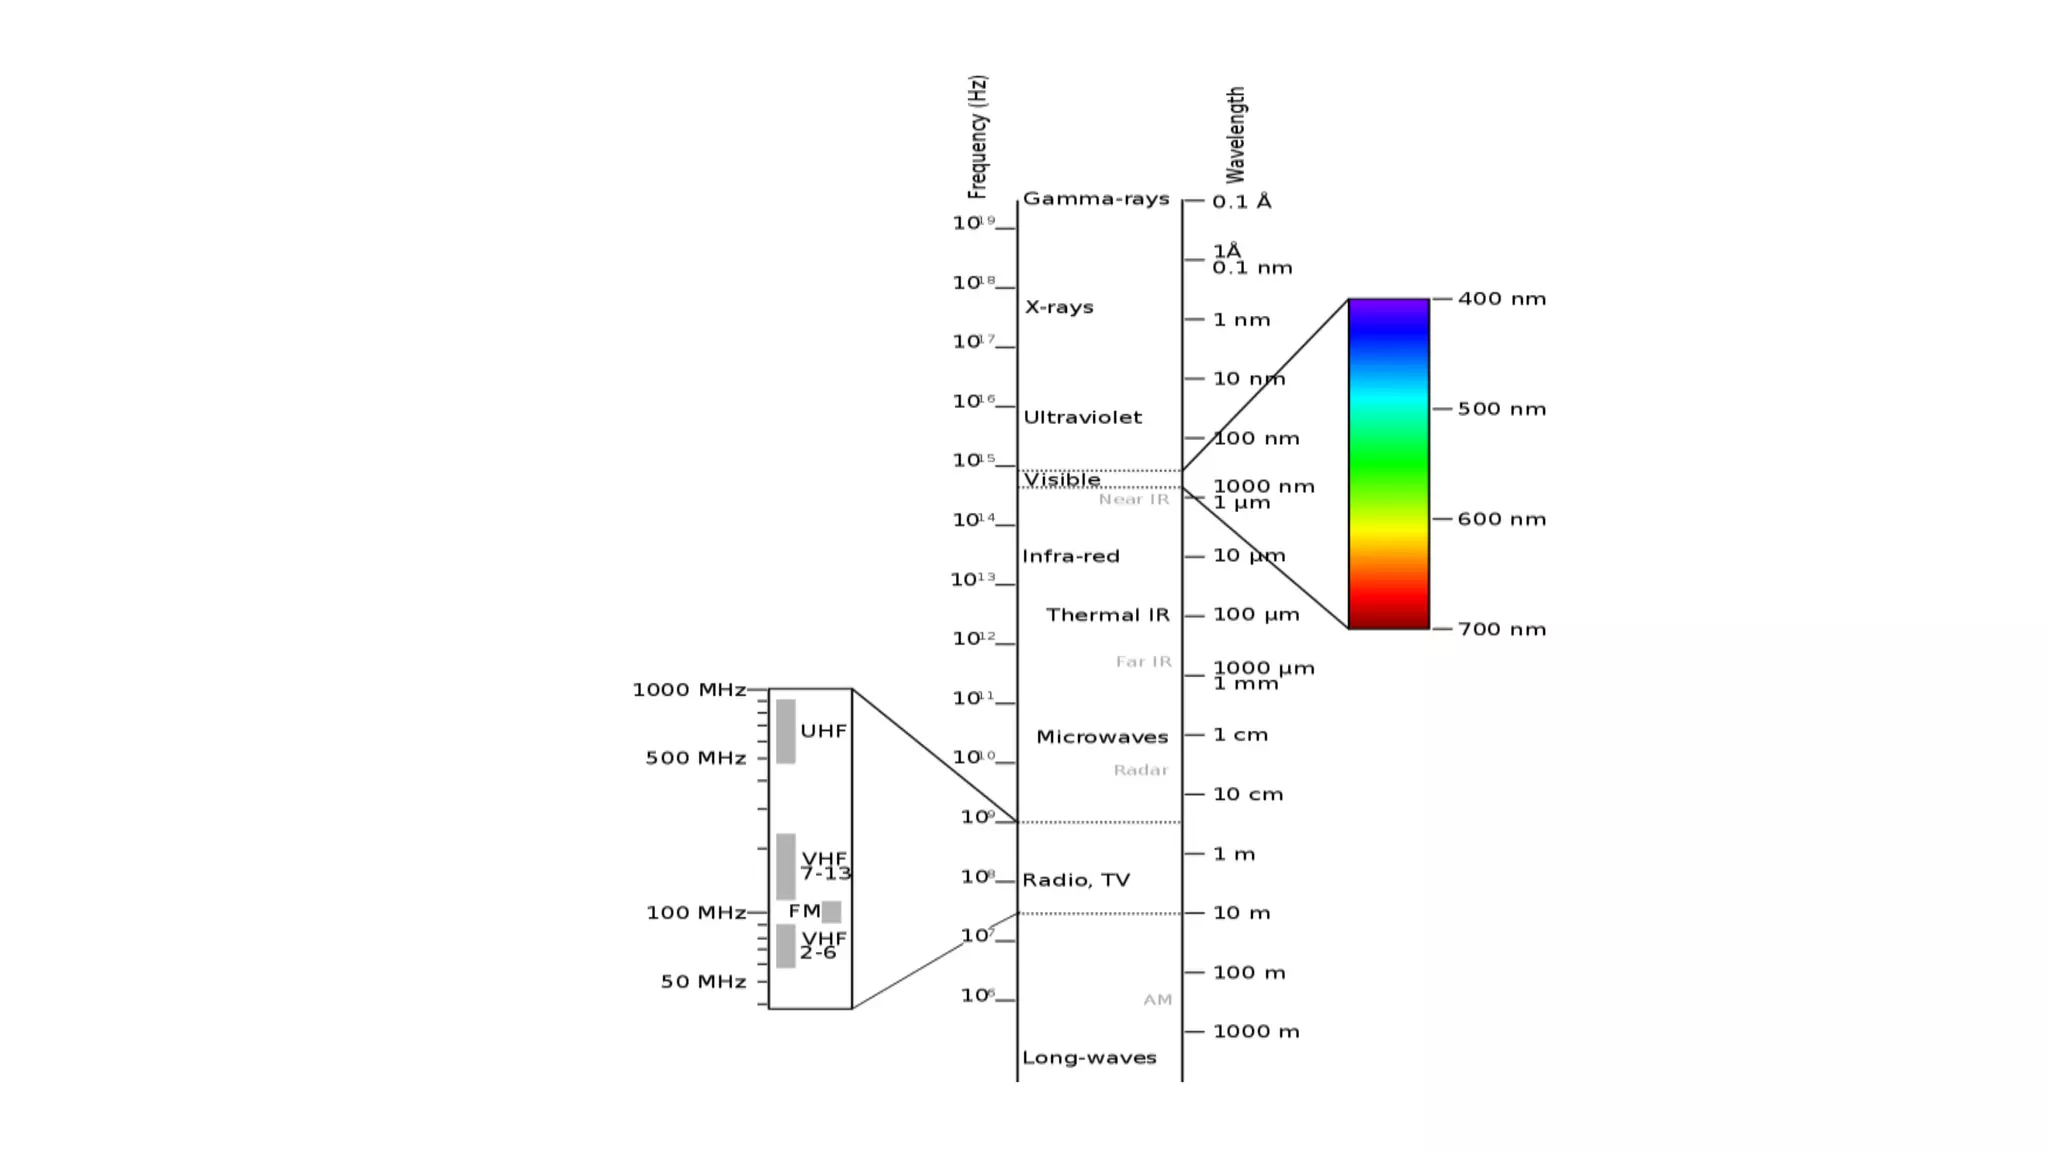
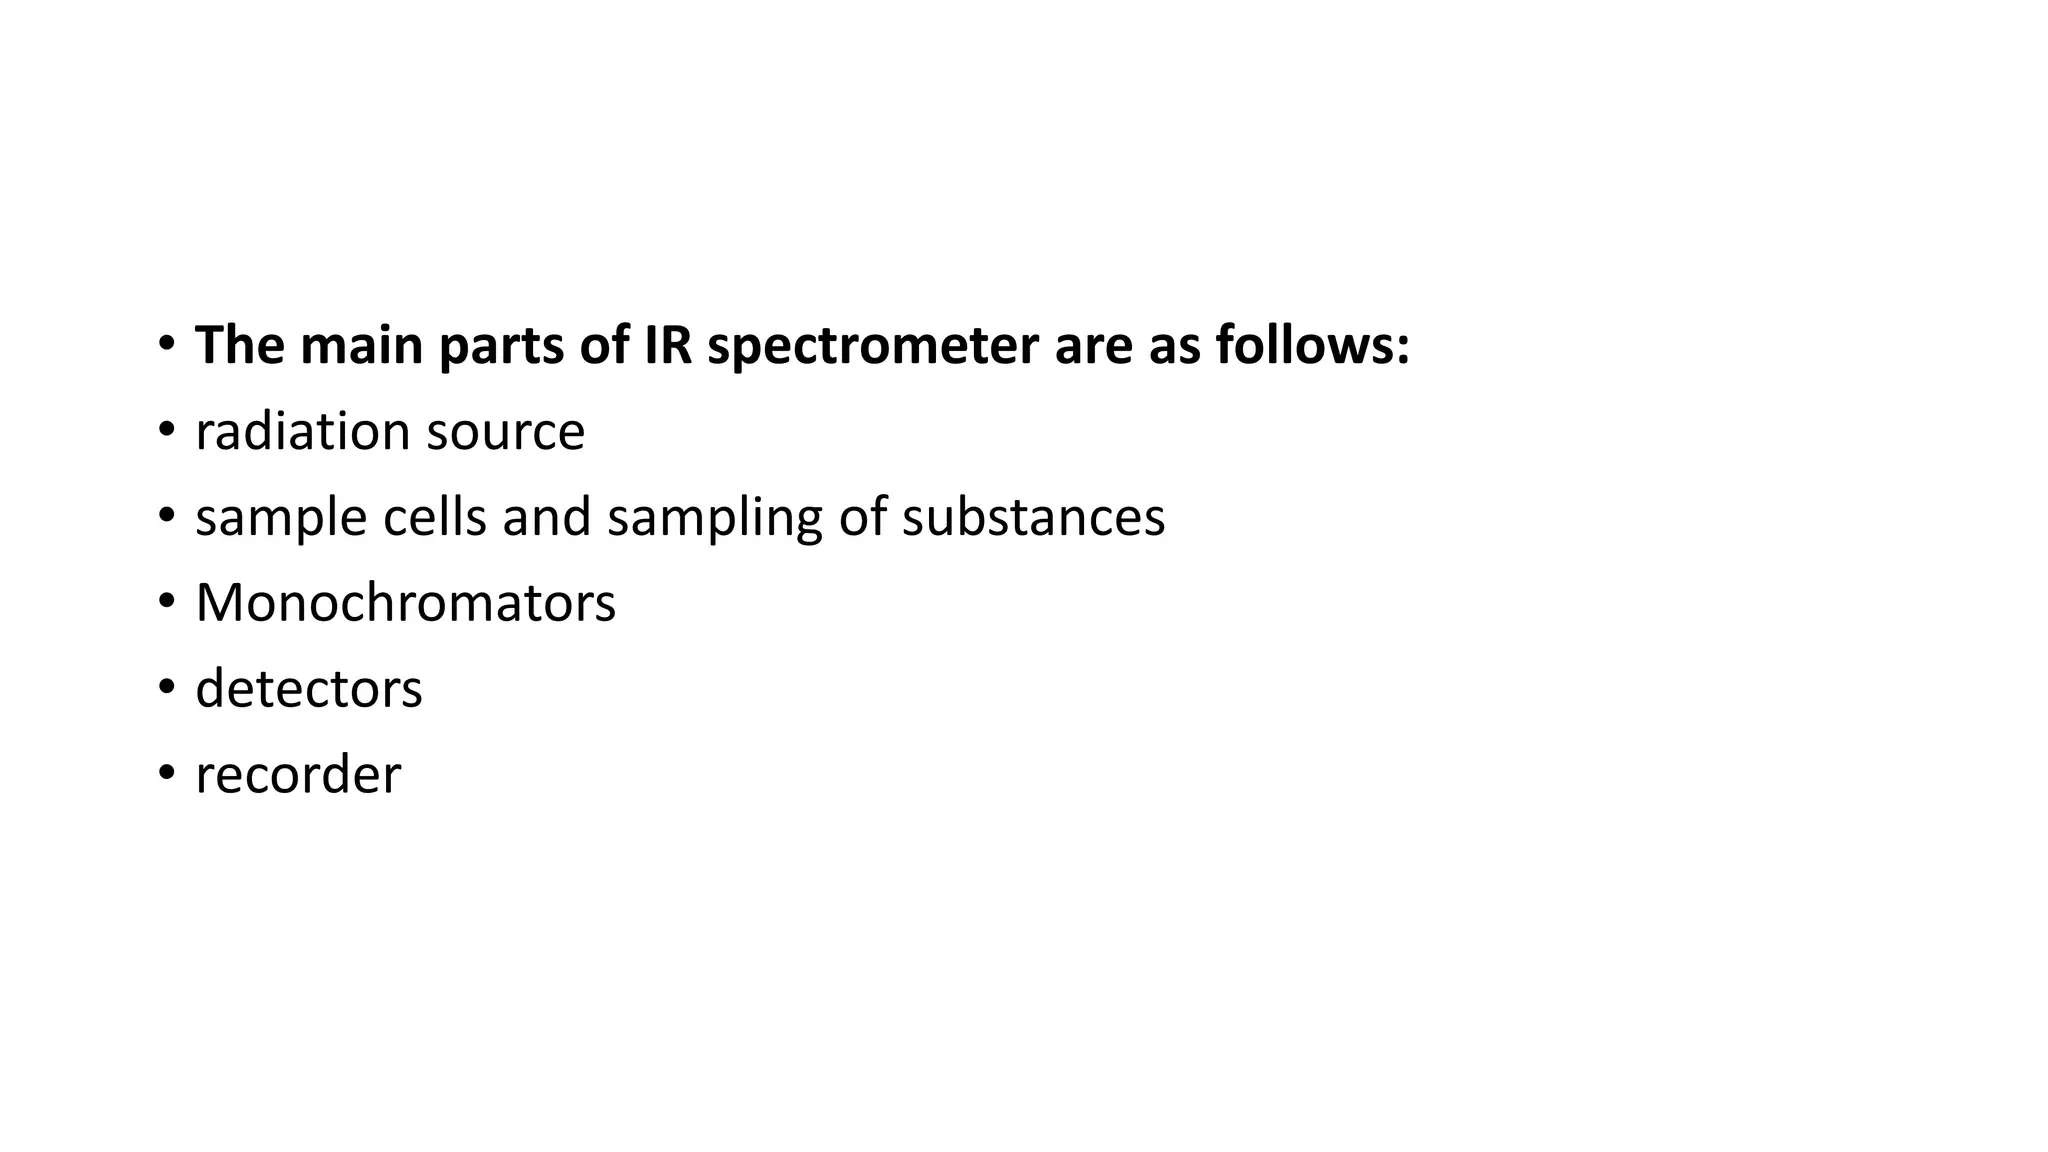
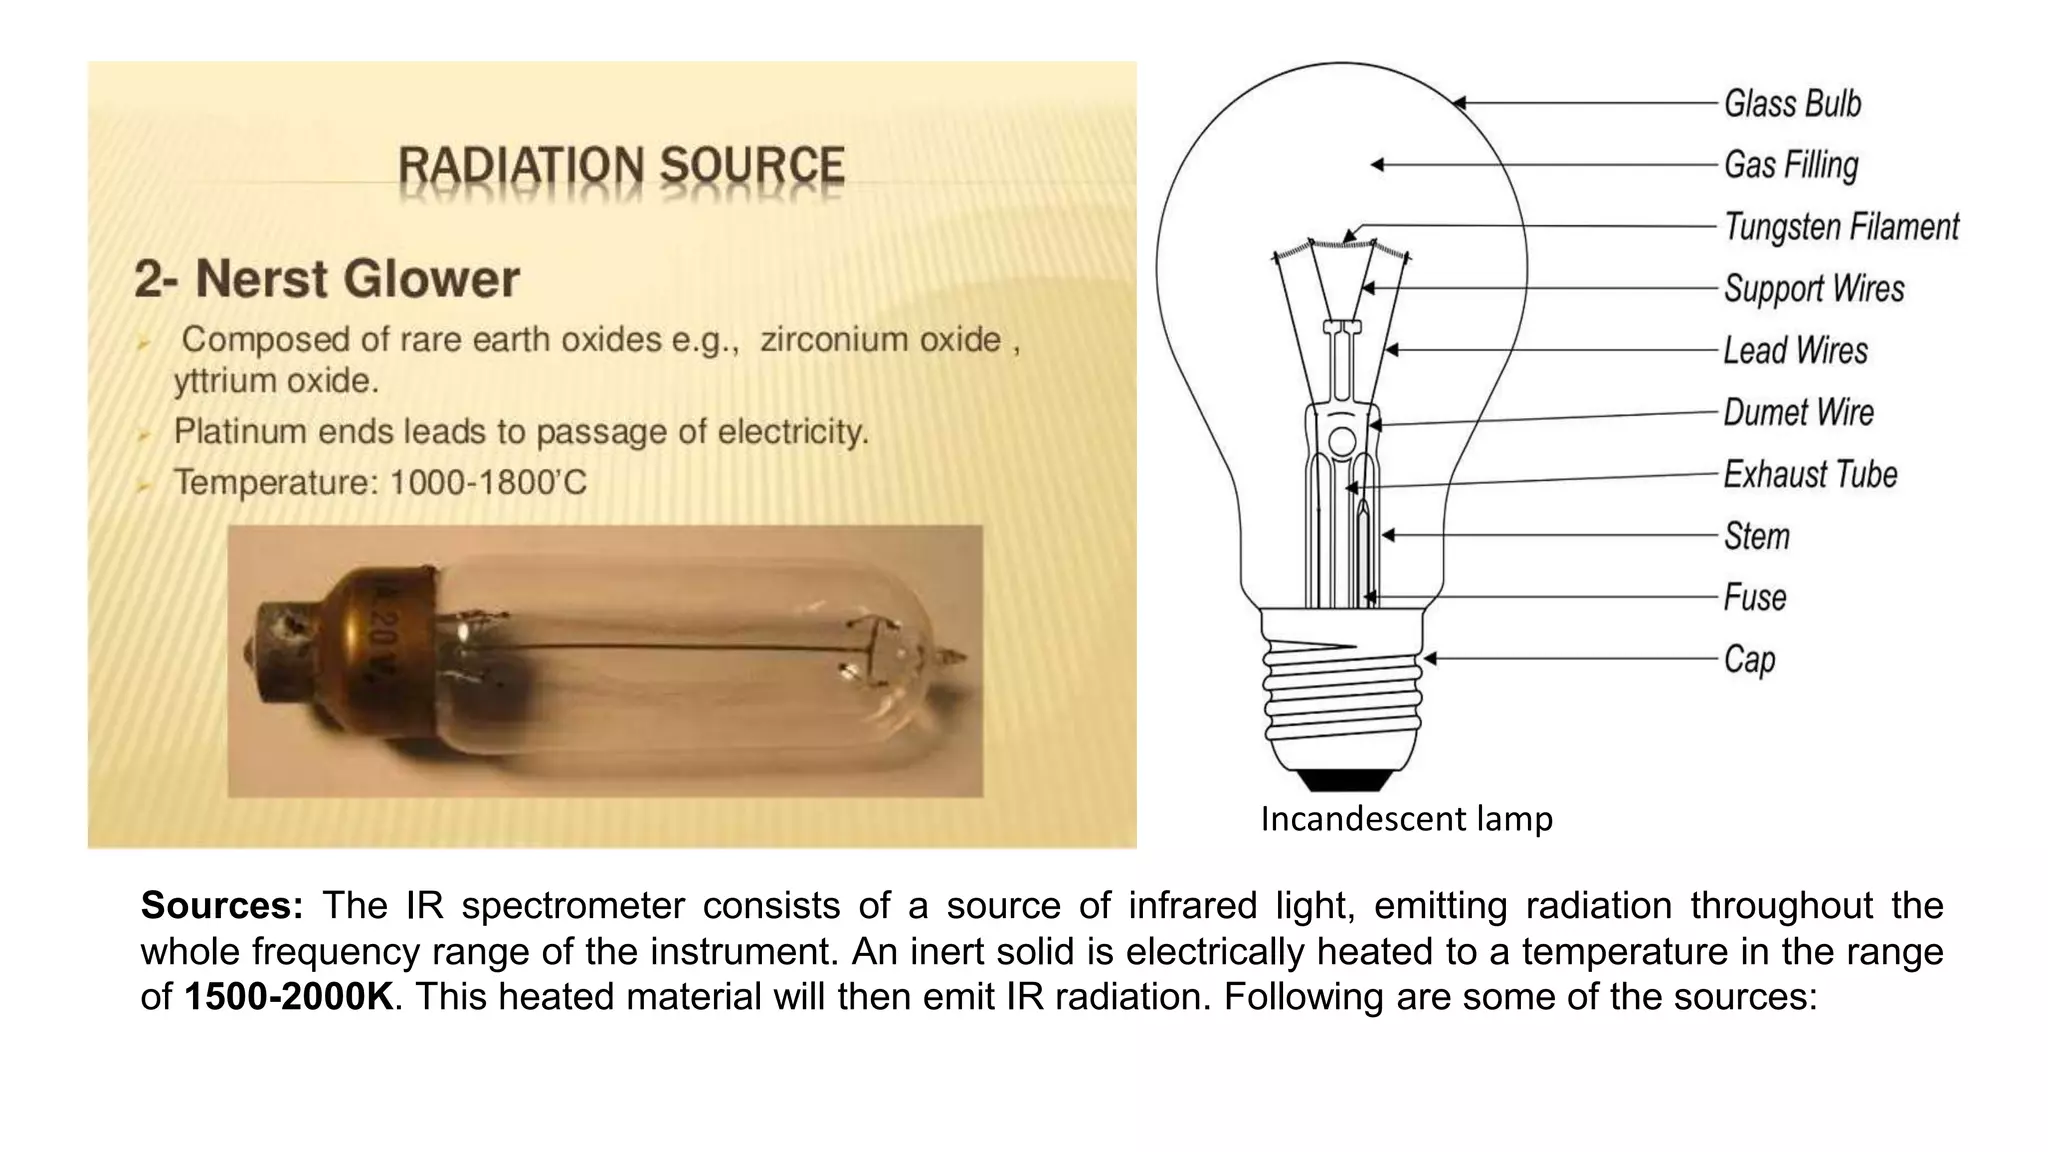
SlideShare a Scribd company logo
Spectroscopy
By
Dr. Krishna
Assistant Professor in Biotechnology
Tumkur University, Tumakuru
IR Spectrophotometer
• Infrared spectroscopy (IR spectroscopy or vibrational spectroscopy) involves the
interaction of infrared radiation with matter. It covers a range of techniques,
mostly based on absorption spectroscopy.
• To identify Chemicals
• Samples may be solid, liquid, or gas
• IR Spectrophotometer instrument – to produce infrared spectrum
• An IR spectrum - visualized in a graph of infrared light absorbance (or
transmittance) on the vertical axis vs. frequency or wavelength on the horizontal
axis.
• units of frequency - in IR spectra are reciprocal centimeters (sometimes called
wave numbers), with the symbol cm−1.
• Units of IR wavelength are commonly given in micrometers (formerly called
"microns"), symbol μm, which are related to wave numbers in a reciprocal way.
• Fourier transform infrared (FTIR) spectrometer, 2d IR – commonly used lab instrument
• The infrared portion of the electromagnetic spectrum is usually divided into three
regions;
• 1. the near-, 2. mid- and 3. far- infrared, named for their relation to the visible spectrum
• The primary source of infrared light is the thermal radiation. This is produced by the
motion of atoms and molecules in an object.
• Every object which has a temperature greater than absolute zero (-273°C), radiates in the
infrared.
• All atomic and molecular motion ceases at absolute zero temperature.
• The wavelength at which an object radiates most intensely depends on its temperature.
In general, as the temperature of an object cools, it shows up more prominently at
farther infrared wavelengths.
• When an object is not quite hot enough to radiate visible light, it will emit most of its
energy in the infrared.
Molecular Transitions:
• Molecular transitions: The energy levels of a molecule in the order of decreasing energy are:
electronic, vibrational and rotational.
• It is based on the assumptions that the nuclear motion is much slower than electron motion and
the nuclear motion (e.g., rotation, vibration) occurs in a smooth potential from the speedy
electrons.
• The quantized energy (quantized energy states is that only certain photon energies are allowed
when electrons jump down from higher levels to lower level) stored in a molecule thus can be
thought of as the sum of energy stored in distinct modes of rotation, vibration, and electronic.
• Electronic transition occurs so rapidly that the internuclear distance can't change much in the
process.
• Vibrational transitions occur between different vibrational levels of the same electronic state.
• Rotational transitions occur mostly between rotational levels of the same vibrational state,
although there are many examples of combination vibration-rotation transitions for light
molecules.
• Molecular transitions result in emission or absorption of photons: the electronic transitions in UV
or optical, vibrational transitions in infrared, rotational transitions in microwave range.
Energy-levels in a molecule: electronic, vibrational and rotational levels
• Periodic motion, in physics, motion repeated in equal intervals of
time. Periodic motion is performed, for example, by a rocking chair, a
bouncing ball, a vibrating tuning fork, a swing in motion, the Earth in
its orbit around the Sun, and a water wave.
• Translational motion is the motion by which a body shifts from one
point in space to another. One example of translational motion is the
the motion of a bullet fired from a gun.
• A molecular vibration occurs when atoms in a molecule are in
periodic motion while the molecule as a whole has constant
translational and rotational motion.
• A molecular vibration is excited when the molecule absorbs a
quantum of energy, E, corresponding to the vibration's frequency.
• Vibrational energy levels of the diatomic HCl molecule is presented in
Figure. as an anharmonic oscillator, the electronic states can be
represented as a function of internuclear distance.
The HCl molecule as an anharmonic oscillator vibrating at
energy level E3. D0 is dissociation energy here, r0 bond length, U
potential energy (Morse potential). Energy is expressed in
wavenumbers. The hydrogen chloride molecule is attached to
the coordinate system to show bond length changes on the
curve.
• Since the vibrational transitions of molecules result in infrared
photons, Simple diatomic molecules with only 2 nuclei perform a
vibration that resembles to a harmonic oscillator. There are several
ways the relative positions of atoms may change in a more
complicated molecule, these are:
• Stretching: a change in the length of a bond
• Bending: a change in the angle between two bonds
• Rocking: a change in angle between a group of atoms
• Wagging: a change in angle between the plane of a group of atoms
• Twisting: a change in the angle between the planes of two groups of
atoms
• Out-of-plane: a change in the angle between any one of the bonds
and the plane defined by the remaining atoms of the molecule
-Each shell made of many sub shells which are
themselves composed of atomic orbitals.
-First shell K have 1 sub shell = s
-Second shell L = 2 sub shells = s , p
-Third shell M = 3 sub shells =s , p, d
-fourth shell N = 4 sub shells = s , p, ,d, f
N
o.
Sub
shell
Name
1 s Sharp
2 p Principa
l
3 D Diffuse
d
4 f fundam
ental
Shells Sub shells No. of electron Type of sub shells
found in shell
Distribution electron
in sub shells
K s 2 only s 1s
L P 6 s ,p, 2s , 2p,
M d 10 s, p, d, 3s , 3p, ,3d
N f 14 s, p, ,d, f , d, 4s , 4p , 4d , 4f
… g and so on 18… s , p, d, f, g,… Alphabetically so
on
Principle of IR
• In the context of infra red spectroscopy the term "infra red" covers the
range of the electromagnetic spectrum between 0.78 and 1000 mm.
Regions of wavelength range
• Wavenumber range (cm-1)
• The most useful I.R. region lies between 4000 - 670cm-1.
• The infrared portion of the electromagnetic spectrum is usually divided
into three regions; the near-, mid- and far- infrared, named for their
relation to the visible spectrum. The higher-energy near-IR, approximately
14000–4000 cm−1 (0.8–2.5 μm wavelength) can excite overtone or
harmonic vibrations. The mid-infrared, approximately 4000–400 cm−1 (2.5–
25 μm) may be used to study the fundamental vibrations and associated
rotational-vibrational structure. The far-infrared, approximately 400–
10 cm−1 (25–1000 μm), lying adjacent to the microwave region
Theory of infra red absorption
• IR radiation does not have enough energy to induce electronic
transitions as seen with UV.
• Absorption of IR is restricted to compounds with small energy
differences in the possible vibrational and rotational states.
• For a molecule to absorb IR, the vibrations or rotations within a
molecule must cause a net change in the dipole moment of the
molecule.
Molecular rotations
• Rotational transitions are of little use to the spectroscopist.
• Rotational levels are quantized, and absorption of IR by gases yields
line spectra.
• However, in liquids or solids, these lines broaden into a continuum
due to molecular collisions and other interactions.
Molecular vibrations
• The positions of atoms in a molecules are not fixed;
they are subject to a number of different vibrations.
Spectra
• The twodimensional plot
• The dependece of transmitance on wavenumber
• Each compound has its own specific spectra
Examples of spectra
Examples of spectra
• Infrared spectroscopy exploits the fact that molecules absorb frequencies that
are characteristic of their structure. These absorptions occur at resonant
frequencies, i.e. the frequency of the absorbed radiation matches the vibrational
frequency.
• The infrared spectrum of a sample is recorded by passing a beam of infrared light
through the sample. When the frequency of the IR is the same as the vibrational
frequency of a bond or collection of bonds, absorption occurs.
• Examination of the transmitted light reveals how much energy was absorbed at
each frequency (or wavelength)
• This measurement can be achieved by scanning the wavelength range using a
monochromator
• This technique is commonly used for analyzing samples with covalent bonds.
• The main parts of IR spectrometer are as follows:
• radiation source
• sample cells and sampling of substances
• Monochromators
• detectors
• recorder
• IR radiation sources
• IR instruments require a source of radiant energy which emit IR
radiation which must be steady, intense enough for detection and
extend over the desired wavelength. Various sources of IR radiations
are as follows.
• a) Nernst glower - Nernst Lamp uses a small ceramic rod that was heated to
incandescence. The lamp is also called a incandescent "glower".
• b) Incandescent lamp - The incandescent lamp was the second form of electric light to
be developed for commercial use after the carbon arc lamp. It is the second most used
lamp in the world today behind fluorescent lamps
• c) Mercury arc
• d) Tungsten lamp
• f) Nichrome wire - Nichrome is any of various alloys of nickel, chromium, and often iron
Incandescent lamp
Sources: The IR spectrometer consists of a source of infrared light, emitting radiation throughout the
whole frequency range of the instrument. An inert solid is electrically heated to a temperature in the range
of 1500-2000K. This heated material will then emit IR radiation. Following are some of the sources:
• sample cells and sampling of substances
• IR spectroscopy has been used for the characterization of solid, liquid
or gas samples.
• i. Solid - Various techniques are used for preparing solid samples such as
pressed pellet technique, solid run in solution, solid films, mull technique etc.
• ii. Liquid – samples can be held using a liquid sample cell made of alkali
halides. Aqueous solvents cannot be used as they will dissolve alkali halides.
Only organic solvents like chloroform can be used.
•
• iii. Gas – sampling of gas is similar to the sampling of liquids.
• Monochromators – Various types of monochromators are prism,
gratings and filters. Prisms are made of Potassium bromide, Sodium
chloride or Caesium iodide. Filters are made up of Lithium Fluoride
and Diffraction gratings are made up of alkali halides.
• Detectors – Detectors are used to measure the intensity of
unabsorbed infrared radiation. Detectors like thermocouples,
Bolometers, thermisters, Golay cell, and pyro-electric detectors are
used.
• Recorders – Recorders are used to record the IR spectrum
• The Nerst Glower: It is a cylinder of rare earth oxides. Platinum wires are
sealed to the ends and a current is passed through the cylinder and can
reach temperatures of around 2200K.
•
The Globar source: It is a silicon carbide rod which is electrically heated to
around 1500K. The spectral output is comparable with the Nerst glower,
except at short wavelengths (less than 5mm) where it’s output becomes
larger.
•
The Incandescent wire source: This is a tightly wound coil of nichrome
wire, which is electrically heated to 1100K. It produces a lower intensity of
radiation than the above mentioned Nerst or Globar sources, but it has a
longer working life.
Optical choppers
Optical choppers, usually rotating disc mechanical shutters,
are widely used in science labs in combination with lock-in
amplifiers. The chopper is used to modulate the intensity
of a light beam, and a lock-in amplifier is used to improve
the signal-to-noise ratio.
Chopper: The two beams are reflected to a chopper which is rotating at
a speed of 10 rotations per second. This chopper makes the reference
and the sample beam to fall on the monochromator grating alternately.
• Monochromator grating: The grating also rotates, though slowly. This rotation sends individual
fre
• Detector: At the wavelength where the sample has absorbed, the detector will receive a weak
beam from the sample while the reference beam will retain full intensity. This leads to a pulsating
or alternating current to flow from detector to amplifier. On the other hand, at the frequencies
where the sample doesn’t absorb, both the beams will have equal intensities and the current
flowing from the detector to the amplifier will be direct and not alternating. The amplifier is
designed to amplify only the alternating current.
There are three different types of detectors.
• Thermocouples: They consist of a pair of junctions of different metals. The potential difference
(i.e.; the voltage) between the junction changes according to the difference in temperature
between the junctions.
•
Pyroelectric detectors: They are made from a single crystalline wafer of a pyroelectric material
(eg; triglycerine sulphate). The properties of a pyroelectric material are such that when an electric
field is applied across it, electric polarisation occurs. In a pyroelectric material, when the field is
removed, the polarisation persists. This degree of polarisation is temperature dependent.
•
Photoelectric detectors: They comprise a film of semiconducting material deposited on a glass
surface, sealed in an evacuated envelope (such as mercury cadmium telluride detector).
IR Spectrophotometer
Spectroscopy

More Related Content

What's hot

fluroscence spectroscopy
fluroscence spectroscopyfluroscence spectroscopy
fluroscence spectroscopyPooja Dhurjad
 
Infrared spectroscopy
Infrared spectroscopy Infrared spectroscopy
Infrared spectroscopy
Prachi Pathak
 
Vibrational Spectrroscopy
Vibrational SpectrroscopyVibrational Spectrroscopy
Vibrational Spectrroscopy
cdtpv
 
Infrared spectroscopy
Infrared spectroscopyInfrared spectroscopy
Infrared spectroscopy
Shabnamkhan113
 
Phase problem
Phase problemPhase problem
Phase problem
Swaraj Prasad
 
Uv visible spectroscopy ppt
Uv visible spectroscopy pptUv visible spectroscopy ppt
Uv visible spectroscopy ppt
Alexa Jacob
 
Spectroscopy
SpectroscopySpectroscopy
Spectroscopy
Chandan Singh
 
Lect. 21 raman spectroscopy introduction
Lect. 21 raman spectroscopy introductionLect. 21 raman spectroscopy introduction
Lect. 21 raman spectroscopy introduction
Shri Shivaji Science College Amravati
 
Photoacoustic spectroscopy
Photoacoustic spectroscopyPhotoacoustic spectroscopy
Photoacoustic spectroscopy
Nijas Mohamed
 
Instrumentation of nmr
Instrumentation of nmrInstrumentation of nmr
Instrumentation of nmr
sanju1234joy
 
NMR spectroscopy- Spin-lattice & spin-spin relaxation, signal splitting & sig...
NMR spectroscopy- Spin-lattice & spin-spin relaxation, signal splitting & sig...NMR spectroscopy- Spin-lattice & spin-spin relaxation, signal splitting & sig...
NMR spectroscopy- Spin-lattice & spin-spin relaxation, signal splitting & sig...
AYESHA NAZEER
 
Ultraviolet (uv) and visible spectroscopy ppt
Ultraviolet (uv) and visible spectroscopy pptUltraviolet (uv) and visible spectroscopy ppt
Ultraviolet (uv) and visible spectroscopy ppt
Bharathiar university
 
Absorbance
AbsorbanceAbsorbance
Absorbance
Yedhu Mohan
 
Infra Red Spectroscopy and Its Applications
Infra Red Spectroscopy and Its ApplicationsInfra Red Spectroscopy and Its Applications
Infra Red Spectroscopy and Its Applications
Vikram Choudhary
 
Spectroscopy of uv visible
Spectroscopy of uv visibleSpectroscopy of uv visible
Spectroscopy of uv visible
Bahauddin Zakariya University lahore
 
Flourescence and phosphorescence
Flourescence and phosphorescenceFlourescence and phosphorescence
Flourescence and phosphorescence
ShifaRajput2
 
uv -visible spectroscopy
 uv -visible spectroscopy uv -visible spectroscopy
uv -visible spectroscopy
keshav pai
 
UV-Vis Spectroscopy
UV-Vis SpectroscopyUV-Vis Spectroscopy
UV-Vis Spectroscopy
Preeti Choudhary
 

What's hot (20)

ORD & CD Spectroscopy
ORD & CD SpectroscopyORD & CD Spectroscopy
ORD & CD Spectroscopy
 
fluroscence spectroscopy
fluroscence spectroscopyfluroscence spectroscopy
fluroscence spectroscopy
 
Infrared spectroscopy
Infrared spectroscopy Infrared spectroscopy
Infrared spectroscopy
 
Vibrational Spectrroscopy
Vibrational SpectrroscopyVibrational Spectrroscopy
Vibrational Spectrroscopy
 
Infrared spectroscopy
Infrared spectroscopyInfrared spectroscopy
Infrared spectroscopy
 
Phase problem
Phase problemPhase problem
Phase problem
 
Uv visible spectroscopy ppt
Uv visible spectroscopy pptUv visible spectroscopy ppt
Uv visible spectroscopy ppt
 
Spectroscopy
SpectroscopySpectroscopy
Spectroscopy
 
Lect. 21 raman spectroscopy introduction
Lect. 21 raman spectroscopy introductionLect. 21 raman spectroscopy introduction
Lect. 21 raman spectroscopy introduction
 
Photoacoustic spectroscopy
Photoacoustic spectroscopyPhotoacoustic spectroscopy
Photoacoustic spectroscopy
 
Instrumentation of nmr
Instrumentation of nmrInstrumentation of nmr
Instrumentation of nmr
 
NMR spectroscopy- Spin-lattice & spin-spin relaxation, signal splitting & sig...
NMR spectroscopy- Spin-lattice & spin-spin relaxation, signal splitting & sig...NMR spectroscopy- Spin-lattice & spin-spin relaxation, signal splitting & sig...
NMR spectroscopy- Spin-lattice & spin-spin relaxation, signal splitting & sig...
 
Ultraviolet (uv) and visible spectroscopy ppt
Ultraviolet (uv) and visible spectroscopy pptUltraviolet (uv) and visible spectroscopy ppt
Ultraviolet (uv) and visible spectroscopy ppt
 
Absorbance
AbsorbanceAbsorbance
Absorbance
 
Infra Red Spectroscopy and Its Applications
Infra Red Spectroscopy and Its ApplicationsInfra Red Spectroscopy and Its Applications
Infra Red Spectroscopy and Its Applications
 
Spectroscopy of uv visible
Spectroscopy of uv visibleSpectroscopy of uv visible
Spectroscopy of uv visible
 
Nmr 2
Nmr 2Nmr 2
Nmr 2
 
Flourescence and phosphorescence
Flourescence and phosphorescenceFlourescence and phosphorescence
Flourescence and phosphorescence
 
uv -visible spectroscopy
 uv -visible spectroscopy uv -visible spectroscopy
uv -visible spectroscopy
 
UV-Vis Spectroscopy
UV-Vis SpectroscopyUV-Vis Spectroscopy
UV-Vis Spectroscopy
 

Similar to Spectroscopy

ir spectroscopy
ir spectroscopyir spectroscopy
ir spectroscopy
komal shinde
 
Infrared spectroscopy
Infrared spectroscopyInfrared spectroscopy
Infrared spectroscopy
Parijat Suryawanshi
 
Infrared (IR) Spectroscopy
Infrared (IR) SpectroscopyInfrared (IR) Spectroscopy
Infrared (IR) Spectroscopy
Ashwani Dhingra
 
Spectroscopy module 6
Spectroscopy module 6Spectroscopy module 6
Spectroscopy module 6
MattSmith321834
 
Infrared spectroscopy i
Infrared spectroscopy  iInfrared spectroscopy  i
Infrared spectroscopy i
DrBasavarajaiahSm
 
1- Lecture 01-EMR- 1st week -06-2020.ppt
1- Lecture 01-EMR- 1st week        -06-2020.ppt1- Lecture 01-EMR- 1st week        -06-2020.ppt
1- Lecture 01-EMR- 1st week -06-2020.ppt
NawabNajam
 
FOURIER TRANSFORM - INFRARED SPECTROSCOPY
FOURIER TRANSFORM - INFRARED SPECTROSCOPYFOURIER TRANSFORM - INFRARED SPECTROSCOPY
FOURIER TRANSFORM - INFRARED SPECTROSCOPY
SalmanLatif14
 
Lasers in urology
Lasers in urologyLasers in urology
Lasers in urology
Priyatham Kasaraneni
 
UV-Visible spectroscopy
UV-Visible spectroscopyUV-Visible spectroscopy
UV-Visible spectroscopy
MehulJain143
 
InfraRed (IR) spectroscopy
InfraRed (IR) spectroscopyInfraRed (IR) spectroscopy
InfraRed (IR) spectroscopy
Harish Chopra
 
Theory of IR spectroscopy
Theory of IR spectroscopyTheory of IR spectroscopy
Theory of IR spectroscopy
chiranjibi68
 
Spectroscpoic techniques
Spectroscpoic techniquesSpectroscpoic techniques
Spectroscpoic techniques
navaneethapulijala
 
ir ppt.pptx
ir ppt.pptxir ppt.pptx
ir ppt.pptx
Supriya Panda
 
INFRARED SPECTROSCOPY.pptx.pdf
INFRARED SPECTROSCOPY.pptx.pdfINFRARED SPECTROSCOPY.pptx.pdf
INFRARED SPECTROSCOPY.pptx.pdf
Mannanpharmacist4you
 
Uv visible spectroscopy with Instrumentation
Uv visible spectroscopy with InstrumentationUv visible spectroscopy with Instrumentation
Uv visible spectroscopy with Instrumentation
SHIVANEE VYAS
 
IR Spectroscopy - Sudheerkumar Kamarapu, M. Pharmacy Lecture pdf
IR Spectroscopy - Sudheerkumar Kamarapu, M. Pharmacy Lecture pdfIR Spectroscopy - Sudheerkumar Kamarapu, M. Pharmacy Lecture pdf
IR Spectroscopy - Sudheerkumar Kamarapu, M. Pharmacy Lecture pdf
Dr. Sudheer Kumar Kamarapu
 
Unit 5 Spectroscopic Techniques-converted (1) (1).pdf
Unit 5 Spectroscopic Techniques-converted (1) (1).pdfUnit 5 Spectroscopic Techniques-converted (1) (1).pdf
Unit 5 Spectroscopic Techniques-converted (1) (1).pdf
SurajShinde558909
 

Similar to Spectroscopy (20)

ir spectroscopy
ir spectroscopyir spectroscopy
ir spectroscopy
 
Infrared spectroscopy
Infrared spectroscopyInfrared spectroscopy
Infrared spectroscopy
 
Infrared (IR) Spectroscopy
Infrared (IR) SpectroscopyInfrared (IR) Spectroscopy
Infrared (IR) Spectroscopy
 
Spectroscopy module 6
Spectroscopy module 6Spectroscopy module 6
Spectroscopy module 6
 
Electromagnetic radiation
Electromagnetic radiationElectromagnetic radiation
Electromagnetic radiation
 
Infrared spectroscopy i
Infrared spectroscopy  iInfrared spectroscopy  i
Infrared spectroscopy i
 
1- Lecture 01-EMR- 1st week -06-2020.ppt
1- Lecture 01-EMR- 1st week        -06-2020.ppt1- Lecture 01-EMR- 1st week        -06-2020.ppt
1- Lecture 01-EMR- 1st week -06-2020.ppt
 
FOURIER TRANSFORM - INFRARED SPECTROSCOPY
FOURIER TRANSFORM - INFRARED SPECTROSCOPYFOURIER TRANSFORM - INFRARED SPECTROSCOPY
FOURIER TRANSFORM - INFRARED SPECTROSCOPY
 
Lasers in urology
Lasers in urologyLasers in urology
Lasers in urology
 
UV-Visible spectroscopy
UV-Visible spectroscopyUV-Visible spectroscopy
UV-Visible spectroscopy
 
InfraRed (IR) spectroscopy
InfraRed (IR) spectroscopyInfraRed (IR) spectroscopy
InfraRed (IR) spectroscopy
 
Theory of IR spectroscopy
Theory of IR spectroscopyTheory of IR spectroscopy
Theory of IR spectroscopy
 
Spectroscpoic techniques
Spectroscpoic techniquesSpectroscpoic techniques
Spectroscpoic techniques
 
ir ppt.pptx
ir ppt.pptxir ppt.pptx
ir ppt.pptx
 
Ir
IrIr
Ir
 
INFRARED SPECTROSCOPY.pptx.pdf
INFRARED SPECTROSCOPY.pptx.pdfINFRARED SPECTROSCOPY.pptx.pdf
INFRARED SPECTROSCOPY.pptx.pdf
 
Uv visible spectroscopy with Instrumentation
Uv visible spectroscopy with InstrumentationUv visible spectroscopy with Instrumentation
Uv visible spectroscopy with Instrumentation
 
Basic understanding of Infrared Spectroscopy
Basic understanding of Infrared SpectroscopyBasic understanding of Infrared Spectroscopy
Basic understanding of Infrared Spectroscopy
 
IR Spectroscopy - Sudheerkumar Kamarapu, M. Pharmacy Lecture pdf
IR Spectroscopy - Sudheerkumar Kamarapu, M. Pharmacy Lecture pdfIR Spectroscopy - Sudheerkumar Kamarapu, M. Pharmacy Lecture pdf
IR Spectroscopy - Sudheerkumar Kamarapu, M. Pharmacy Lecture pdf
 
Unit 5 Spectroscopic Techniques-converted (1) (1).pdf
Unit 5 Spectroscopic Techniques-converted (1) (1).pdfUnit 5 Spectroscopic Techniques-converted (1) (1).pdf
Unit 5 Spectroscopic Techniques-converted (1) (1).pdf
 

More from Mangalore University

Oet 2017 18
Oet 2017 18Oet 2017 18
Animal bt and imm and ge
Animal bt and imm and geAnimal bt and imm and ge
Animal bt and imm and ge
Mangalore University
 
Coupling and repulsion human genetics
Coupling and repulsion human geneticsCoupling and repulsion human genetics
Coupling and repulsion human genetics
Mangalore University
 
Linkage and crossing over.. Dr. krishna
Linkage and crossing over.. Dr. krishnaLinkage and crossing over.. Dr. krishna
Linkage and crossing over.. Dr. krishna
Mangalore University
 
Mutation i 2018
Mutation i 2018Mutation i 2018
Mutation i 2018
Mangalore University
 
Transport and transport protein in cell biology
Transport and transport protein in cell biologyTransport and transport protein in cell biology
Transport and transport protein in cell biology
Mangalore University
 
Ucst biotechnology 2018 19 naac prtn by dr. krishna
Ucst biotechnology 2018 19 naac prtn by dr. krishnaUcst biotechnology 2018 19 naac prtn by dr. krishna
Ucst biotechnology 2018 19 naac prtn by dr. krishna
Mangalore University
 
Ultra structure of cell wall
Ultra structure of cell wallUltra structure of cell wall
Ultra structure of cell wall
Mangalore University
 
The history of cells and cell theory
The history of cells and cell theoryThe history of cells and cell theory
The history of cells and cell theory
Mangalore University
 

More from Mangalore University (10)

Oet 2017 18
Oet 2017 18Oet 2017 18
Oet 2017 18
 
Animal bt and imm and ge
Animal bt and imm and geAnimal bt and imm and ge
Animal bt and imm and ge
 
Coupling and repulsion human genetics
Coupling and repulsion human geneticsCoupling and repulsion human genetics
Coupling and repulsion human genetics
 
Linkage and crossing over.. Dr. krishna
Linkage and crossing over.. Dr. krishnaLinkage and crossing over.. Dr. krishna
Linkage and crossing over.. Dr. krishna
 
Mutation i 2018
Mutation i 2018Mutation i 2018
Mutation i 2018
 
Transport and transport protein in cell biology
Transport and transport protein in cell biologyTransport and transport protein in cell biology
Transport and transport protein in cell biology
 
Ucst biotechnology 2018 19 naac prtn by dr. krishna
Ucst biotechnology 2018 19 naac prtn by dr. krishnaUcst biotechnology 2018 19 naac prtn by dr. krishna
Ucst biotechnology 2018 19 naac prtn by dr. krishna
 
Ultra structure of cell wall
Ultra structure of cell wallUltra structure of cell wall
Ultra structure of cell wall
 
The history of cells and cell theory
The history of cells and cell theoryThe history of cells and cell theory
The history of cells and cell theory
 
Krishna Cv[1]
Krishna Cv[1]Krishna Cv[1]
Krishna Cv[1]
 

Recently uploaded

Operation Blue Star - Saka Neela Tara
Operation Blue Star   -  Saka Neela TaraOperation Blue Star   -  Saka Neela Tara
Operation Blue Star - Saka Neela Tara
Balvir Singh
 
Instructions for Submissions thorugh G- Classroom.pptx
Instructions for Submissions thorugh G- Classroom.pptxInstructions for Submissions thorugh G- Classroom.pptx
Instructions for Submissions thorugh G- Classroom.pptx
Jheel Barad
 
Palestine last event orientationfvgnh .pptx
Palestine last event orientationfvgnh .pptxPalestine last event orientationfvgnh .pptx
Palestine last event orientationfvgnh .pptx
RaedMohamed3
 
aaaaaaaaaaaaaaaaaaaaaaaaaaaaaaaaaaaaaaaaa
aaaaaaaaaaaaaaaaaaaaaaaaaaaaaaaaaaaaaaaaaaaaaaaaaaaaaaaaaaaaaaaaaaaaaaaaaaaaaaaaaa
aaaaaaaaaaaaaaaaaaaaaaaaaaaaaaaaaaaaaaaaa
siemaillard
 
Digital Tools and AI for Teaching Learning and Research
Digital Tools and AI for Teaching Learning and ResearchDigital Tools and AI for Teaching Learning and Research
Digital Tools and AI for Teaching Learning and Research
Vikramjit Singh
 
Polish students' mobility in the Czech Republic
Polish students' mobility in the Czech RepublicPolish students' mobility in the Czech Republic
Polish students' mobility in the Czech Republic
Anna Sz.
 
The Challenger.pdf DNHS Official Publication
The Challenger.pdf DNHS Official PublicationThe Challenger.pdf DNHS Official Publication
The Challenger.pdf DNHS Official Publication
Delapenabediema
 
Welcome to TechSoup New Member Orientation and Q&A (May 2024).pdf
Welcome to TechSoup   New Member Orientation and Q&A (May 2024).pdfWelcome to TechSoup   New Member Orientation and Q&A (May 2024).pdf
Welcome to TechSoup New Member Orientation and Q&A (May 2024).pdf
TechSoup
 
Fish and Chips - have they had their chips
Fish and Chips - have they had their chipsFish and Chips - have they had their chips
Fish and Chips - have they had their chips
GeoBlogs
 
aaaaaaaaaaaaaaaaaaaaaaaaaaaaaaaaaaaaaaaaaaaaaaaaaaaaaaa
aaaaaaaaaaaaaaaaaaaaaaaaaaaaaaaaaaaaaaaaaaaaaaaaaaaaaaaaaaaaaaaaaaaaaaaaaaaaaaaaaaaaaaaaaaaaaaaaaaaaaaaaaaaaaa
aaaaaaaaaaaaaaaaaaaaaaaaaaaaaaaaaaaaaaaaaaaaaaaaaaaaaaa
siemaillard
 
Supporting (UKRI) OA monographs at Salford.pptx
Supporting (UKRI) OA monographs at Salford.pptxSupporting (UKRI) OA monographs at Salford.pptx
Supporting (UKRI) OA monographs at Salford.pptx
Jisc
 
How to Split Bills in the Odoo 17 POS Module
How to Split Bills in the Odoo 17 POS ModuleHow to Split Bills in the Odoo 17 POS Module
How to Split Bills in the Odoo 17 POS Module
Celine George
 
GIÁO ÁN DẠY THÊM (KẾ HOẠCH BÀI BUỔI 2) - TIẾNG ANH 8 GLOBAL SUCCESS (2 CỘT) N...
GIÁO ÁN DẠY THÊM (KẾ HOẠCH BÀI BUỔI 2) - TIẾNG ANH 8 GLOBAL SUCCESS (2 CỘT) N...GIÁO ÁN DẠY THÊM (KẾ HOẠCH BÀI BUỔI 2) - TIẾNG ANH 8 GLOBAL SUCCESS (2 CỘT) N...
GIÁO ÁN DẠY THÊM (KẾ HOẠCH BÀI BUỔI 2) - TIẾNG ANH 8 GLOBAL SUCCESS (2 CỘT) N...
Nguyen Thanh Tu Collection
 
How libraries can support authors with open access requirements for UKRI fund...
How libraries can support authors with open access requirements for UKRI fund...How libraries can support authors with open access requirements for UKRI fund...
How libraries can support authors with open access requirements for UKRI fund...
Jisc
 
CLASS 11 CBSE B.St Project AIDS TO TRADE - INSURANCE
CLASS 11 CBSE B.St Project AIDS TO TRADE - INSURANCECLASS 11 CBSE B.St Project AIDS TO TRADE - INSURANCE
CLASS 11 CBSE B.St Project AIDS TO TRADE - INSURANCE
BhavyaRajput3
 
TESDA TM1 REVIEWER FOR NATIONAL ASSESSMENT WRITTEN AND ORAL QUESTIONS WITH A...
TESDA TM1 REVIEWER  FOR NATIONAL ASSESSMENT WRITTEN AND ORAL QUESTIONS WITH A...TESDA TM1 REVIEWER  FOR NATIONAL ASSESSMENT WRITTEN AND ORAL QUESTIONS WITH A...
TESDA TM1 REVIEWER FOR NATIONAL ASSESSMENT WRITTEN AND ORAL QUESTIONS WITH A...
EugeneSaldivar
 
Mule 4.6 & Java 17 Upgrade | MuleSoft Mysore Meetup #46
Mule 4.6 & Java 17 Upgrade | MuleSoft Mysore Meetup #46Mule 4.6 & Java 17 Upgrade | MuleSoft Mysore Meetup #46
Mule 4.6 & Java 17 Upgrade | MuleSoft Mysore Meetup #46
MysoreMuleSoftMeetup
 
Ethnobotany and Ethnopharmacology ......
Ethnobotany and Ethnopharmacology ......Ethnobotany and Ethnopharmacology ......
Ethnobotany and Ethnopharmacology ......
Ashokrao Mane college of Pharmacy Peth-Vadgaon
 
How to Create Map Views in the Odoo 17 ERP
How to Create Map Views in the Odoo 17 ERPHow to Create Map Views in the Odoo 17 ERP
How to Create Map Views in the Odoo 17 ERP
Celine George
 
Synthetic Fiber Construction in lab .pptx
Synthetic Fiber Construction in lab .pptxSynthetic Fiber Construction in lab .pptx
Synthetic Fiber Construction in lab .pptx
Pavel ( NSTU)
 

Recently uploaded (20)

Operation Blue Star - Saka Neela Tara
Operation Blue Star   -  Saka Neela TaraOperation Blue Star   -  Saka Neela Tara
Operation Blue Star - Saka Neela Tara
 
Instructions for Submissions thorugh G- Classroom.pptx
Instructions for Submissions thorugh G- Classroom.pptxInstructions for Submissions thorugh G- Classroom.pptx
Instructions for Submissions thorugh G- Classroom.pptx
 
Palestine last event orientationfvgnh .pptx
Palestine last event orientationfvgnh .pptxPalestine last event orientationfvgnh .pptx
Palestine last event orientationfvgnh .pptx
 
aaaaaaaaaaaaaaaaaaaaaaaaaaaaaaaaaaaaaaaaa
aaaaaaaaaaaaaaaaaaaaaaaaaaaaaaaaaaaaaaaaaaaaaaaaaaaaaaaaaaaaaaaaaaaaaaaaaaaaaaaaaa
aaaaaaaaaaaaaaaaaaaaaaaaaaaaaaaaaaaaaaaaa
 
Digital Tools and AI for Teaching Learning and Research
Digital Tools and AI for Teaching Learning and ResearchDigital Tools and AI for Teaching Learning and Research
Digital Tools and AI for Teaching Learning and Research
 
Polish students' mobility in the Czech Republic
Polish students' mobility in the Czech RepublicPolish students' mobility in the Czech Republic
Polish students' mobility in the Czech Republic
 
The Challenger.pdf DNHS Official Publication
The Challenger.pdf DNHS Official PublicationThe Challenger.pdf DNHS Official Publication
The Challenger.pdf DNHS Official Publication
 
Welcome to TechSoup New Member Orientation and Q&A (May 2024).pdf
Welcome to TechSoup   New Member Orientation and Q&A (May 2024).pdfWelcome to TechSoup   New Member Orientation and Q&A (May 2024).pdf
Welcome to TechSoup New Member Orientation and Q&A (May 2024).pdf
 
Fish and Chips - have they had their chips
Fish and Chips - have they had their chipsFish and Chips - have they had their chips
Fish and Chips - have they had their chips
 
aaaaaaaaaaaaaaaaaaaaaaaaaaaaaaaaaaaaaaaaaaaaaaaaaaaaaaa
aaaaaaaaaaaaaaaaaaaaaaaaaaaaaaaaaaaaaaaaaaaaaaaaaaaaaaaaaaaaaaaaaaaaaaaaaaaaaaaaaaaaaaaaaaaaaaaaaaaaaaaaaaaaaa
aaaaaaaaaaaaaaaaaaaaaaaaaaaaaaaaaaaaaaaaaaaaaaaaaaaaaaa
 
Supporting (UKRI) OA monographs at Salford.pptx
Supporting (UKRI) OA monographs at Salford.pptxSupporting (UKRI) OA monographs at Salford.pptx
Supporting (UKRI) OA monographs at Salford.pptx
 
How to Split Bills in the Odoo 17 POS Module
How to Split Bills in the Odoo 17 POS ModuleHow to Split Bills in the Odoo 17 POS Module
How to Split Bills in the Odoo 17 POS Module
 
GIÁO ÁN DẠY THÊM (KẾ HOẠCH BÀI BUỔI 2) - TIẾNG ANH 8 GLOBAL SUCCESS (2 CỘT) N...
GIÁO ÁN DẠY THÊM (KẾ HOẠCH BÀI BUỔI 2) - TIẾNG ANH 8 GLOBAL SUCCESS (2 CỘT) N...GIÁO ÁN DẠY THÊM (KẾ HOẠCH BÀI BUỔI 2) - TIẾNG ANH 8 GLOBAL SUCCESS (2 CỘT) N...
GIÁO ÁN DẠY THÊM (KẾ HOẠCH BÀI BUỔI 2) - TIẾNG ANH 8 GLOBAL SUCCESS (2 CỘT) N...
 
How libraries can support authors with open access requirements for UKRI fund...
How libraries can support authors with open access requirements for UKRI fund...How libraries can support authors with open access requirements for UKRI fund...
How libraries can support authors with open access requirements for UKRI fund...
 
CLASS 11 CBSE B.St Project AIDS TO TRADE - INSURANCE
CLASS 11 CBSE B.St Project AIDS TO TRADE - INSURANCECLASS 11 CBSE B.St Project AIDS TO TRADE - INSURANCE
CLASS 11 CBSE B.St Project AIDS TO TRADE - INSURANCE
 
TESDA TM1 REVIEWER FOR NATIONAL ASSESSMENT WRITTEN AND ORAL QUESTIONS WITH A...
TESDA TM1 REVIEWER  FOR NATIONAL ASSESSMENT WRITTEN AND ORAL QUESTIONS WITH A...TESDA TM1 REVIEWER  FOR NATIONAL ASSESSMENT WRITTEN AND ORAL QUESTIONS WITH A...
TESDA TM1 REVIEWER FOR NATIONAL ASSESSMENT WRITTEN AND ORAL QUESTIONS WITH A...
 
Mule 4.6 & Java 17 Upgrade | MuleSoft Mysore Meetup #46
Mule 4.6 & Java 17 Upgrade | MuleSoft Mysore Meetup #46Mule 4.6 & Java 17 Upgrade | MuleSoft Mysore Meetup #46
Mule 4.6 & Java 17 Upgrade | MuleSoft Mysore Meetup #46
 
Ethnobotany and Ethnopharmacology ......
Ethnobotany and Ethnopharmacology ......Ethnobotany and Ethnopharmacology ......
Ethnobotany and Ethnopharmacology ......
 
How to Create Map Views in the Odoo 17 ERP
How to Create Map Views in the Odoo 17 ERPHow to Create Map Views in the Odoo 17 ERP
How to Create Map Views in the Odoo 17 ERP
 
Synthetic Fiber Construction in lab .pptx
Synthetic Fiber Construction in lab .pptxSynthetic Fiber Construction in lab .pptx
Synthetic Fiber Construction in lab .pptx
 

Spectroscopy

  • 1. Spectroscopy By Dr. Krishna Assistant Professor in Biotechnology Tumkur University, Tumakuru
  • 2. IR Spectrophotometer • Infrared spectroscopy (IR spectroscopy or vibrational spectroscopy) involves the interaction of infrared radiation with matter. It covers a range of techniques, mostly based on absorption spectroscopy. • To identify Chemicals • Samples may be solid, liquid, or gas • IR Spectrophotometer instrument – to produce infrared spectrum • An IR spectrum - visualized in a graph of infrared light absorbance (or transmittance) on the vertical axis vs. frequency or wavelength on the horizontal axis. • units of frequency - in IR spectra are reciprocal centimeters (sometimes called wave numbers), with the symbol cm−1. • Units of IR wavelength are commonly given in micrometers (formerly called "microns"), symbol μm, which are related to wave numbers in a reciprocal way.
  • 3. • Fourier transform infrared (FTIR) spectrometer, 2d IR – commonly used lab instrument • The infrared portion of the electromagnetic spectrum is usually divided into three regions; • 1. the near-, 2. mid- and 3. far- infrared, named for their relation to the visible spectrum • The primary source of infrared light is the thermal radiation. This is produced by the motion of atoms and molecules in an object. • Every object which has a temperature greater than absolute zero (-273°C), radiates in the infrared. • All atomic and molecular motion ceases at absolute zero temperature. • The wavelength at which an object radiates most intensely depends on its temperature. In general, as the temperature of an object cools, it shows up more prominently at farther infrared wavelengths. • When an object is not quite hot enough to radiate visible light, it will emit most of its energy in the infrared.
  • 4.
  • 5. Molecular Transitions: • Molecular transitions: The energy levels of a molecule in the order of decreasing energy are: electronic, vibrational and rotational. • It is based on the assumptions that the nuclear motion is much slower than electron motion and the nuclear motion (e.g., rotation, vibration) occurs in a smooth potential from the speedy electrons. • The quantized energy (quantized energy states is that only certain photon energies are allowed when electrons jump down from higher levels to lower level) stored in a molecule thus can be thought of as the sum of energy stored in distinct modes of rotation, vibration, and electronic. • Electronic transition occurs so rapidly that the internuclear distance can't change much in the process. • Vibrational transitions occur between different vibrational levels of the same electronic state. • Rotational transitions occur mostly between rotational levels of the same vibrational state, although there are many examples of combination vibration-rotation transitions for light molecules. • Molecular transitions result in emission or absorption of photons: the electronic transitions in UV or optical, vibrational transitions in infrared, rotational transitions in microwave range.
  • 6. Energy-levels in a molecule: electronic, vibrational and rotational levels
  • 7. • Periodic motion, in physics, motion repeated in equal intervals of time. Periodic motion is performed, for example, by a rocking chair, a bouncing ball, a vibrating tuning fork, a swing in motion, the Earth in its orbit around the Sun, and a water wave. • Translational motion is the motion by which a body shifts from one point in space to another. One example of translational motion is the the motion of a bullet fired from a gun. • A molecular vibration occurs when atoms in a molecule are in periodic motion while the molecule as a whole has constant translational and rotational motion. • A molecular vibration is excited when the molecule absorbs a quantum of energy, E, corresponding to the vibration's frequency.
  • 8. • Vibrational energy levels of the diatomic HCl molecule is presented in Figure. as an anharmonic oscillator, the electronic states can be represented as a function of internuclear distance. The HCl molecule as an anharmonic oscillator vibrating at energy level E3. D0 is dissociation energy here, r0 bond length, U potential energy (Morse potential). Energy is expressed in wavenumbers. The hydrogen chloride molecule is attached to the coordinate system to show bond length changes on the curve.
  • 9. • Since the vibrational transitions of molecules result in infrared photons, Simple diatomic molecules with only 2 nuclei perform a vibration that resembles to a harmonic oscillator. There are several ways the relative positions of atoms may change in a more complicated molecule, these are: • Stretching: a change in the length of a bond • Bending: a change in the angle between two bonds • Rocking: a change in angle between a group of atoms • Wagging: a change in angle between the plane of a group of atoms • Twisting: a change in the angle between the planes of two groups of atoms • Out-of-plane: a change in the angle between any one of the bonds and the plane defined by the remaining atoms of the molecule
  • 10.
  • 11. -Each shell made of many sub shells which are themselves composed of atomic orbitals. -First shell K have 1 sub shell = s -Second shell L = 2 sub shells = s , p -Third shell M = 3 sub shells =s , p, d -fourth shell N = 4 sub shells = s , p, ,d, f N o. Sub shell Name 1 s Sharp 2 p Principa l 3 D Diffuse d 4 f fundam ental Shells Sub shells No. of electron Type of sub shells found in shell Distribution electron in sub shells K s 2 only s 1s L P 6 s ,p, 2s , 2p, M d 10 s, p, d, 3s , 3p, ,3d N f 14 s, p, ,d, f , d, 4s , 4p , 4d , 4f … g and so on 18… s , p, d, f, g,… Alphabetically so on
  • 12.
  • 13. Principle of IR • In the context of infra red spectroscopy the term "infra red" covers the range of the electromagnetic spectrum between 0.78 and 1000 mm.
  • 14. Regions of wavelength range • Wavenumber range (cm-1) • The most useful I.R. region lies between 4000 - 670cm-1. • The infrared portion of the electromagnetic spectrum is usually divided into three regions; the near-, mid- and far- infrared, named for their relation to the visible spectrum. The higher-energy near-IR, approximately 14000–4000 cm−1 (0.8–2.5 μm wavelength) can excite overtone or harmonic vibrations. The mid-infrared, approximately 4000–400 cm−1 (2.5– 25 μm) may be used to study the fundamental vibrations and associated rotational-vibrational structure. The far-infrared, approximately 400– 10 cm−1 (25–1000 μm), lying adjacent to the microwave region
  • 15. Theory of infra red absorption • IR radiation does not have enough energy to induce electronic transitions as seen with UV. • Absorption of IR is restricted to compounds with small energy differences in the possible vibrational and rotational states. • For a molecule to absorb IR, the vibrations or rotations within a molecule must cause a net change in the dipole moment of the molecule.
  • 16. Molecular rotations • Rotational transitions are of little use to the spectroscopist. • Rotational levels are quantized, and absorption of IR by gases yields line spectra. • However, in liquids or solids, these lines broaden into a continuum due to molecular collisions and other interactions.
  • 17. Molecular vibrations • The positions of atoms in a molecules are not fixed; they are subject to a number of different vibrations.
  • 18. Spectra • The twodimensional plot • The dependece of transmitance on wavenumber • Each compound has its own specific spectra
  • 21. • Infrared spectroscopy exploits the fact that molecules absorb frequencies that are characteristic of their structure. These absorptions occur at resonant frequencies, i.e. the frequency of the absorbed radiation matches the vibrational frequency. • The infrared spectrum of a sample is recorded by passing a beam of infrared light through the sample. When the frequency of the IR is the same as the vibrational frequency of a bond or collection of bonds, absorption occurs. • Examination of the transmitted light reveals how much energy was absorbed at each frequency (or wavelength) • This measurement can be achieved by scanning the wavelength range using a monochromator • This technique is commonly used for analyzing samples with covalent bonds.
  • 22. • The main parts of IR spectrometer are as follows: • radiation source • sample cells and sampling of substances • Monochromators • detectors • recorder
  • 23. • IR radiation sources • IR instruments require a source of radiant energy which emit IR radiation which must be steady, intense enough for detection and extend over the desired wavelength. Various sources of IR radiations are as follows. • a) Nernst glower - Nernst Lamp uses a small ceramic rod that was heated to incandescence. The lamp is also called a incandescent "glower". • b) Incandescent lamp - The incandescent lamp was the second form of electric light to be developed for commercial use after the carbon arc lamp. It is the second most used lamp in the world today behind fluorescent lamps • c) Mercury arc • d) Tungsten lamp • f) Nichrome wire - Nichrome is any of various alloys of nickel, chromium, and often iron
  • 24. Incandescent lamp Sources: The IR spectrometer consists of a source of infrared light, emitting radiation throughout the whole frequency range of the instrument. An inert solid is electrically heated to a temperature in the range of 1500-2000K. This heated material will then emit IR radiation. Following are some of the sources:
  • 25. • sample cells and sampling of substances • IR spectroscopy has been used for the characterization of solid, liquid or gas samples. • i. Solid - Various techniques are used for preparing solid samples such as pressed pellet technique, solid run in solution, solid films, mull technique etc. • ii. Liquid – samples can be held using a liquid sample cell made of alkali halides. Aqueous solvents cannot be used as they will dissolve alkali halides. Only organic solvents like chloroform can be used. • • iii. Gas – sampling of gas is similar to the sampling of liquids.
  • 26. • Monochromators – Various types of monochromators are prism, gratings and filters. Prisms are made of Potassium bromide, Sodium chloride or Caesium iodide. Filters are made up of Lithium Fluoride and Diffraction gratings are made up of alkali halides. • Detectors – Detectors are used to measure the intensity of unabsorbed infrared radiation. Detectors like thermocouples, Bolometers, thermisters, Golay cell, and pyro-electric detectors are used. • Recorders – Recorders are used to record the IR spectrum
  • 27. • The Nerst Glower: It is a cylinder of rare earth oxides. Platinum wires are sealed to the ends and a current is passed through the cylinder and can reach temperatures of around 2200K. • The Globar source: It is a silicon carbide rod which is electrically heated to around 1500K. The spectral output is comparable with the Nerst glower, except at short wavelengths (less than 5mm) where it’s output becomes larger. • The Incandescent wire source: This is a tightly wound coil of nichrome wire, which is electrically heated to 1100K. It produces a lower intensity of radiation than the above mentioned Nerst or Globar sources, but it has a longer working life.
  • 28.
  • 29. Optical choppers Optical choppers, usually rotating disc mechanical shutters, are widely used in science labs in combination with lock-in amplifiers. The chopper is used to modulate the intensity of a light beam, and a lock-in amplifier is used to improve the signal-to-noise ratio. Chopper: The two beams are reflected to a chopper which is rotating at a speed of 10 rotations per second. This chopper makes the reference and the sample beam to fall on the monochromator grating alternately.
  • 30. • Monochromator grating: The grating also rotates, though slowly. This rotation sends individual fre • Detector: At the wavelength where the sample has absorbed, the detector will receive a weak beam from the sample while the reference beam will retain full intensity. This leads to a pulsating or alternating current to flow from detector to amplifier. On the other hand, at the frequencies where the sample doesn’t absorb, both the beams will have equal intensities and the current flowing from the detector to the amplifier will be direct and not alternating. The amplifier is designed to amplify only the alternating current. There are three different types of detectors. • Thermocouples: They consist of a pair of junctions of different metals. The potential difference (i.e.; the voltage) between the junction changes according to the difference in temperature between the junctions. • Pyroelectric detectors: They are made from a single crystalline wafer of a pyroelectric material (eg; triglycerine sulphate). The properties of a pyroelectric material are such that when an electric field is applied across it, electric polarisation occurs. In a pyroelectric material, when the field is removed, the polarisation persists. This degree of polarisation is temperature dependent. • Photoelectric detectors: They comprise a film of semiconducting material deposited on a glass surface, sealed in an evacuated envelope (such as mercury cadmium telluride detector).