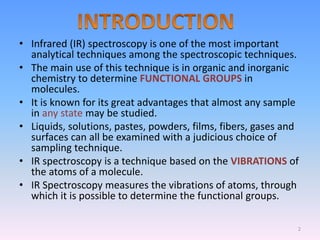
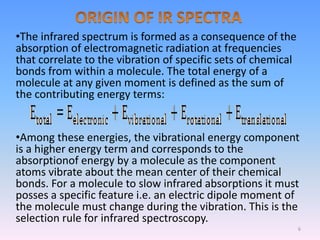
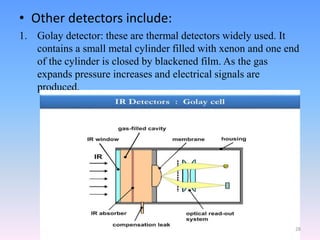
Made By- SALMAN LATIF.
ROLL NO:527.
M.PHARMACY-QAT (FIRST SEMISTER).
DR.D.Y.PATIL COLLEGE OF PHARMACY.
Guided By- Dr. Mrs. SONALI MAHAPARALE MAM
HEAD OF CHEMISTRY DEPT ,
DR.D.Y.PATIL COLLEGE OF PHARMACY.
AKURDI-44.
1
• Infrared (IR) spectroscopy is one of the most important
analytical techniques among the spectroscopic techniques.
• The main use of this technique is in organic and inorganic
chemistry to determine FUNCTIONAL GROUPS in
molecules.
• It is known for its great advantages that almost any sample
in any state may be studied.
• Liquids, solutions, pastes, powders, films, fibers, gases and
surfaces can all be examined with a judicious choice of
sampling technique.
• IR spectroscopy is a technique based on the VIBRATIONS of
the atoms of a molecule.
• IR Spectroscopy measures the vibrations of atoms, through
which it is possible to determine the functional groups.
2
• An infrared spectrum is commonly obtained by
passing infrared radiation through a sample and
determining the fraction of the radiation which
is absorbed at a particular energy.
3
NEAR IR REGION
MIDDLE IR REGION
FAR IR REGION
Region Wavelength range(µm) Wave number range()
Near 0.78-2.5 12800-4000
Middle 2.5-50 4000-200
Far 50-1000 200-10
4
A typical infrared spectrum can be visually divided into
two regions.
• The left half, above 1500
called as Functional group
region.
Functional
group
region :
• The right half of the
spectrum, from 1500-500
called as Fingerprint
region.
Fingerprint
region:
5
•The infrared spectrum is formed as a consequence of the
absorption of electromagnetic radiation at frequencies
that correlate to the vibration of specific sets of chemical
bonds from within a molecule. The total energy of a
molecule at any given moment is defined as the sum of
the contributing energy terms:
•Among these energies, the vibrational energy component
is a higher energy term and corresponds to the
absorptionof energy by a molecule as the component
atoms vibrate about the mean center of their chemical
bonds. For a molecule to slow infrared absorptions it must
posses a specific feature i.e. an electric dipole moment of
the molecule must change during the vibration. This is the
selection rule for infrared spectroscopy.
6
• the fundamental vibrational frequency of a
molecule can be expressed by Hooke’s Law.
Where; = Frequency
c = Speed of light,
k = Force constant, and
µ= Reduced mass.
The reduced mass,
Where; and are the component masses for the
chemical bond under consideration.
7
• For a stronger bond (larger k value), u increases :As
example of this, in order of increasing bond strength
compare:
• CC bonds : C̅̆-C (1000 , C=C(1600 cm−1 ) and CC
(2200cm−1),CH bonds: C-C-H (2900cm−1), C=C-H
(3100cm−1) and CC-H (3300cm−1).
• For heavier atoms attached (larger m value), µ
decreases :
• As example of this, in order of increasing reduced mass
compare :
• C-H (3000 cm−1)
• C-C (1000cm−1)
• C-Cl (800cm−1)
• C-Br (550 cm−1)
• C-I (about 500cm−1)
8
• Thus Hooke’s Law states :
• The vibrational frequency is proportional to the
strength of the spring; the stronger the spring,
the higher the frequency.
• The vibrational frequency is inversely
proportional to the masses at ends of the spring;
the lighter the weights, the higher the frequency.
• As per the Hooke’s Law:
• Stronger bonds absorb at higher frequencies.
• Weaker bonds absorb at lower frequencies
• Bonds between lighter atoms absorb at higher
frequencies.
• Bonds between heavier atoms absorb at lower
frequencies.
9
•Fourier Transform Infrared (FT-IR) spectrometry was
developed in order to overcome the limitations
encountered with dispersive instruments.
•The main difficulty was the slow scanning process.
•As it was necessary for a method for measuring all
of the infrared frequencies simultaneously, rather
than individually, a very simple optical device called
an interferometer was developed.
•Thus, the time element per sample is reduced to a
matter of a few seconds rather than several minutes.
10
• The signal-to-noise ratio of spectrum is
significantly higher than to previous generation
infrared spectrometers.
• The accuracy of wave number is high. The error is
within the range of = 0.01.
• The scan time of all frequencies is short
(approximately 1s).
• The resolution is extremely high(0.1-0.005).
• The scan range is wide (1000-10 cm−1 ).
• The interference from stray light is reduced. Due
the these advantages, FTIR Spectrometers have
replaced dispersive IR spectrometers.
11
• The common FTIR spectrometer consists of the
following components. The major difference
between dispersive IR and FTIR is the inclusion of
interferometer. All other components are almost
same as like that of a dispersive IR spectrometer.
• An interferometer requires an IR light source,
mirrors, beam splitter and detector. However the
components are explained individually as follows:
Source of light
Interferometer
Sample compartment
Detector
Read out device.
12
13
• Infrared energy is emitted from a glowing black –
body source.
• This beam passes through an aperture which
controls the amount of energy presented to the
sample.
• The source is similar to the IR instruments. IR
instruments require a source of radiant energy
which emits IR radiation which must be steady,
intense enough for detection and extend over the
desired wavelength.
• Various sources of IR radiations including Nernst
glower, Incandesecent lamp, Mercury arc,
Tungsten lamp, Globar source and Nichrome wire
are used.
14
• 1. NERNST GLOWER: It consists of a cylinder
made up of rare earth oxides. At the end of
cylinder platinum wires are attached and a
current is passed through the cylinder. The
Nernst glower can reach temperatures of
2200K.
15
• 2. GLOBAR SOURCE: The globar source is a
silicon carbide rod which is electrically heated
to about 1500K. Water cooling of the electrical
contacts is needed to prevent arching. The
spectral output is comparable with the Nernst
glower.
16
• 3. INCANDESCENT WIRE SOURCE: The
incandescent wire source is a tightly wound
coil of nichrome wire. Electrically heated to
1100K. It produces a lower intensity of
radiation than the Nernst or Globar sources,
but has a longer working life.
17
• It is basically different components than a monochromator.
• It consists of : Two mirrors.
Infrared light source.
Infrared detectors.
Beam splitter.
18
Detector reports variation in energy versus time for all wavelentghs simultaneously.
sample absorbs all different wavelengths of its spectrum
The recombined beam passes throught the sample
The difference in the path lengths creates Constructive and destructive interence thus giving rise to a
interferogram.
When the two meet up agin at the beam splitter, they recombine.
one beam goes to stationary mirror then back to the beam splitter.The other goes to a moving mirror
Light passes through beam splitter, which splits light in two directions ar right angles
19
• A mathematical function called a Fourier transform allows
to convert Intensity Vs time spectrum into Intensity Vs
Frequency spectrum.
• If the distance between two mirrors and the beam splitter
are the same, the situation is defines as zero path
difference ( ZPD) .
• the distance at which movable mirror is away from the ZPD
is defined as the mirror displacement and is represented by
Δ.
• The extra distance travelled by the light which strikes the
movable mirror is 2Δ. The extra distance is defined as the
optical path difference (OPD) and is represented by delta.
Therefore,
𝛿 = 2 Δ
• When OPD is the multiples of the wavelength , Constructive
interference occurs and a maximum intensity signal is
observed.
𝛿 = nλ
20
• When OPD is the half wavelength , destructive
interference occurs and minimum intensity
signal is observed.
𝛿 = (n+ 1/2) λ
21
• The sample compartment in FTIR is designed in such a
way to receive the infra red radiation through the
sample in a systematic manner.
• The sample compartment contains cell holders that
hold square cells with optical path lengths of 10mm.
• Sample compartments are made up of alkali
substances as glass may interfere in the absorption.
• The alkali includes NaCl or KBr these compartments do
not show any interference and thereby are transparent
to infrared radiations.
• There may be sometimes problem of fogging of the
compartment. This fogging can be removed by wiping
with buffer solutions.
• Cell containers are hygroscopic and hence must be
protected from atmosphere and light.
22
• Detectors are used to measure the intensity of
unabsorbed infrared radiation.
1. Thermocouples Detectors:Thermocouple
consists of a pair of junction of different
metals, for eg. Two pieces of bismuth fused
together to either end of a piece of antimony.
The potential difference (voltage) between
the junctions changes according to the
difference in temperature between the
junction.
23
2.Pyroelectric Detectors:
• These are made from a single crystalline wafer of a
pyroelectric material, such as triglycerine sulphate.
• The properties of a pyroelectric material are such that
when an electric field is applied across it, electric
polarization occurs ( usually happens in any dielectric
material). In a pyroelectric material, when the field is
removed, the polarization persists.
• The degree of polarization is temperature dependant.
• So, by sandwiching the pyroelectric matetial between
two electrodes, a temperature dependant capacitor is
made.
• The heating effect of incident IR radiation causes a
change in the capacitance of the material. These
detectors have fast response time.
24
25
3. Photoelectric Detectors:
• Photoelectric detectors such as the mercury
cadmium telluride detector comprise a film of
semiconducting material deposited on a glass
surface, sealed in an evacuated envelope.
• Absorption of IR promotes non-conducting
valence electrons to a higher conducting state.
• The electrical resistance of the semiconductor
decreases.
• These detectors have better response
characteristics than pyroelectric detectors are
used in FT-IR instruments particularly in GC-
FT-IR
26
27
• Other detectors include:
1. Golay detector: these are thermal detectors widely used. It
contains a small metal cylinder filled with xenon and one end
of the cylinder is closed by blackened film. As the gas
expands pressure increases and electrical signals are
produced.
28
• 2. bolometer:
Made from semiconductor that exhibits large
changes in electrical conductance as a
function of temperature.
29
• 3. Thermister:
Resistor made by fusing together several
metal oxides. Made from semiconductor that
exhibits large changes in electrical
conductance as a function of temperature.
Has negative thermal coefficient .
30
• The readout device is the computing system.
Now a days a sophisticated software is
involved for the readout.
• It provides the IR spectrum in a convenient
way.
• Various operations such as scan speed scan
cycle, peaks deletion and magnifications can
be done easily as the system is user friendly.
31
• Lampman.G, Pavia.D, Kriz.G, Vyvyan.J,
Spectroscopy , Cengage Learning,4th
Edition(15-104).
• Skoog.D ,Introduction to analytical
chemistry,3rd edition,(77-98)
• Chatwal.G, Instrumental method of chemical
analysis,Himalaya Publication,2nd
edition(2.456-2.493)
• www.Alan’sLab.com
32
33

FOURIER TRANSFORM - INFRARED SPECTROSCOPY

  • 1.
    Made By- SALMANLATIF. ROLL NO:527. M.PHARMACY-QAT (FIRST SEMISTER). DR.D.Y.PATIL COLLEGE OF PHARMACY. Guided By- Dr. Mrs. SONALI MAHAPARALE MAM HEAD OF CHEMISTRY DEPT , DR.D.Y.PATIL COLLEGE OF PHARMACY. AKURDI-44. 1
  • 2.
    • Infrared (IR)spectroscopy is one of the most important analytical techniques among the spectroscopic techniques. • The main use of this technique is in organic and inorganic chemistry to determine FUNCTIONAL GROUPS in molecules. • It is known for its great advantages that almost any sample in any state may be studied. • Liquids, solutions, pastes, powders, films, fibers, gases and surfaces can all be examined with a judicious choice of sampling technique. • IR spectroscopy is a technique based on the VIBRATIONS of the atoms of a molecule. • IR Spectroscopy measures the vibrations of atoms, through which it is possible to determine the functional groups. 2
  • 3.
    • An infraredspectrum is commonly obtained by passing infrared radiation through a sample and determining the fraction of the radiation which is absorbed at a particular energy. 3
  • 4.
    NEAR IR REGION MIDDLEIR REGION FAR IR REGION Region Wavelength range(µm) Wave number range() Near 0.78-2.5 12800-4000 Middle 2.5-50 4000-200 Far 50-1000 200-10 4
  • 5.
    A typical infraredspectrum can be visually divided into two regions. • The left half, above 1500 called as Functional group region. Functional group region : • The right half of the spectrum, from 1500-500 called as Fingerprint region. Fingerprint region: 5
  • 6.
    •The infrared spectrumis formed as a consequence of the absorption of electromagnetic radiation at frequencies that correlate to the vibration of specific sets of chemical bonds from within a molecule. The total energy of a molecule at any given moment is defined as the sum of the contributing energy terms: •Among these energies, the vibrational energy component is a higher energy term and corresponds to the absorptionof energy by a molecule as the component atoms vibrate about the mean center of their chemical bonds. For a molecule to slow infrared absorptions it must posses a specific feature i.e. an electric dipole moment of the molecule must change during the vibration. This is the selection rule for infrared spectroscopy. 6
  • 7.
    • the fundamentalvibrational frequency of a molecule can be expressed by Hooke’s Law. Where; = Frequency c = Speed of light, k = Force constant, and µ= Reduced mass. The reduced mass, Where; and are the component masses for the chemical bond under consideration. 7
  • 8.
    • For astronger bond (larger k value), u increases :As example of this, in order of increasing bond strength compare: • CC bonds : C̅̆-C (1000 , C=C(1600 cm−1 ) and CC (2200cm−1),CH bonds: C-C-H (2900cm−1), C=C-H (3100cm−1) and CC-H (3300cm−1). • For heavier atoms attached (larger m value), µ decreases : • As example of this, in order of increasing reduced mass compare : • C-H (3000 cm−1) • C-C (1000cm−1) • C-Cl (800cm−1) • C-Br (550 cm−1) • C-I (about 500cm−1) 8
  • 9.
    • Thus Hooke’sLaw states : • The vibrational frequency is proportional to the strength of the spring; the stronger the spring, the higher the frequency. • The vibrational frequency is inversely proportional to the masses at ends of the spring; the lighter the weights, the higher the frequency. • As per the Hooke’s Law: • Stronger bonds absorb at higher frequencies. • Weaker bonds absorb at lower frequencies • Bonds between lighter atoms absorb at higher frequencies. • Bonds between heavier atoms absorb at lower frequencies. 9
  • 10.
    •Fourier Transform Infrared(FT-IR) spectrometry was developed in order to overcome the limitations encountered with dispersive instruments. •The main difficulty was the slow scanning process. •As it was necessary for a method for measuring all of the infrared frequencies simultaneously, rather than individually, a very simple optical device called an interferometer was developed. •Thus, the time element per sample is reduced to a matter of a few seconds rather than several minutes. 10
  • 11.
    • The signal-to-noiseratio of spectrum is significantly higher than to previous generation infrared spectrometers. • The accuracy of wave number is high. The error is within the range of = 0.01. • The scan time of all frequencies is short (approximately 1s). • The resolution is extremely high(0.1-0.005). • The scan range is wide (1000-10 cm−1 ). • The interference from stray light is reduced. Due the these advantages, FTIR Spectrometers have replaced dispersive IR spectrometers. 11
  • 12.
    • The commonFTIR spectrometer consists of the following components. The major difference between dispersive IR and FTIR is the inclusion of interferometer. All other components are almost same as like that of a dispersive IR spectrometer. • An interferometer requires an IR light source, mirrors, beam splitter and detector. However the components are explained individually as follows: Source of light Interferometer Sample compartment Detector Read out device. 12
  • 13.
  • 14.
    • Infrared energyis emitted from a glowing black – body source. • This beam passes through an aperture which controls the amount of energy presented to the sample. • The source is similar to the IR instruments. IR instruments require a source of radiant energy which emits IR radiation which must be steady, intense enough for detection and extend over the desired wavelength. • Various sources of IR radiations including Nernst glower, Incandesecent lamp, Mercury arc, Tungsten lamp, Globar source and Nichrome wire are used. 14
  • 15.
    • 1. NERNSTGLOWER: It consists of a cylinder made up of rare earth oxides. At the end of cylinder platinum wires are attached and a current is passed through the cylinder. The Nernst glower can reach temperatures of 2200K. 15
  • 16.
    • 2. GLOBARSOURCE: The globar source is a silicon carbide rod which is electrically heated to about 1500K. Water cooling of the electrical contacts is needed to prevent arching. The spectral output is comparable with the Nernst glower. 16
  • 17.
    • 3. INCANDESCENTWIRE SOURCE: The incandescent wire source is a tightly wound coil of nichrome wire. Electrically heated to 1100K. It produces a lower intensity of radiation than the Nernst or Globar sources, but has a longer working life. 17
  • 18.
    • It isbasically different components than a monochromator. • It consists of : Two mirrors. Infrared light source. Infrared detectors. Beam splitter. 18
  • 19.
    Detector reports variationin energy versus time for all wavelentghs simultaneously. sample absorbs all different wavelengths of its spectrum The recombined beam passes throught the sample The difference in the path lengths creates Constructive and destructive interence thus giving rise to a interferogram. When the two meet up agin at the beam splitter, they recombine. one beam goes to stationary mirror then back to the beam splitter.The other goes to a moving mirror Light passes through beam splitter, which splits light in two directions ar right angles 19
  • 20.
    • A mathematicalfunction called a Fourier transform allows to convert Intensity Vs time spectrum into Intensity Vs Frequency spectrum. • If the distance between two mirrors and the beam splitter are the same, the situation is defines as zero path difference ( ZPD) . • the distance at which movable mirror is away from the ZPD is defined as the mirror displacement and is represented by Δ. • The extra distance travelled by the light which strikes the movable mirror is 2Δ. The extra distance is defined as the optical path difference (OPD) and is represented by delta. Therefore, 𝛿 = 2 Δ • When OPD is the multiples of the wavelength , Constructive interference occurs and a maximum intensity signal is observed. 𝛿 = nλ 20
  • 21.
    • When OPDis the half wavelength , destructive interference occurs and minimum intensity signal is observed. 𝛿 = (n+ 1/2) λ 21
  • 22.
    • The samplecompartment in FTIR is designed in such a way to receive the infra red radiation through the sample in a systematic manner. • The sample compartment contains cell holders that hold square cells with optical path lengths of 10mm. • Sample compartments are made up of alkali substances as glass may interfere in the absorption. • The alkali includes NaCl or KBr these compartments do not show any interference and thereby are transparent to infrared radiations. • There may be sometimes problem of fogging of the compartment. This fogging can be removed by wiping with buffer solutions. • Cell containers are hygroscopic and hence must be protected from atmosphere and light. 22
  • 23.
    • Detectors areused to measure the intensity of unabsorbed infrared radiation. 1. Thermocouples Detectors:Thermocouple consists of a pair of junction of different metals, for eg. Two pieces of bismuth fused together to either end of a piece of antimony. The potential difference (voltage) between the junctions changes according to the difference in temperature between the junction. 23
  • 24.
    2.Pyroelectric Detectors: • Theseare made from a single crystalline wafer of a pyroelectric material, such as triglycerine sulphate. • The properties of a pyroelectric material are such that when an electric field is applied across it, electric polarization occurs ( usually happens in any dielectric material). In a pyroelectric material, when the field is removed, the polarization persists. • The degree of polarization is temperature dependant. • So, by sandwiching the pyroelectric matetial between two electrodes, a temperature dependant capacitor is made. • The heating effect of incident IR radiation causes a change in the capacitance of the material. These detectors have fast response time. 24
  • 25.
  • 26.
    3. Photoelectric Detectors: •Photoelectric detectors such as the mercury cadmium telluride detector comprise a film of semiconducting material deposited on a glass surface, sealed in an evacuated envelope. • Absorption of IR promotes non-conducting valence electrons to a higher conducting state. • The electrical resistance of the semiconductor decreases. • These detectors have better response characteristics than pyroelectric detectors are used in FT-IR instruments particularly in GC- FT-IR 26
  • 27.
  • 28.
    • Other detectorsinclude: 1. Golay detector: these are thermal detectors widely used. It contains a small metal cylinder filled with xenon and one end of the cylinder is closed by blackened film. As the gas expands pressure increases and electrical signals are produced. 28
  • 29.
    • 2. bolometer: Madefrom semiconductor that exhibits large changes in electrical conductance as a function of temperature. 29
  • 30.
    • 3. Thermister: Resistormade by fusing together several metal oxides. Made from semiconductor that exhibits large changes in electrical conductance as a function of temperature. Has negative thermal coefficient . 30
  • 31.
    • The readoutdevice is the computing system. Now a days a sophisticated software is involved for the readout. • It provides the IR spectrum in a convenient way. • Various operations such as scan speed scan cycle, peaks deletion and magnifications can be done easily as the system is user friendly. 31
  • 32.
    • Lampman.G, Pavia.D,Kriz.G, Vyvyan.J, Spectroscopy , Cengage Learning,4th Edition(15-104). • Skoog.D ,Introduction to analytical chemistry,3rd edition,(77-98) • Chatwal.G, Instrumental method of chemical analysis,Himalaya Publication,2nd edition(2.456-2.493) • www.Alan’sLab.com 32
  • 33.