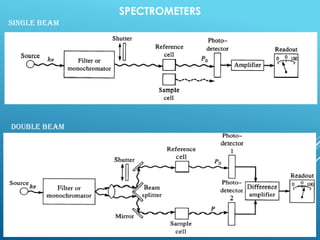
SPECTROPHOTOMETER
DR. SMITHA K. R.
ASSISTANT PROFESSOR,
DEPARTMENT OF BIOCHEMISTRY,
SREE KRISHNA COLLEGE, GURUVAYUR
SPECTROPHOTOMETER
Types: UV and visible Spectrophotometer
THE SPECTROPHOTOMETER:
 Is a sophisticated type of colorimeter where
monochromatic light is provided by prism.
 The band width of the light passed by a filter is quite
board, so that it may be difficult to distinguish
between two components of closely related
absorption with a colorimeter.
 A spectrophotometer is then needed.
Principle Ultraviolet-visible (UV/Visible) spectroscopy
➱ It is is based on the principle of absorbance and works in the
visible and UV region of the electromagnetic spectrum
➱ This region of the electromagnetic spectrum when absorbed by
the molecule it affects the electronic transition of the molecule
➱ Transition occurs from ground state to the excited state
➱ The law which governs light absorption is referred as Lambert-
Beer Law.
TYPES
Visible Spectrophotometer
UV Spectrophotometer
INSTRUMENTATION OF UV-VISIBLE
SPECTROPHOTOMETERSCOPY
‱ Spectrophotometer covers the range of
wavelengths in the both UV and Visible
region
‱ Materials used in the spectrophotometer
depends upon the wavelength used.
INSTRUMENTATION
Light source
â–ȘDeuterium and hydrogen lamps
â–ȘW filament lamp
â–ȘXe arc lamps
Sample containers
â–ȘCuvettes
â–ȘPlastic
â–ȘGlass
â–ȘQuartz
INSTRUMENTATION
✓ Light Source:
‱ Tungsten filament lamps are used in the visible
region
‱ hydrogen and deuterium lamps are used in the UV
range
‱ In UV-Visible spectrophotometer both the lamps
are switched on while working, and it depends on
the user which lamp to be used.
‱ For this, a mechanical switch is available for
directing the light.
Monochromator:
‱ Monochromatic light refers to the light of single color or single
wavelength or narrow band of wavelengths
‱ Wavelength is selected by the monochromator (prisms and
gratings)
‱ Monochromator is an optical instrument which selects the light
of single or narrow range wavelengths (bandwidth) from wide
range of wavelengths emitted from light source
‱ Prism separates the beam of light into its components by the
phenomenon of refraction or dispersion whereas gratings do this
by the phenomenon of diffraction.
Monochromator:
‱ The resolution is higher from gratings than from prisms
‱ Prisms have higher dispersion in UV range
‱ Therefore are best suited to work in UV region
‱ Monochromators are also equipped with collimators
which converts the diverging light to the collimated
light (parallel rays of light)
Slits:
➱ Optical slit width affects the bandwidth
➱ Light from a source is emitted in all directions
➱ Slit allows only a portion of the light to reach the
monochromator
➱ Selected light is again allowed to pass through the
slit
➱ The reproducibility of the absorbance values
increases as the slit width decreases
➱ With the decrease in slit width, sensitivity also
decreases as less radiation passes to the detector
Cuvettes:
‱ Samples for the detection should be placed in a
transparent cuvette, mostly rectangular in shape and
commonly have internal width, 1 cm
‱ Small test tubes are also used in some instruments
‱ Cuvettes are made of silica for the detection in the
visible range
‱ Borosilicate glass is used in visible region as well as in
near UV region
‱ Fused silica and quartz cuvette are required for the
UV range but also covers the visible region
Chromophores:
‱ is the part/moiety of molecule which is responsible for imparting
absorbance
‱ This phenomenon occurs when a molecule absorbs certain
wavelength in the visible range and promoted to the excited
state
‱ Biological molecules also cause conformation change when
exposed to light
‱ Examples include molecules or compounds that have unpaired
electrons or unsaturated bonds and can absorb the radiation
such as alkenes, ketones, aldehydes, phenyl and other aromatic
species
‱ Organic compounds absorbs in the UV or visible region
‱ For the determination of organic compounds in the UV range,
organic solvents are not suitable as these solvents absorbs in the
UV region
‱ Therefore, ethanol is best suited as a solvent for organic soluble
compounds and water for water soluble compounds
4.Detection Devices
‱ depend on the photoelectric effect.
‱ current is then proportional to the light intensity
‱ High sensitivity
‱ Short response time
‱ Long-term stability
‱ An electric signal which easily amplified for a typical
readout apparatus.
phototubephotomultiplier
Amplification And Readout
‱ electronic signals from detector amplified using
amplifiers, ammeters, potentiometers and
potentiometric recorders
‱ The galvanometer measures the electrical signals
and displays it in the digital form
SPECTROMETER
Multichannel photodiode array
Single-beam and double beam spectrophotometer
➱ A spectrophotometer may be single beam or double beam
➱ In single-beam spectrophotometer, beam of light passes through the
cuvette present in the sample cell
➱ Therefore, sample cell is first used to zero the instrument by using blank
or reference solution in the cuvette and later by placing the sample
cuvette in the same place and the absorbance is recorded
➱ This is to minus the blank absorbance readings from the sample
absorbance readings
➱ In double-beam spectrophotometer, incident light is split into two
beams by half mirror, one beam passes through the reference cuvette
and the other beam passes through the sample cuvette
➱ The transmitted light from both the cuvettes then reaches the
detectors.
SPECTROMETERS
SINGLE BEAM
Double Beam
Working
‱ Calibration using the standard solutions of the known
concentration of the solute that has to be determined in
the test solution.
‱ For this, the standard solutions are filled in the Cuvettes
and placed in the Cuvette holder in the
spectrophotometer that is similar to the colorimeter.
‱ Ray of light with specific wavelength is directed towards
the solution
‱ Ray of light passes through a series of the diffraction
grating, prism, and mirrors


 then to the solution
‱ These mirrors are used for navigation of the light in the
spectrophotometer
Working
‱ The prism splits the beam of light into different wavelength
and the diffraction grating allows the required wavelength to
pass through it and reaches the cuvette containing the
standard or test solutions
‱ It analyzes the reflected light and compares with a
predetermined standard solution
‱ When the monochromatic light reaches the Cuvette some
of the light is reflected, some part of the light is absorbed by
the solution and the remaining part is transmitted through
the solution which falls on the photodetector system.
‱ The photodetector system measures the intensity of
transmitted light and converts it into the electrical signals
that are sent to the galvanometer.
‱ The galvanometer measures the electrical signals and
displays it in the digital form
‱ That digital representation of the electrical signals is the
absorbance or optical density of the solution analyzed.
‱ By plotting standard graph or calculating using the formula
we can easily determine the concentration of the solution.
Applications
1. Identification/ Qualitative analysis of
compounds:
✓to identify classes of compounds in both the
pure state and in biological preparations
✓ This is done by plotting absorption spectrum
curves
✓proteins, nucleic acids, cytochromes and
chlorophylls.
2. Quantitative Analysis:
✓for determining an unknown concentration
✓Nucleic acids at 260 nm
✓protein at 280 nm
2. Difference spectra
3. Binding spectra
✓ used to study the extent of interaction
between an enzyme and its substrate
✓ The binding of a substrate to a haem group
containing a ferric ion in the high spin state
perturbs the spectrum by displacing the ligand
water from the sixth position of the ferric ion,
causing it to change to the low spin state The
process may be followed
spectrophotometrically.
✓ An example of this is the binding of a drug
(substrate) to liver microsomal
monooxygenase (mixed function oxidase),
which causes a blue shift of the cytochrome
P450 component of the enzyme from 420 nm
to 390 nm
4. Action spectra
In certain situations an action spectrum may be
shown as a plot of a physiological (non-
extinction) parameter against wavelength.
In many complex biological systems such a
spectrum often corresponds to the absorption
spectrum of a single key compound.
An example is the plotting of the rate of oxygen
evolution by green plant tissue against the
wavelength of light used to irradiate the system.
This results in a graph similar to the spectrum of
the chlorophylls.
Reference
1. Principles and Techniques of Biochemistry and Molecular
Biology edited by Keith Wilson and John Walker; sixth edition:
Cambridge University Press (2005)
2. https://epgp.inflibnet.ac.in/Home/ViewSubject?catid=2
Spectrophotometer instrumentation

Spectrophotometer instrumentation

  • 1.
    SPECTROPHOTOMETER DR. SMITHA K.R. ASSISTANT PROFESSOR, DEPARTMENT OF BIOCHEMISTRY, SREE KRISHNA COLLEGE, GURUVAYUR
  • 2.
    SPECTROPHOTOMETER Types: UV andvisible Spectrophotometer
  • 3.
    THE SPECTROPHOTOMETER:  Isa sophisticated type of colorimeter where monochromatic light is provided by prism.  The band width of the light passed by a filter is quite board, so that it may be difficult to distinguish between two components of closely related absorption with a colorimeter.  A spectrophotometer is then needed.
  • 4.
    Principle Ultraviolet-visible (UV/Visible)spectroscopy ➱ It is is based on the principle of absorbance and works in the visible and UV region of the electromagnetic spectrum ➱ This region of the electromagnetic spectrum when absorbed by the molecule it affects the electronic transition of the molecule ➱ Transition occurs from ground state to the excited state ➱ The law which governs light absorption is referred as Lambert- Beer Law.
  • 5.
  • 6.
    INSTRUMENTATION OF UV-VISIBLE SPECTROPHOTOMETERSCOPY ‱Spectrophotometer covers the range of wavelengths in the both UV and Visible region ‱ Materials used in the spectrophotometer depends upon the wavelength used.
  • 7.
    INSTRUMENTATION Light source â–ȘDeuterium andhydrogen lamps â–ȘW filament lamp â–ȘXe arc lamps Sample containers â–ȘCuvettes â–ȘPlastic â–ȘGlass â–ȘQuartz
  • 8.
    INSTRUMENTATION ✓ Light Source: ‱Tungsten filament lamps are used in the visible region ‱ hydrogen and deuterium lamps are used in the UV range ‱ In UV-Visible spectrophotometer both the lamps are switched on while working, and it depends on the user which lamp to be used. ‱ For this, a mechanical switch is available for directing the light.
  • 9.
    Monochromator: ‱ Monochromatic lightrefers to the light of single color or single wavelength or narrow band of wavelengths ‱ Wavelength is selected by the monochromator (prisms and gratings) ‱ Monochromator is an optical instrument which selects the light of single or narrow range wavelengths (bandwidth) from wide range of wavelengths emitted from light source ‱ Prism separates the beam of light into its components by the phenomenon of refraction or dispersion whereas gratings do this by the phenomenon of diffraction.
  • 10.
    Monochromator: ‱ The resolutionis higher from gratings than from prisms ‱ Prisms have higher dispersion in UV range ‱ Therefore are best suited to work in UV region ‱ Monochromators are also equipped with collimators which converts the diverging light to the collimated light (parallel rays of light)
  • 11.
    Slits: ➱ Optical slitwidth affects the bandwidth ➱ Light from a source is emitted in all directions ➱ Slit allows only a portion of the light to reach the monochromator ➱ Selected light is again allowed to pass through the slit ➱ The reproducibility of the absorbance values increases as the slit width decreases ➱ With the decrease in slit width, sensitivity also decreases as less radiation passes to the detector
  • 12.
    Cuvettes: ‱ Samples forthe detection should be placed in a transparent cuvette, mostly rectangular in shape and commonly have internal width, 1 cm ‱ Small test tubes are also used in some instruments ‱ Cuvettes are made of silica for the detection in the visible range ‱ Borosilicate glass is used in visible region as well as in near UV region ‱ Fused silica and quartz cuvette are required for the UV range but also covers the visible region
  • 13.
    Chromophores: ‱ is thepart/moiety of molecule which is responsible for imparting absorbance ‱ This phenomenon occurs when a molecule absorbs certain wavelength in the visible range and promoted to the excited state ‱ Biological molecules also cause conformation change when exposed to light
  • 14.
    ‱ Examples includemolecules or compounds that have unpaired electrons or unsaturated bonds and can absorb the radiation such as alkenes, ketones, aldehydes, phenyl and other aromatic species ‱ Organic compounds absorbs in the UV or visible region ‱ For the determination of organic compounds in the UV range, organic solvents are not suitable as these solvents absorbs in the UV region ‱ Therefore, ethanol is best suited as a solvent for organic soluble compounds and water for water soluble compounds
  • 15.
    4.Detection Devices ‱ dependon the photoelectric effect. ‱ current is then proportional to the light intensity ‱ High sensitivity ‱ Short response time ‱ Long-term stability ‱ An electric signal which easily amplified for a typical readout apparatus. phototubephotomultiplier
  • 16.
    Amplification And Readout ‱electronic signals from detector amplified using amplifiers, ammeters, potentiometers and potentiometric recorders ‱ The galvanometer measures the electrical signals and displays it in the digital form
  • 18.
  • 19.
    Single-beam and doublebeam spectrophotometer ➱ A spectrophotometer may be single beam or double beam ➱ In single-beam spectrophotometer, beam of light passes through the cuvette present in the sample cell ➱ Therefore, sample cell is first used to zero the instrument by using blank or reference solution in the cuvette and later by placing the sample cuvette in the same place and the absorbance is recorded ➱ This is to minus the blank absorbance readings from the sample absorbance readings ➱ In double-beam spectrophotometer, incident light is split into two beams by half mirror, one beam passes through the reference cuvette and the other beam passes through the sample cuvette ➱ The transmitted light from both the cuvettes then reaches the detectors.
  • 20.
  • 21.
    Working ‱ Calibration usingthe standard solutions of the known concentration of the solute that has to be determined in the test solution. ‱ For this, the standard solutions are filled in the Cuvettes and placed in the Cuvette holder in the spectrophotometer that is similar to the colorimeter. ‱ Ray of light with specific wavelength is directed towards the solution ‱ Ray of light passes through a series of the diffraction grating, prism, and mirrors


 then to the solution ‱ These mirrors are used for navigation of the light in the spectrophotometer
  • 22.
    Working ‱ The prismsplits the beam of light into different wavelength and the diffraction grating allows the required wavelength to pass through it and reaches the cuvette containing the standard or test solutions ‱ It analyzes the reflected light and compares with a predetermined standard solution
  • 23.
    ‱ When themonochromatic light reaches the Cuvette some of the light is reflected, some part of the light is absorbed by the solution and the remaining part is transmitted through the solution which falls on the photodetector system. ‱ The photodetector system measures the intensity of transmitted light and converts it into the electrical signals that are sent to the galvanometer. ‱ The galvanometer measures the electrical signals and displays it in the digital form ‱ That digital representation of the electrical signals is the absorbance or optical density of the solution analyzed. ‱ By plotting standard graph or calculating using the formula we can easily determine the concentration of the solution.
  • 24.
  • 25.
    1. Identification/ Qualitativeanalysis of compounds: ✓to identify classes of compounds in both the pure state and in biological preparations ✓ This is done by plotting absorption spectrum curves ✓proteins, nucleic acids, cytochromes and chlorophylls. 2. Quantitative Analysis: ✓for determining an unknown concentration ✓Nucleic acids at 260 nm ✓protein at 280 nm
  • 26.
    2. Difference spectra 3.Binding spectra ✓ used to study the extent of interaction between an enzyme and its substrate ✓ The binding of a substrate to a haem group containing a ferric ion in the high spin state perturbs the spectrum by displacing the ligand water from the sixth position of the ferric ion, causing it to change to the low spin state The process may be followed spectrophotometrically.
  • 27.
    ✓ An exampleof this is the binding of a drug (substrate) to liver microsomal monooxygenase (mixed function oxidase), which causes a blue shift of the cytochrome P450 component of the enzyme from 420 nm to 390 nm
  • 28.
    4. Action spectra Incertain situations an action spectrum may be shown as a plot of a physiological (non- extinction) parameter against wavelength. In many complex biological systems such a spectrum often corresponds to the absorption spectrum of a single key compound. An example is the plotting of the rate of oxygen evolution by green plant tissue against the wavelength of light used to irradiate the system. This results in a graph similar to the spectrum of the chlorophylls.
  • 29.
    Reference 1. Principles andTechniques of Biochemistry and Molecular Biology edited by Keith Wilson and John Walker; sixth edition: Cambridge University Press (2005) 2. https://epgp.inflibnet.ac.in/Home/ViewSubject?catid=2