Spectrophotometry
A method inwhich the absorption or
transmission properties of a material is
quantitatively measured as a function of
wavelength.
The basic principle behind this method is that :
“Each compound absorbs or transmits light
over a certain range of wavelength”
4.
Spectrophotometer
An instrument whichmeasures light absorption as
a function of wavelength in the UV as well as
visible regions. It also follows essentially the laws
of light absorption viz the beer-lambert’s law.
Unlike colorimeters in spectrophotometers the
compound can be measured at precise
wavelength. The light absorbed by the sample is
directly proportional to the concentration of
sample in the solution. As concentration increases
, absorption increases exponentially.
5.
Basic concepts andPrinciple
Principle behind this method is that : “Each
compound absorbs or transmits light over a
certain range of wavelength. When light passes
through a solution, a certain fraction is being
absorbed.
This fraction is detected, measured and used to
relate the light absorbed or transmitted to the
concentration of the substance.
This enables both qualitative and quantitative
analyses of substances.
6.
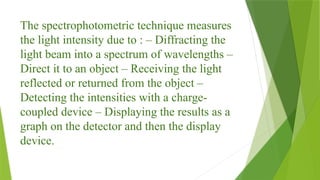
The spectrophotometric techniquemeasures
the light intensity due to : – Diffracting the
light beam into a spectrum of wavelengths –
Direct it to an object – Receiving the light
reflected or returned from the object –
Detecting the intensities with a charge-
coupled device – Displaying the results as a
graph on the detector and then the display
device.
7.
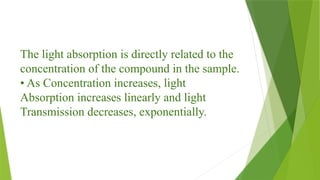
The light absorptionis directly related to the
concentration of the compound in the sample.
• As Concentration increases, light
Absorption increases linearly and light
Transmission decreases, exponentially.
8.
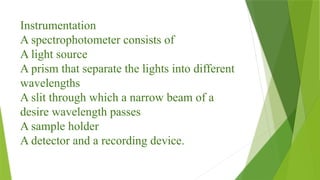
Instrumentation
A spectrophotometer consistsof
A light source
A prism that separate the lights into different
wavelengths
A slit through which a narrow beam of a
desire wavelength passes
A sample holder
A detector and a recording device.
9.
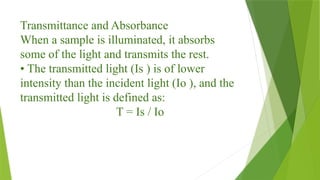
Transmittance and Absorbance
Whena sample is illuminated, it absorbs
some of the light and transmits the rest.
• The transmitted light (Is ) is of lower
intensity than the incident light (Io ), and the
transmitted light is defined as:
T = Is / Io
10.
To ensure accuracy(by eliminating effects of reflection
by surface of the cell, absorption by the cell wall and
by solvent) an identical reference cell without the
compound of interest is also used.
• Thus, the amount of light absorbed (A) as the
incident light passes through the sample is equivalent
to: A = - log Is / IR = - log T
• In practice, the Reference cell is inserted, and the
instrument adjusted to an arbitrary scale corresponding
to 100% transmittance, after which the percentage
transmittance reading is made on the sample.
Single Beam Spectrometer
Tomeasure the intensity of the incident light
the sample must be removed so that the
reference can be placed each time.
• This type of spectrometer is usually less
expensive and less complicated.
13.
Double Beam Spectrometer
Inthis type, before it reaches the sample, the
light source is split into two separate beams. •
From these one passes through the sample
and second one is used for reference. • This
gives an advantage because the reference
reading and sample reading can take place at
the same time.
14.
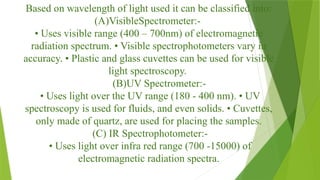
Based on wavelengthof light used it can be classified into:
(A)VisibleSpectrometer:-
• Uses visible range (400 – 700nm) of electromagnetic
radiation spectrum. • Visible spectrophotometers vary in
accuracy. • Plastic and glass cuvettes can be used for visible
light spectroscopy.
(B)UV Spectrometer:-
• Uses light over the UV range (180 - 400 nm). • UV
spectroscopy is used for fluids, and even solids. • Cuvettes,
only made of quartz, are used for placing the samples.
(C) IR Spectrophotometer:-
• Uses light over infra red range (700 -15000) of
electromagnetic radiation spectra.
15.
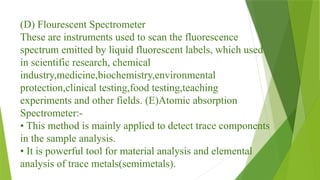
(D) Flourescent Spectrometer
Theseare instruments used to scan the fluorescence
spectrum emitted by liquid fluorescent labels, which used
in scientific research, chemical
industry,medicine,biochemistry,environmental
protection,clinical testing,food testing,teaching
experiments and other fields. (E)Atomic absorption
Spectrometer:-
• This method is mainly applied to detect trace components
in the sample analysis.
• It is powerful tool for material analysis and elemental
analysis of trace metals(semimetals).
16.
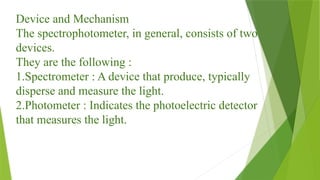
Device and Mechanism
Thespectrophotometer, in general, consists of two
devices.
They are the following :
1.Spectrometer : A device that produce, typically
disperse and measure the light.
2.Photometer : Indicates the photoelectric detector
that measures the light.
17.
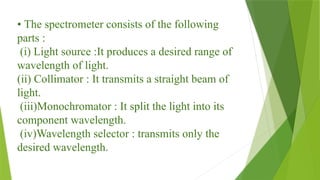
• The spectrometerconsists of the following
parts :
(i) Light source :It produces a desired range of
wavelength of light.
(ii) Collimator : It transmits a straight beam of
light.
(iii)Monochromator : It split the light into its
component wavelength.
(iv)Wavelength selector : transmits only the
desired wavelength.
18.
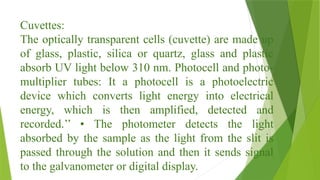
Cuvettes:
The optically transparentcells (cuvette) are made up
of glass, plastic, silica or quartz, glass and plastic
absorb UV light below 310 nm. Photocell and photo-
multiplier tubes: It a photocell is a photoelectric
device which converts light energy into electrical
energy, which is then amplified, detected and
recorded.’’ • The photometer detects the light
absorbed by the sample as the light from the slit is
passed through the solution and then it sends signal
to the galvanometer or digital display.
19.
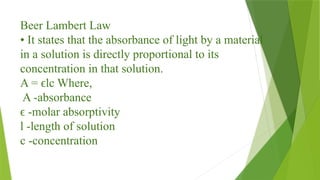
Beer Lambert Law
•It states that the absorbance of light by a material
in a solution is directly proportional to its
concentration in that solution.
A = lc Where,
ϵ
A -absorbance
-molar absorptivity
ϵ
l -length of solution
c -concentration
20.
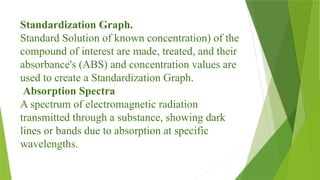
Standardization Graph.
Standard Solutionof known concentration) of the
compound of interest are made, treated, and their
absorbance's (ABS) and concentration values are
used to create a Standardization Graph.
Absorption Spectra
A spectrum of electromagnetic radiation
transmitted through a substance, showing dark
lines or bands due to absorption at specific
wavelengths.
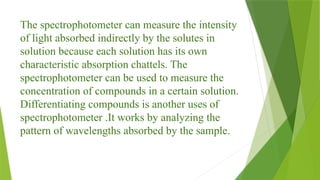
The spectrophotometer canmeasure the intensity
of light absorbed indirectly by the solutes in
solution because each solution has its own
characteristic absorption chattels. The
spectrophotometer can be used to measure the
concentration of compounds in a certain solution.
Differentiating compounds is another uses of
spectrophotometer .It works by analyzing the
pattern of wavelengths absorbed by the sample.
23.
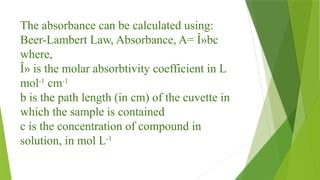
The absorbance canbe calculated using:
Beer-Lambert Law, Absorbance, A= λbc
where,
λ is the molar absorbtivity coefficient in L
mol-1
cm-1
b is the path length (in cm) of the cuvette in
which the sample is contained
c is the concentration of compound in
solution, in mol L
-1
24.
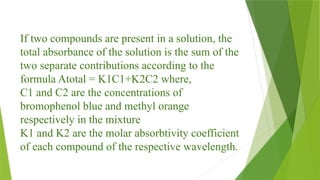
If two compoundsare present in a solution, the
total absorbance of the solution is the sum of the
two separate contributions according to the
formula Atotal = K1C1+K2C2 where,
C1 and C2 are the concentrations of
bromophenol blue and methyl orange
respectively in the mixture
K1 and K2 are the molar absorbtivity coefficient
of each compound of the respective wavelength.
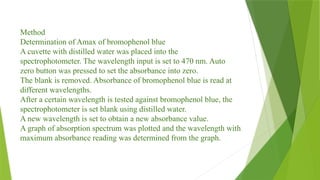
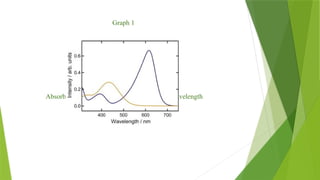
Method
Determination of Amaxof bromophenol blue
A cuvette with distilled water was placed into the
spectrophotometer. The wavelength input is set to 470 nm. Auto
zero button was pressed to set the absorbance into zero.
The blank is removed. Absorbance of bromophenol blue is read at
different wavelengths.
After a certain wavelength is tested against bromophenol blue, the
spectrophotometer is set blank using distilled water.
A new wavelength is set to obtain a new absorbance value.
A graph of absorption spectrum was plotted and the wavelength with
maximum absorbance reading was determined from the graph.
27.
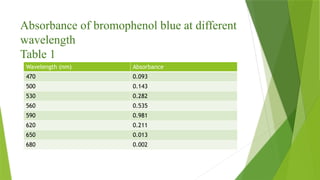
Absorbance of bromophenolblue at different
wavelength
Table 1
Wavelength (nm) Absorbance
470 0.093
500 0.143
530 0.282
560 0.535
590 0.981
620 0.211
650 0.013
680 0.002