Downloaded 12 times

![TARUN GEHLOT (B.E, CIVIL, HONOURS)
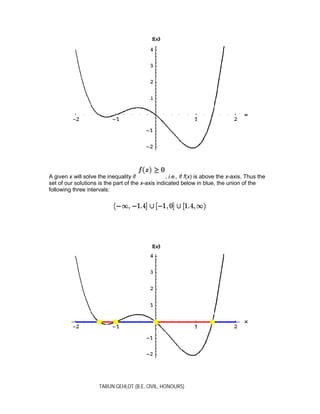
The (finite) endpoints are included since at these points f(x)=0 and so these x's are
included in our quest of finding the solutions of .
Our answer is approximate, the endpoints of the intervals were found by inspection; you
can usually obtain better estimates for the endpoints by using a numerical solver to find
the solutions of f(x)=0. In fact, as you will learn in the next section, the precise endpoints
of the intervals are , -1, 0 and .
Two more caveats: The method will only work, if your graphing window contains all x-
intercepts. Here is a rather simple-minded example to illustrate the point: Suppose you
want to solve the inequality
x2
-10x<0.
If your graphing window is set to the interval [-5,5], you will miss half of the action, and
probably come up with the incorrect answer:
To find the correct answer, the interval (0,10), your graphing window has to include the
second x-intercept at x=10:](https://image.slidesharecdn.com/solvingpolynomialinequalitiesbygraphing-130720203222-phpapp02/85/Solving-polynomial-inequalities-by-graphing-4-320.jpg)
![TARUN GEHLOT (B.E, CIVIL, HONOURS)
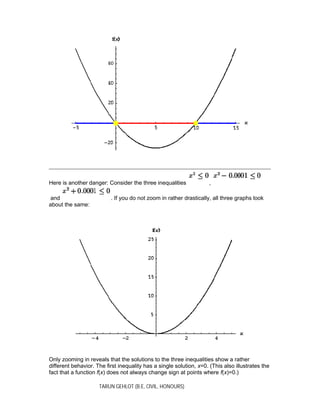
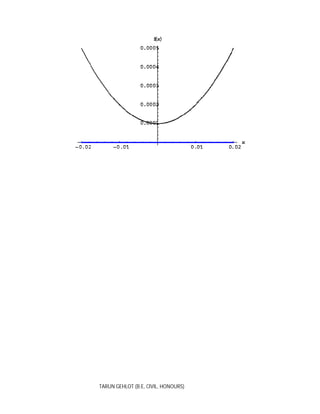
The second inequality, , has as its solutions the interval [-0.01,0.01]:
The third inequality, , has no solutions:](https://image.slidesharecdn.com/solvingpolynomialinequalitiesbygraphing-130720203222-phpapp02/85/Solving-polynomial-inequalities-by-graphing-6-320.jpg)

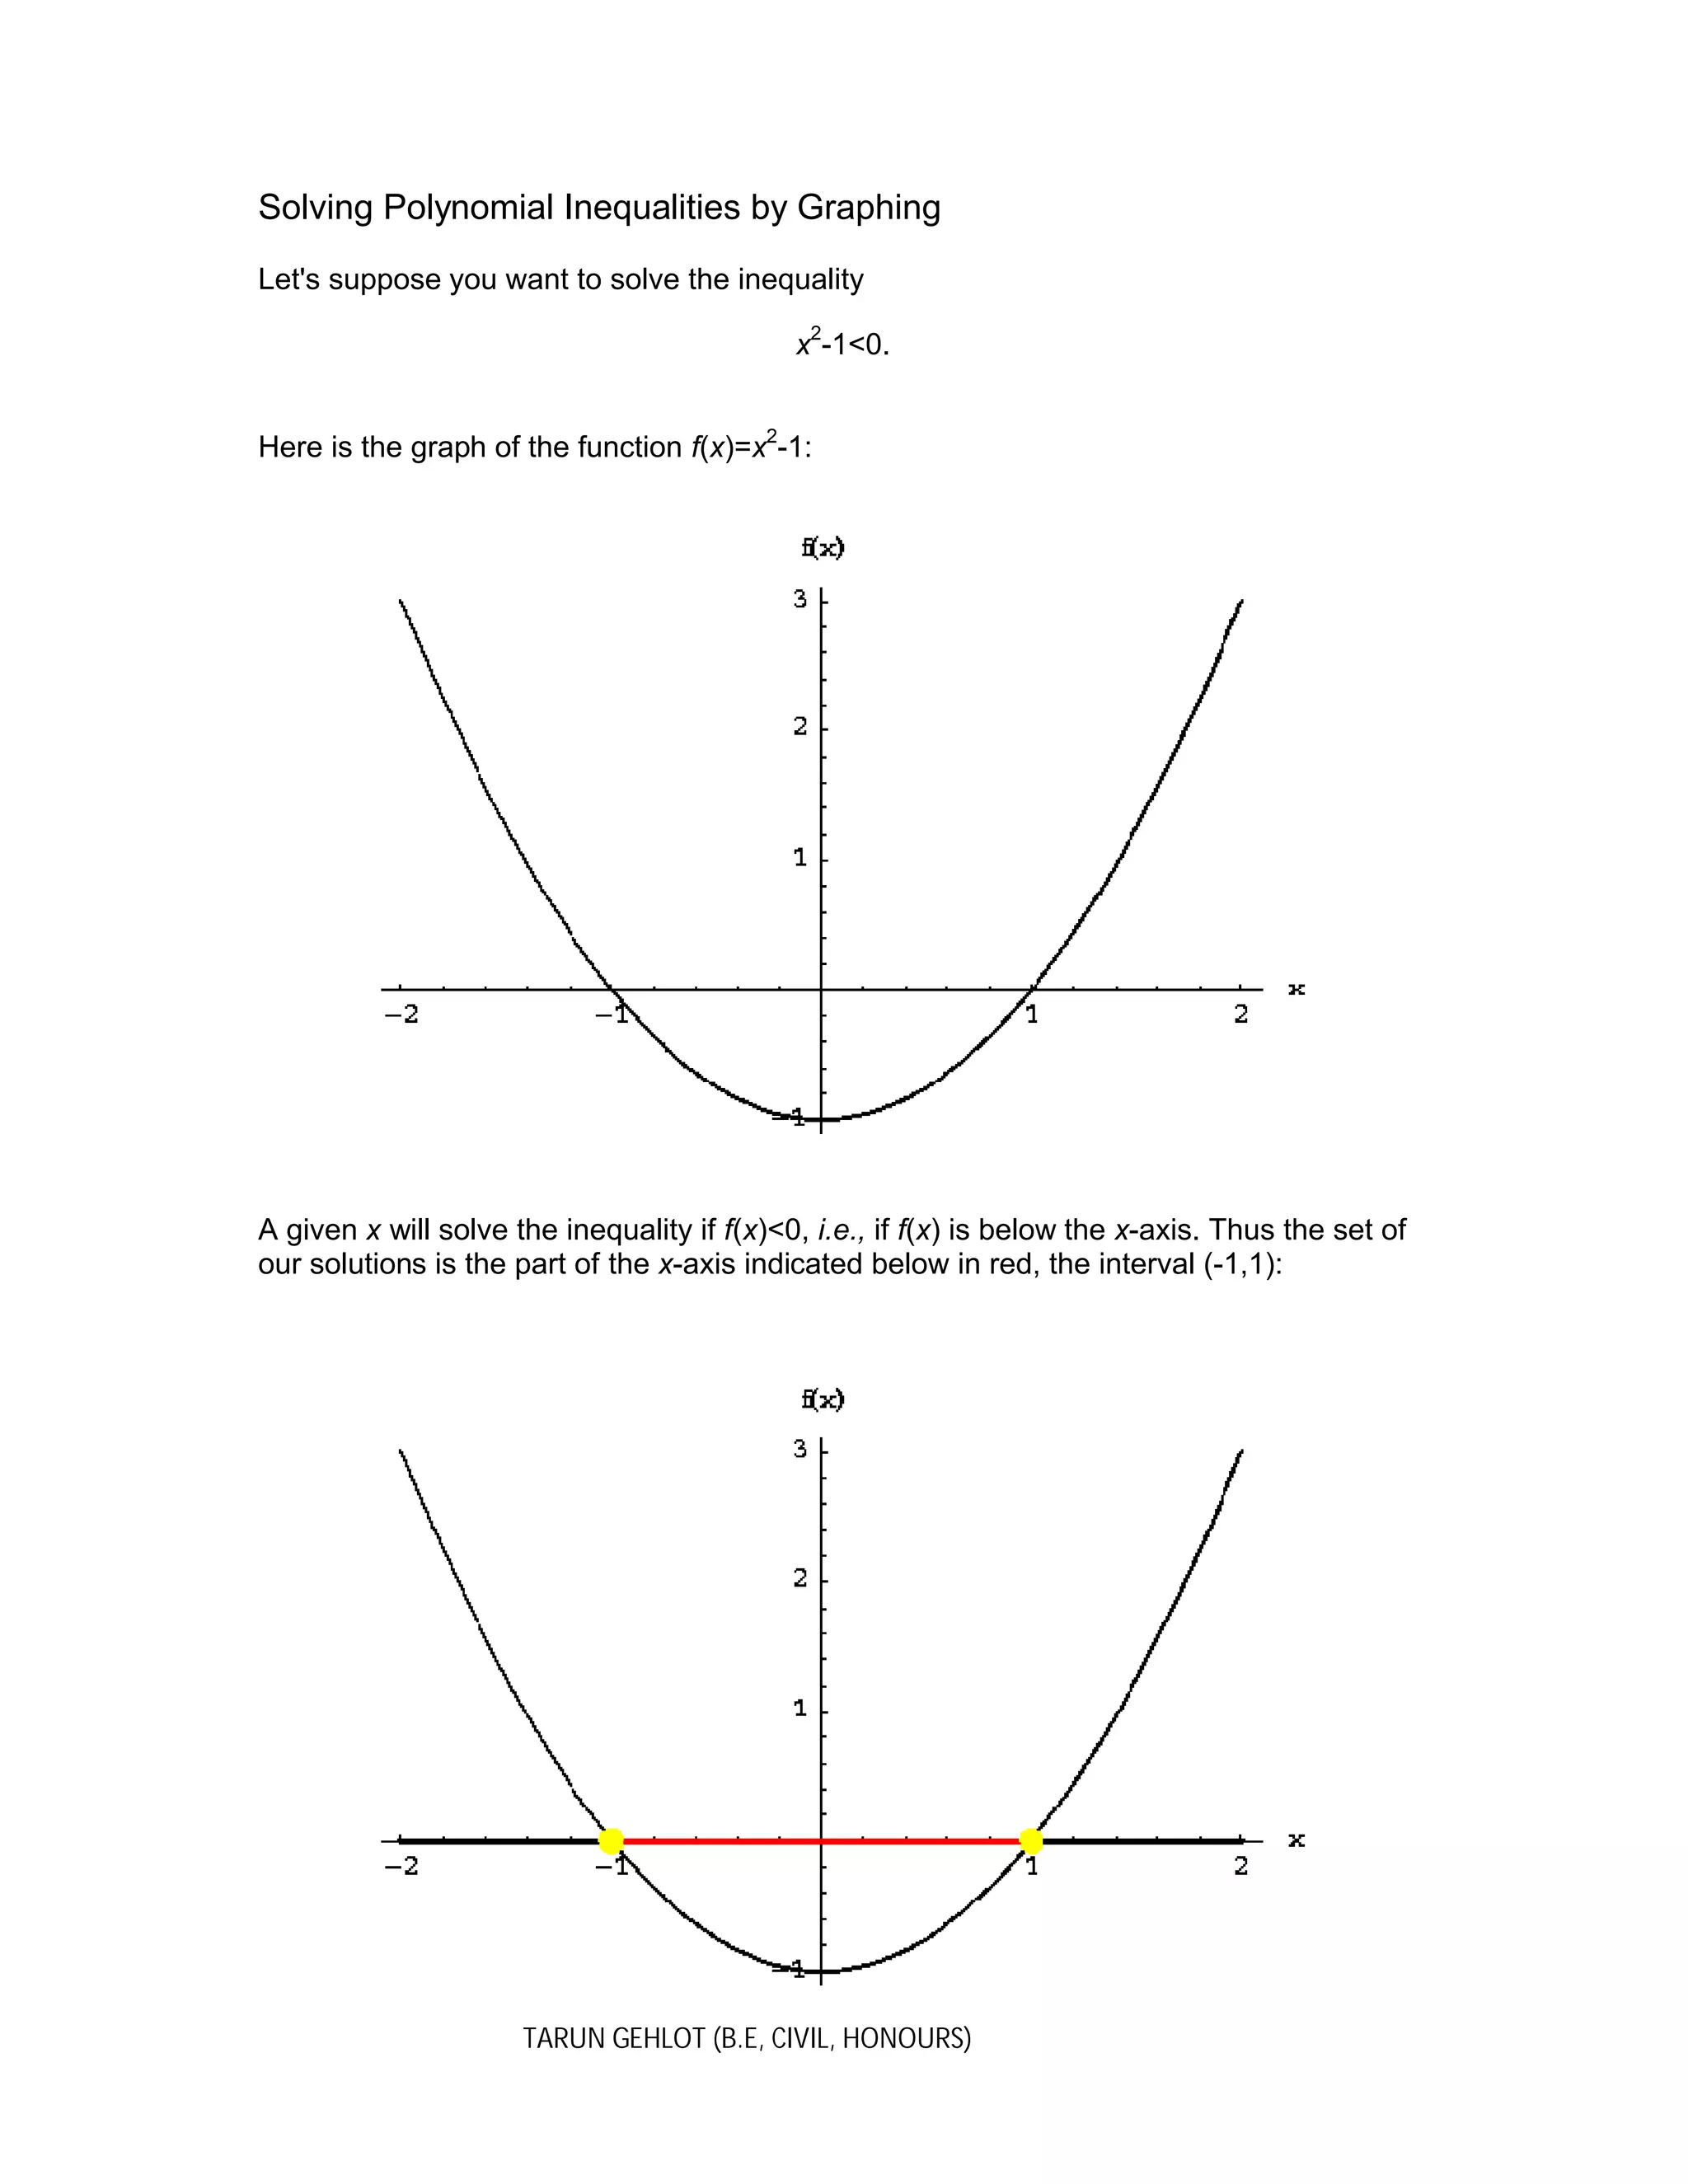
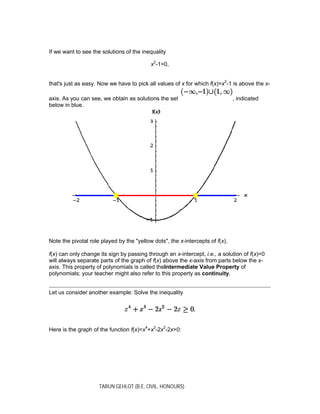
This document discusses solving polynomial inequalities by graphing. It explains that the solutions to an inequality like x^2 - 1 < 0 are the x-values where the graph of f(x)=x^2 - 1 is below the x-axis, or the interval (-1,1). Similarly, the solutions to x^2 - 1 > 0 are where the graph is above the x-axis. The x-intercepts, where f(x)=0, separate parts of the graph above and below the x-axis. Another example solves the inequality x^4 + x^3 - 2x^2 - 2x > 0, whose solutions are the union of the intervals (-1,0), (