Download to read offline
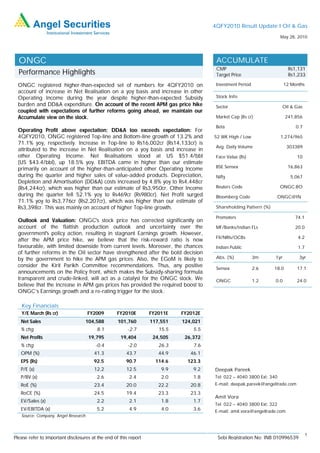
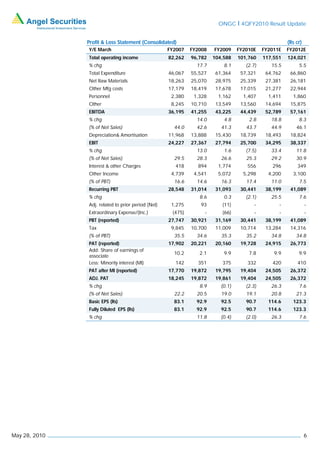

ONGC reported higher than expected results for the fourth quarter of fiscal year 2010 driven by increased net realizations and other operating income. Earnings before interest, taxes, depreciation, and amortization were above estimates due to higher other income. Depreciation costs were also higher than expected. The company maintained an accumulate rating and target price of Rs1,233 based on the positive impact of increased gas prices and potential for further reforms in the oil and gas sector.


