Downloaded 455 times
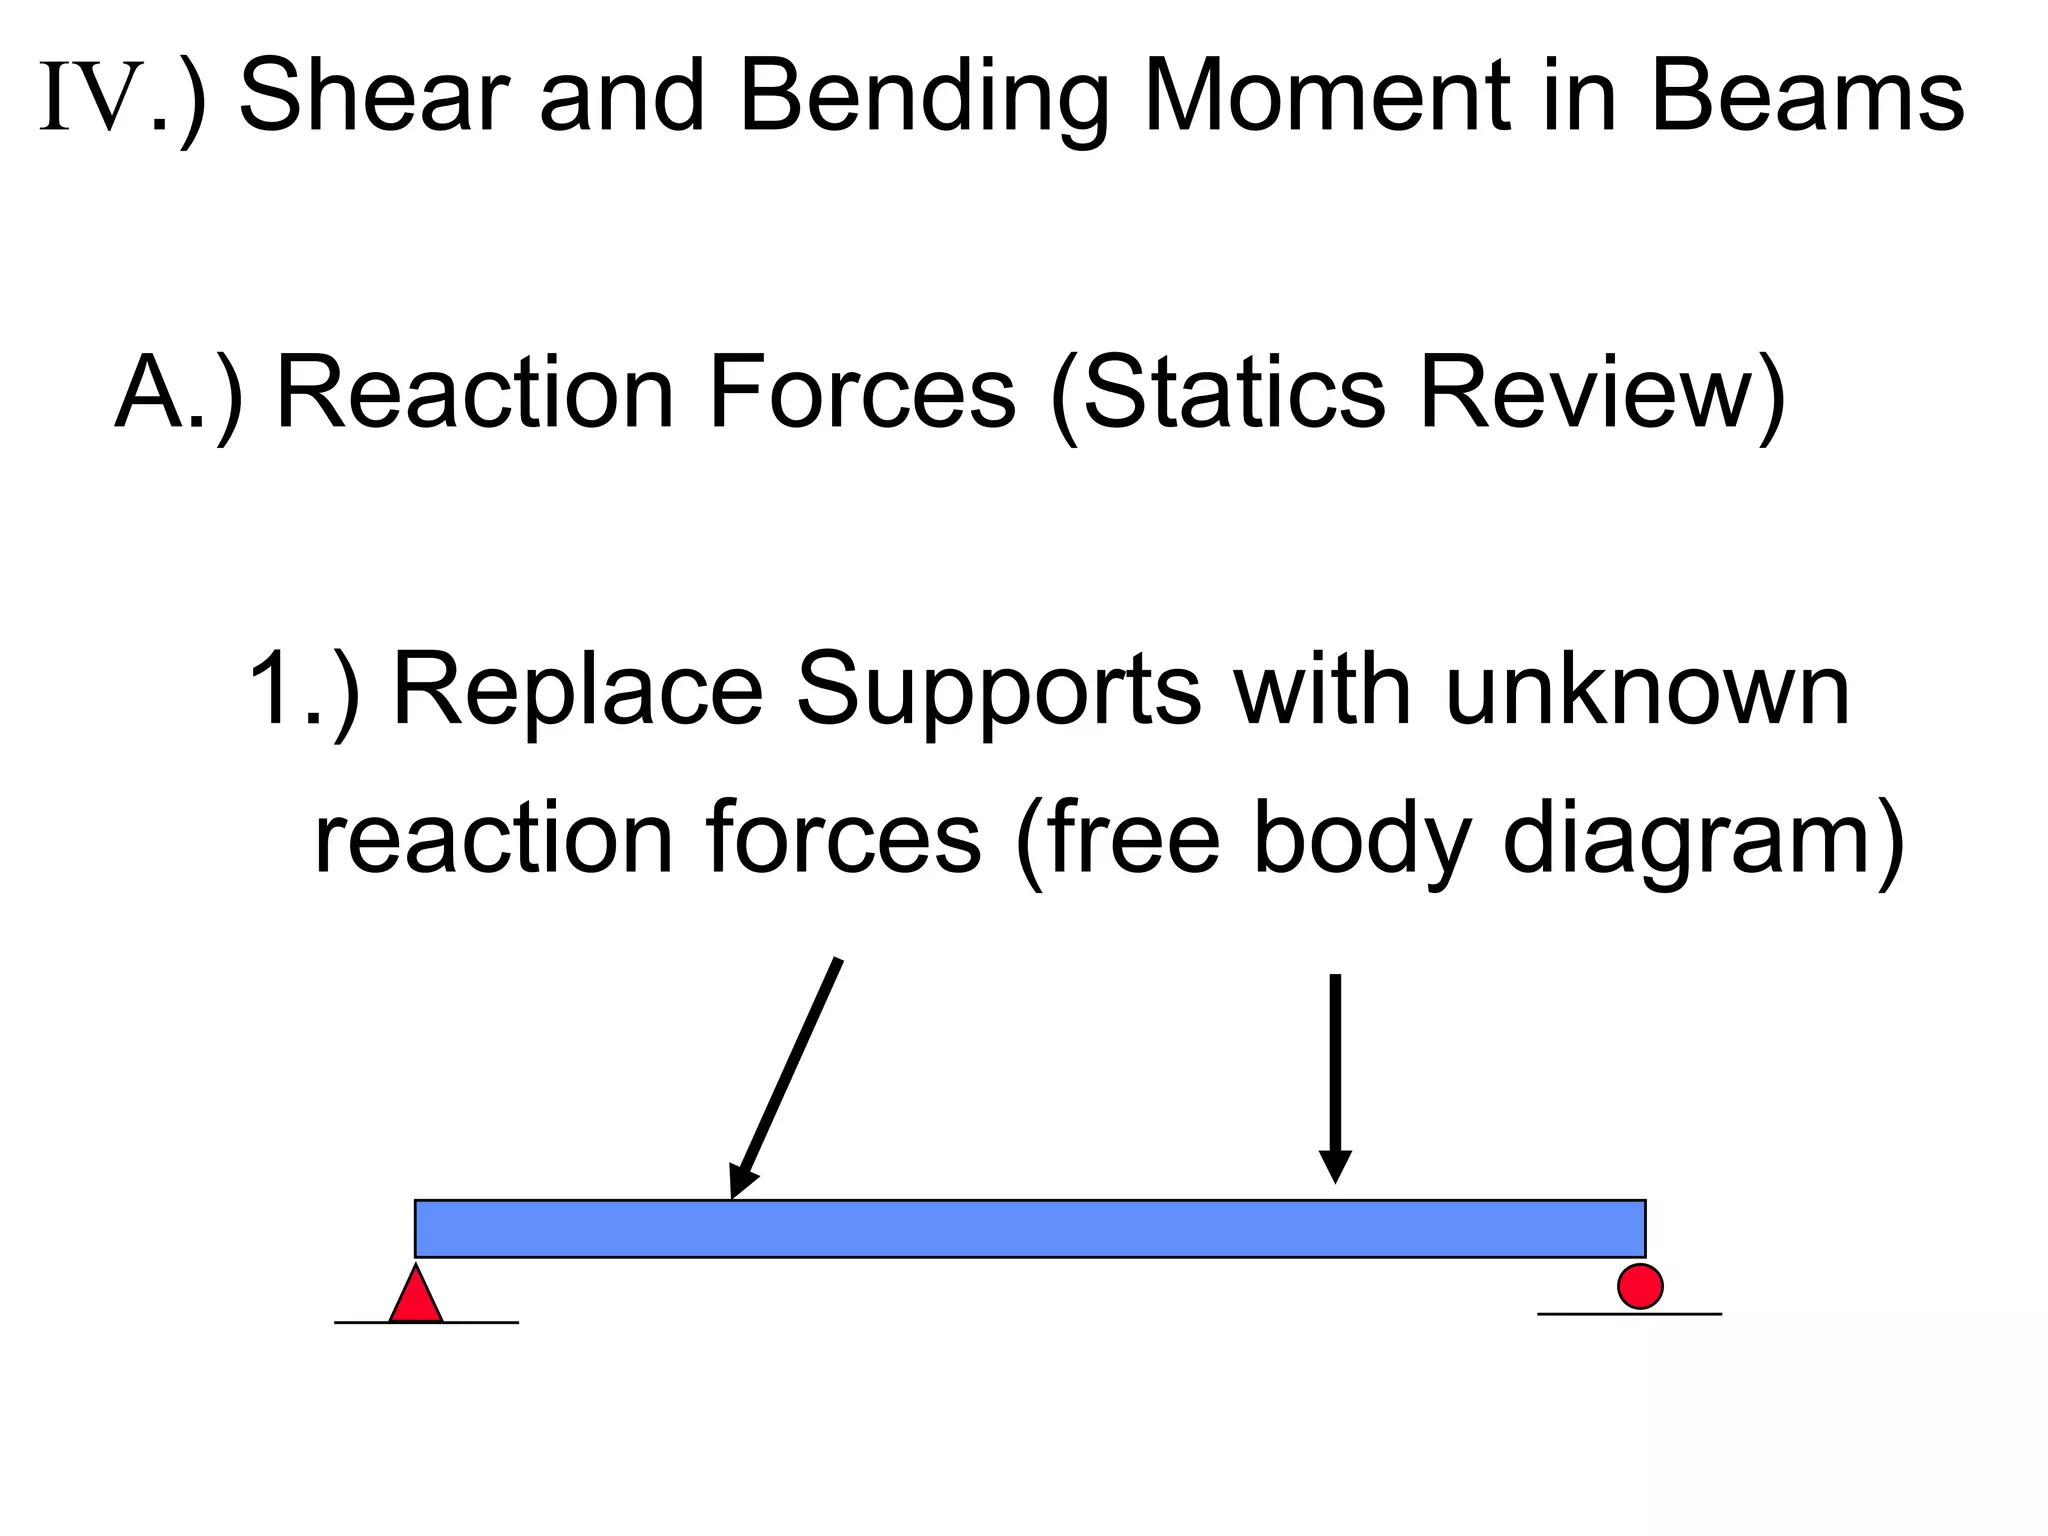


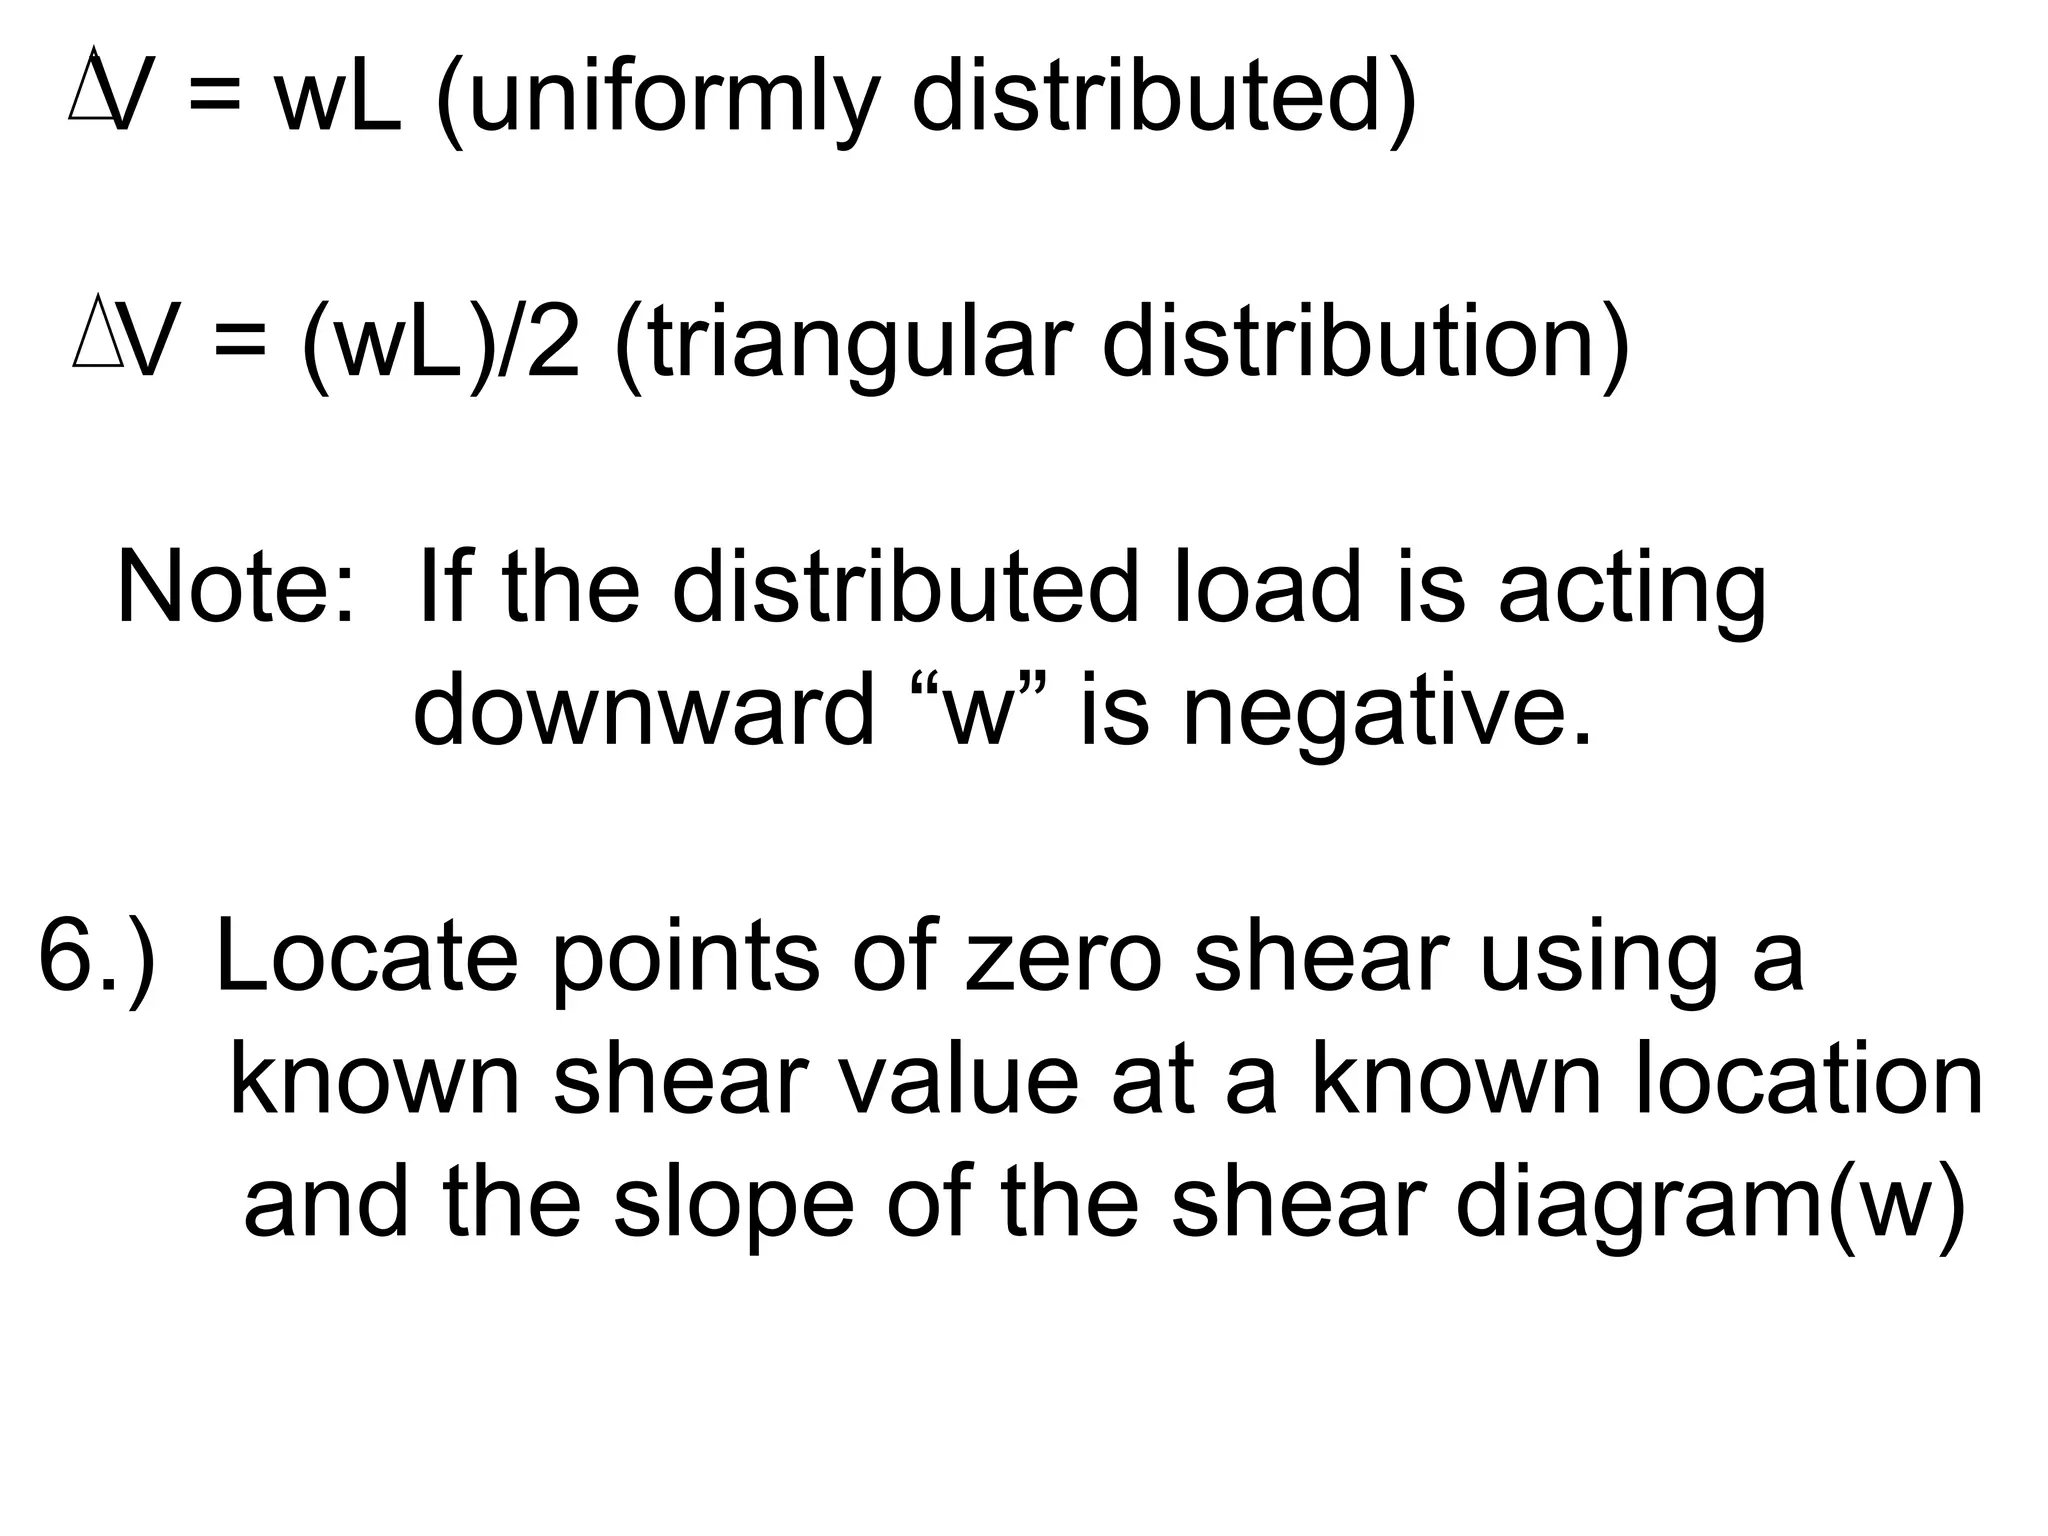


The document discusses the concepts of shear and bending moment in beams. It covers reaction forces at supports, calculating internal shear and bending moment by cutting sections of the beam, and how to construct shear and moment diagrams by sketching the beam, supports, and loads and calculating shear and moment values at points along the beam from left to right. The diagrams allow identifying locations of maximum shear and moment.


![Geotechnical Engineering-II [Lec #18: Terzaghi Bearing Capacity Equation]](https://cdn.slidesharecdn.com/ss_thumbnails/18-181123045854-thumbnail.jpg?width=640&height=640&fit=bounds)