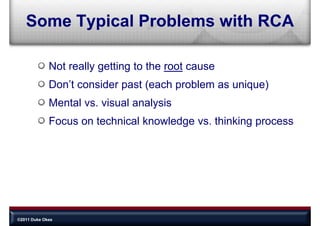
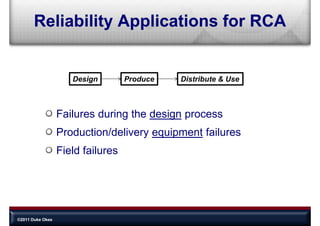
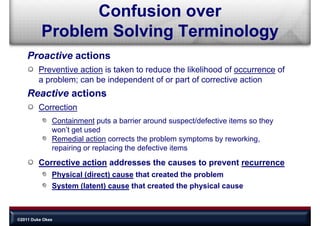
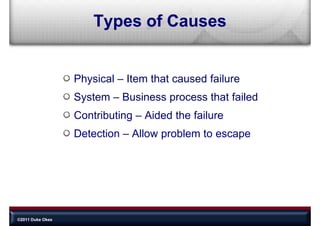
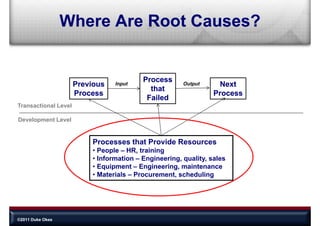
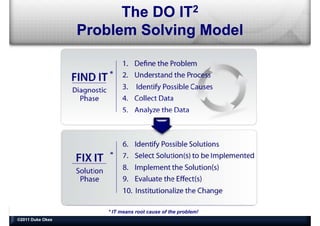
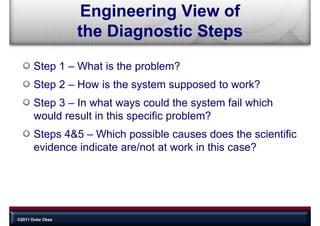
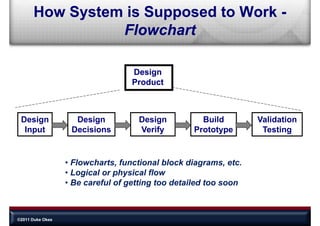
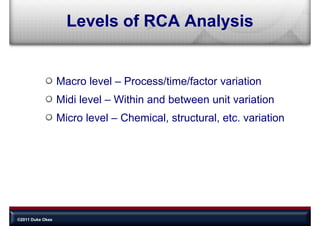
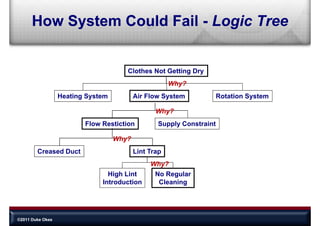
Root Cause Analysis: 
                   Root Cause Analysis:
                    Common Problems 
                    Common Problems
                      and Solutions
                                 Duke Okes
                            ©2012 ASQ & Presentation Duke
                            Presented live on Aug 09th, 2012


http://reliabilitycalendar.org/The_Re
liability_Calendar/Webinars_
liability Calendar/Webinars ‐
_English/Webinars_‐_English.html
ASQ Reliability Division 
                 ASQ Reliability Division
                 English Webinar Series
                 English Webinar Series
                  One of the monthly webinars 
                  One of the monthly webinars
                    on topics of interest to 
                      reliability engineers.
                    To view recorded webinar (available to ASQ Reliability 
                        Division members only) visit asq.org/reliability
                                             )              /

                     To sign up for the free and available to anyone live 
                    webinars visit reliabilitycalendar.org and select English 
                    Webinars to find links to register for upcoming events


http://reliabilitycalendar.org/The_Re
liability_Calendar/Webinars_
liability Calendar/Webinars ‐
_English/Webinars_‐_English.html
by Duke Okes
© 2011 Duke Okes
Some Typical Problems with RCA

             Not really getting to the root cause
             Don’t consider past (each problem as unique)
             Mental
             M t l vs. visual analysis
                        i   l    l i
             Focus on technical knowledge vs. thinking p
                                       g             g process


©2011 Duke Okes
Reliability Applications for RCA


                     Design        Produce   Distribute & Use


                  Failures during the design process
                  Production/delivery equipment failures
                  Field failures


©2011 Duke Okes
Confusion over
          P bl
          Problem S l i T     i l
                  Solving Terminology
    Proactive actions
         Preventive action is taken to reduce the likelihood of occurrence of
         a problem; can be independent of or part of corrective action
    Reactive actions
         Correction
              Containment puts a barrier around suspect/defective items so they
              won’t get used
              Remedial action corrects the problem symptoms by reworking,
              repairing or replacing the defective items
                p     g      p     g
         Corrective action addresses the causes to prevent recurrence
              Physical (direct) cause that created the problem
              System (latent) cause that created the physical cause


©2011 Duke Okes
Types of Causes


                  Physical Item that caused failure
                  Ph i l – It   th t      d f il
                  System – Business process that failed
                  Contributing – Aided the failure
                  Detection – Allow problem to escape


©2011 Duke Okes
Where Are Root Causes?


                                           Process
                      Previous    Input                 Output      Next
                                             that
                      Process                                     Process
                                            Failed
Transactional Level

Development Level


                           Processes that Provide Resources
                           • People – HR training
                                      HR,
                           • Information – Engineering, quality, sales
                           • Equipment – Engineering, maintenance
                           • Materials – Procurement scheduling
                                         Procurement,


©2011 Duke Okes
How Far to Drill Down


          Is it outside something you can control or influence?
          What is the level of risk (probability, impact)?
          Is there data that indicates we didn’t go far enough
          previously?
          What are the opportunity costs?


©2011 Duke Okes
Treating Problems as Unique

  Batch #:                          1    2    3    4    5
  Attribute:                        OK
                                    O    OK
                                         O    OK
                                              O    OK
                                                   O    NG
                                                         G

                   Measured Value
                                                             Spec

                            V
  Possibilities:       ured Value


                                                             Spec
                   Measu
                   Measured Value
                            Va


                                                             Spec


©2011 Duke Okes
The
Importance
    o
    of
  Visual
  Tools
The DO IT2
                  Problem Solving Model
                  P bl    S l i M d l


                     * IT means root cause of the problem!
©2011 Duke Okes
Engineering View of
                  the Diagnostic Steps
                  th Di       ti St
       Step 1 – What is the problem?
       Step 2 – How is the system supposed to work?
       Step
       St 3 – I what ways could th system fail which
               In h t               ld the  t f il hi h
       would result in this specific problem?
       Steps 4&5 – Which possible causes does the scientific
       evidence indicate are/not at work in this case?


©2011 Duke Okes
How System is Supposed to Work -
                Flowchart
                Fl    h t

                                   Design
                                       g
                                   Product


 Design             Design          Design          Build         Validation
  Input            Decisions        Verify        Prototype        Testing


                  • Flowcharts, functional block diagrams, etc.
                  • Logical or physical flow
                       g       p y
                  • Be careful of getting too detailed too soon


©2011 Duke Okes
Levels of RCA Analysis


                  Macro level – Process/time/factor variation
                  Midi level – Within and between unit variation
                  Micro level – Chemical, structural, etc. variation


©2011 Duke Okes
How System Could Fail - Logic Tree


                                      Clothes Not Getting Dry
                                                      Why?
                  Heating System          Air Flow System            Rotation System

                                                 Why?
                         Flow Restiction         Supply Constraint

                                   Why?
        Creased Duct                      Lint Trap
                                               Why?
                                High Lint       No Regular
                              Introduction       Cleaning


©2011 Duke Okes
A (Partial) Complete Logic Tree


                               Physical Level
                                 y


                                   System
                             (Policy/Procedure)
                                    Level


©2011 Duke Okes
• What controls are in place that
             should have prevented the
                         p
 Barrier     problem, and did they fail?
Analysis   • Wh t controls are in place to
             What      t l     i l      t
             detect the problem, and did they
             fail?

           • What combinations of barriers
             might have failed?

           • Note: Detection barriers can be
             valuable sources of data
Change Analysis

  Questions to ask:
       What has changed (environment, equipment people process )?
                        (environment equipment, people, process…)?
       When was it changed?
       Could the h
       C ld th changes b relevant t th problem?
                       be l     t to the  bl ?
  Cautions:
       There may be a significant delay between when a change is made and
       when the impact is seen
       Pertinent changes may be in other processes not readily apparent to
       where the problem is found
       Th changes may b k
       The h          be known or unknown (
                                    k             l    d       l    d)
                                          (e.g., planned or unplanned)


©2011 Duke Okes
Data Collection & Analysis

                   Teardown/failure analysis
                   5 human senses
                   Pictograms/concentration diagram
                   Interviews,
                   Interviews process records
                   Pattern analysis (time, sequence, batch, …)


©2011 Duke Okes
A Sequence for Drilling Down
                to Root Cause
                t R tC

                   What failed?       Problem symptoms
                                     Functions/subsystems

                  How did it fail?       Components
                                           Features
                  Why did it fail?          States
                                         System fault


©2011 Duke Okes
Cognitive Biases/Errors
                      to W t h F
                      t Watch For
            Recency effect
            Anchoring error
            Availability error
            Hindsight bias
            Confirmation bias
            Overuse heuristics
            O er se of he ristics


©2011 Duke Okes
Ultimate Objective of
                  Root Cause A l i
                  R tC        Analysis
       Building institutional knowledge/memory to eliminate
       repeat occurrences of the same problem for the same
       cause(s) – the CA in PDCA
       But reliability professionals can also improve the PD in
       PDCA by forward flow of information about potential
       problems, causes, etc.


©2011 Duke Okes
Example


                  Problem: Product failing in field
                                              field.
                  Cause: An actuator inside the product was not
                  robust enough for the application
                  Action taken: Drop the product line (sales
                  volume & margin were low).


©2011 Duke Okes
Contact Information


                      Duke Okes
                     423-323-7576
                     423 323 7576
                  dokes@earthlink.net
                       @
                   www.aplomet.com


©2011 Duke Okes

Root cause analysis common problems and solutions

  • 1.
    Root Cause Analysis:  Root Cause Analysis: Common Problems  Common Problems and Solutions Duke Okes ©2012 ASQ & Presentation Duke Presented live on Aug 09th, 2012 http://reliabilitycalendar.org/The_Re liability_Calendar/Webinars_ liability Calendar/Webinars ‐ _English/Webinars_‐_English.html
  • 2.
    ASQ Reliability Division  ASQ Reliability Division English Webinar Series English Webinar Series One of the monthly webinars  One of the monthly webinars on topics of interest to  reliability engineers. To view recorded webinar (available to ASQ Reliability  Division members only) visit asq.org/reliability ) / To sign up for the free and available to anyone live  webinars visit reliabilitycalendar.org and select English  Webinars to find links to register for upcoming events http://reliabilitycalendar.org/The_Re liability_Calendar/Webinars_ liability Calendar/Webinars ‐ _English/Webinars_‐_English.html
  • 3.
    by Duke Okes ©2011 Duke Okes
  • 4.
    Some Typical Problemswith RCA Not really getting to the root cause Don’t consider past (each problem as unique) Mental M t l vs. visual analysis i l l i Focus on technical knowledge vs. thinking p g g process ©2011 Duke Okes
  • 5.
    Reliability Applications forRCA Design Produce Distribute & Use Failures during the design process Production/delivery equipment failures Field failures ©2011 Duke Okes
  • 6.
    Confusion over P bl Problem S l i T i l Solving Terminology Proactive actions Preventive action is taken to reduce the likelihood of occurrence of a problem; can be independent of or part of corrective action Reactive actions Correction Containment puts a barrier around suspect/defective items so they won’t get used Remedial action corrects the problem symptoms by reworking, repairing or replacing the defective items p g p g Corrective action addresses the causes to prevent recurrence Physical (direct) cause that created the problem System (latent) cause that created the physical cause ©2011 Duke Okes
  • 7.
    Types of Causes Physical Item that caused failure Ph i l – It th t d f il System – Business process that failed Contributing – Aided the failure Detection – Allow problem to escape ©2011 Duke Okes
  • 8.
    Where Are RootCauses? Process Previous Input Output Next that Process Process Failed Transactional Level Development Level Processes that Provide Resources • People – HR training HR, • Information – Engineering, quality, sales • Equipment – Engineering, maintenance • Materials – Procurement scheduling Procurement, ©2011 Duke Okes
  • 9.
    How Far toDrill Down Is it outside something you can control or influence? What is the level of risk (probability, impact)? Is there data that indicates we didn’t go far enough previously? What are the opportunity costs? ©2011 Duke Okes
  • 10.
    Treating Problems asUnique Batch #: 1 2 3 4 5 Attribute: OK O OK O OK O OK O NG G Measured Value Spec V Possibilities: ured Value Spec Measu Measured Value Va Spec ©2011 Duke Okes
  • 11.
    The Importance o of Visual Tools
  • 12.
    The DO IT2 Problem Solving Model P bl S l i M d l * IT means root cause of the problem! ©2011 Duke Okes
  • 13.
    Engineering View of the Diagnostic Steps th Di ti St Step 1 – What is the problem? Step 2 – How is the system supposed to work? Step St 3 – I what ways could th system fail which In h t ld the t f il hi h would result in this specific problem? Steps 4&5 – Which possible causes does the scientific evidence indicate are/not at work in this case? ©2011 Duke Okes
  • 14.
    How System isSupposed to Work - Flowchart Fl h t Design g Product Design Design Design Build Validation Input Decisions Verify Prototype Testing • Flowcharts, functional block diagrams, etc. • Logical or physical flow g p y • Be careful of getting too detailed too soon ©2011 Duke Okes
  • 15.
    Levels of RCAAnalysis Macro level – Process/time/factor variation Midi level – Within and between unit variation Micro level – Chemical, structural, etc. variation ©2011 Duke Okes
  • 16.
    How System CouldFail - Logic Tree Clothes Not Getting Dry Why? Heating System Air Flow System Rotation System Why? Flow Restiction Supply Constraint Why? Creased Duct Lint Trap Why? High Lint No Regular Introduction Cleaning ©2011 Duke Okes
  • 17.
    A (Partial) CompleteLogic Tree Physical Level y System (Policy/Procedure) Level ©2011 Duke Okes
  • 18.
    • What controlsare in place that should have prevented the p Barrier problem, and did they fail? Analysis • Wh t controls are in place to What t l i l t detect the problem, and did they fail? • What combinations of barriers might have failed? • Note: Detection barriers can be valuable sources of data
  • 19.
    Change Analysis Questions to ask: What has changed (environment, equipment people process )? (environment equipment, people, process…)? When was it changed? Could the h C ld th changes b relevant t th problem? be l t to the bl ? Cautions: There may be a significant delay between when a change is made and when the impact is seen Pertinent changes may be in other processes not readily apparent to where the problem is found Th changes may b k The h be known or unknown ( k l d l d) (e.g., planned or unplanned) ©2011 Duke Okes
  • 20.
    Data Collection &Analysis Teardown/failure analysis 5 human senses Pictograms/concentration diagram Interviews, Interviews process records Pattern analysis (time, sequence, batch, …) ©2011 Duke Okes
  • 21.
    A Sequence forDrilling Down to Root Cause t R tC What failed? Problem symptoms Functions/subsystems How did it fail? Components Features Why did it fail? States System fault ©2011 Duke Okes
  • 22.
    Cognitive Biases/Errors to W t h F t Watch For Recency effect Anchoring error Availability error Hindsight bias Confirmation bias Overuse heuristics O er se of he ristics ©2011 Duke Okes
  • 23.
    Ultimate Objective of Root Cause A l i R tC Analysis Building institutional knowledge/memory to eliminate repeat occurrences of the same problem for the same cause(s) – the CA in PDCA But reliability professionals can also improve the PD in PDCA by forward flow of information about potential problems, causes, etc. ©2011 Duke Okes
  • 24.
    Example Problem: Product failing in field field. Cause: An actuator inside the product was not robust enough for the application Action taken: Drop the product line (sales volume & margin were low). ©2011 Duke Okes
  • 25.
    Contact Information Duke Okes 423-323-7576 423 323 7576 dokes@earthlink.net @ www.aplomet.com ©2011 Duke Okes