Download as PDF, PPTX
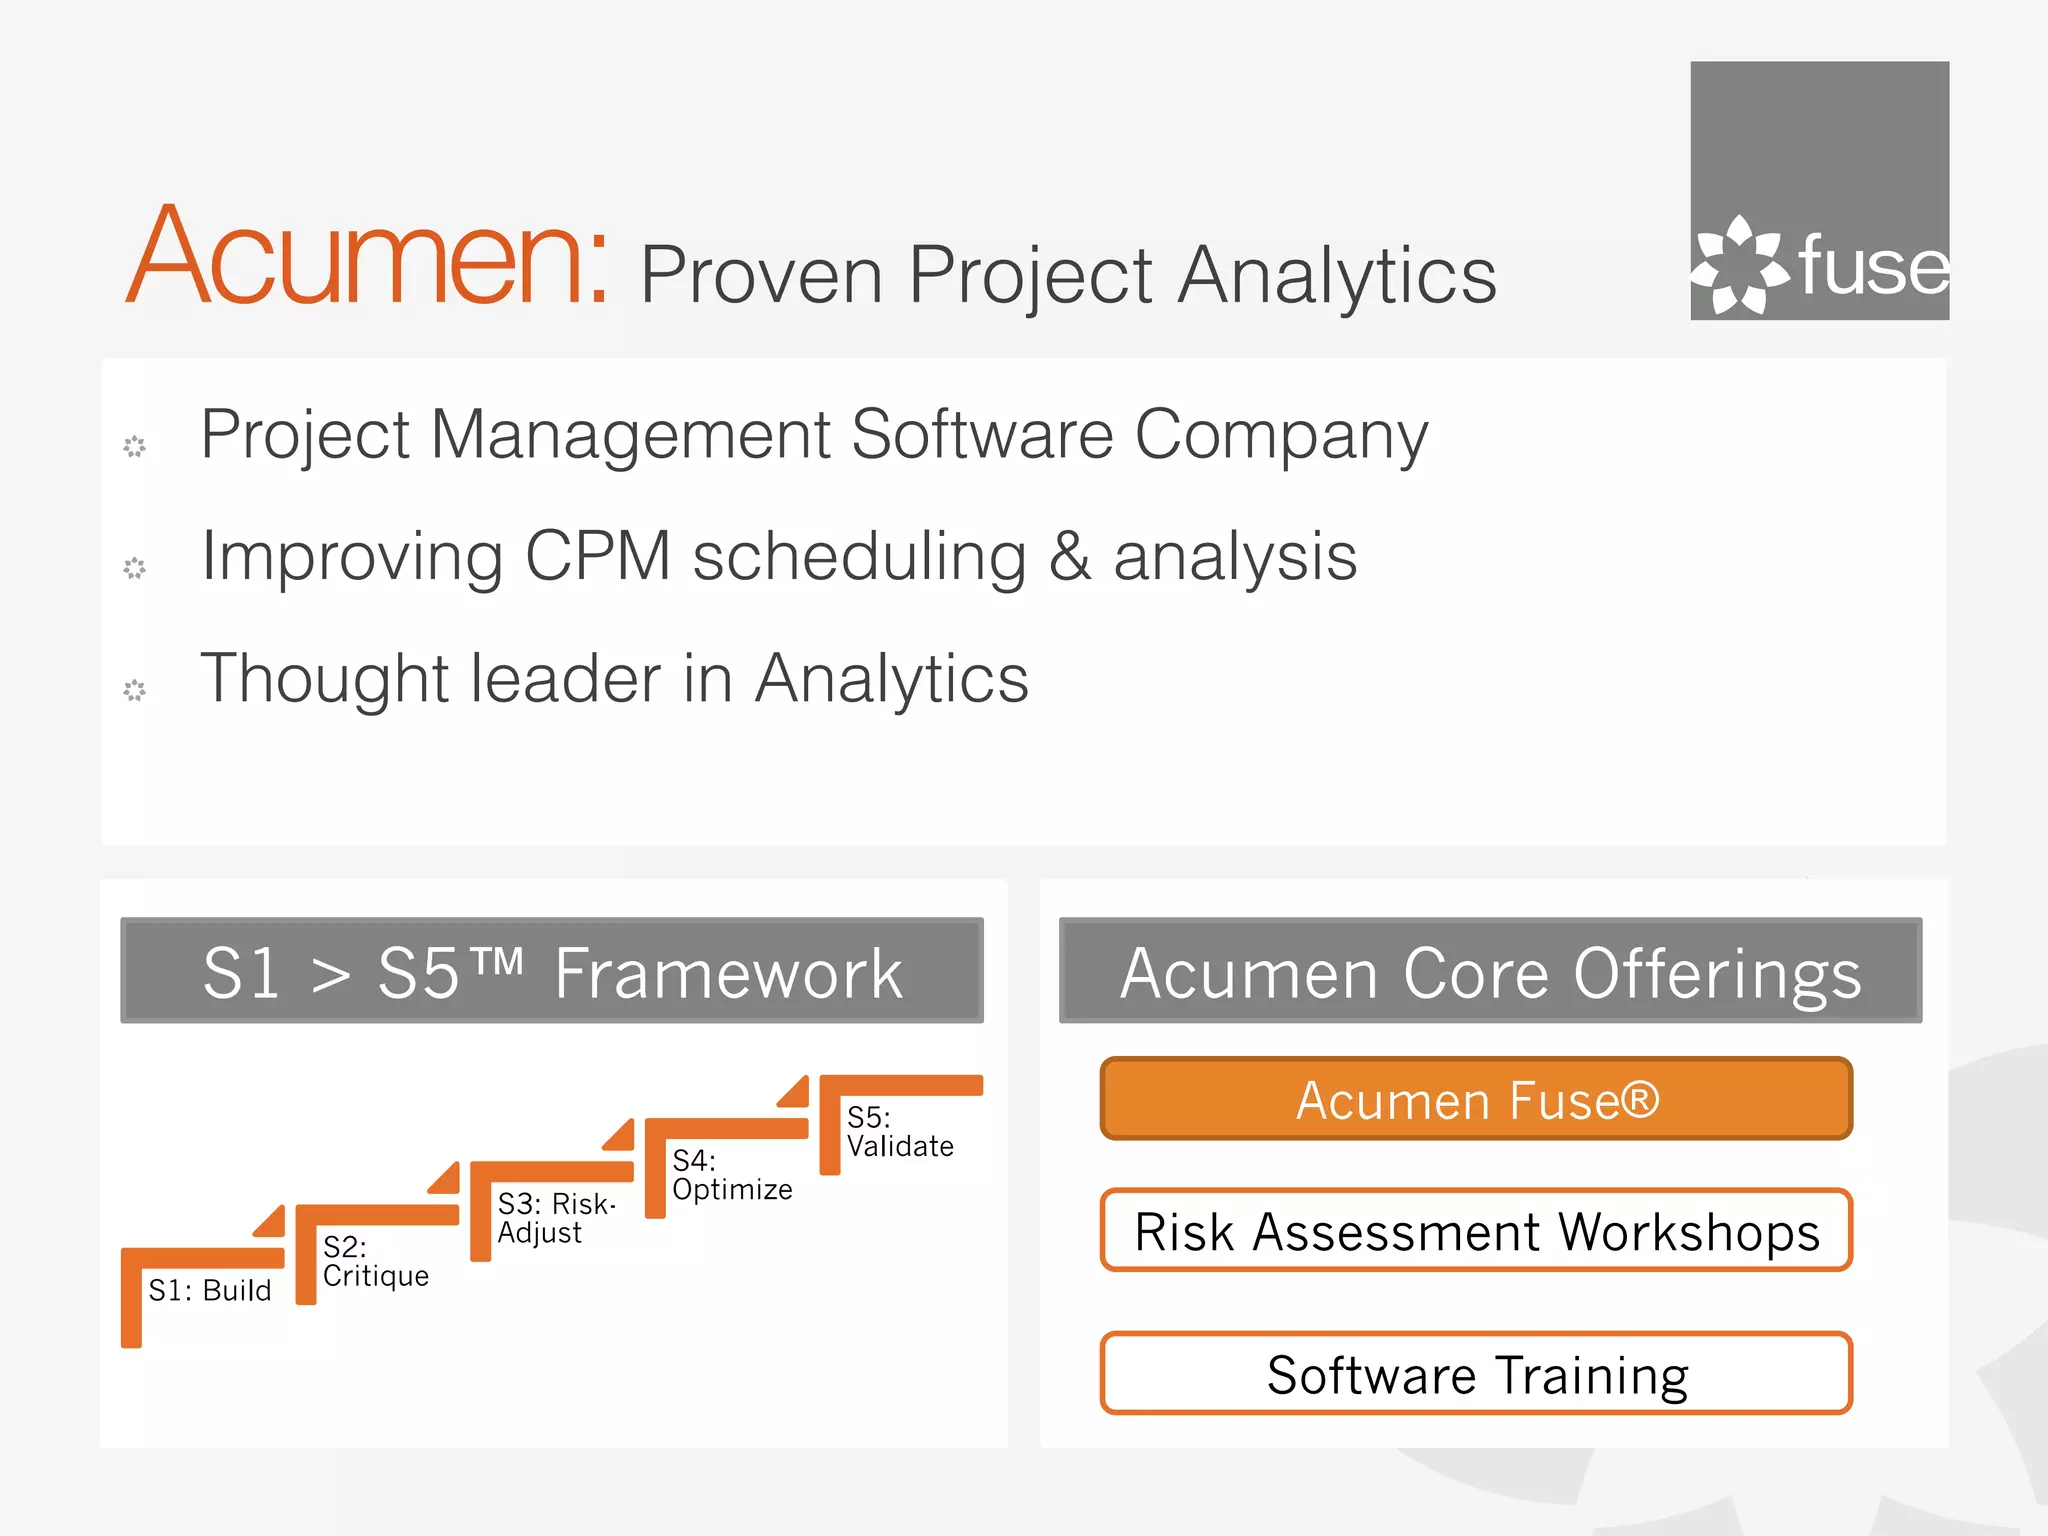
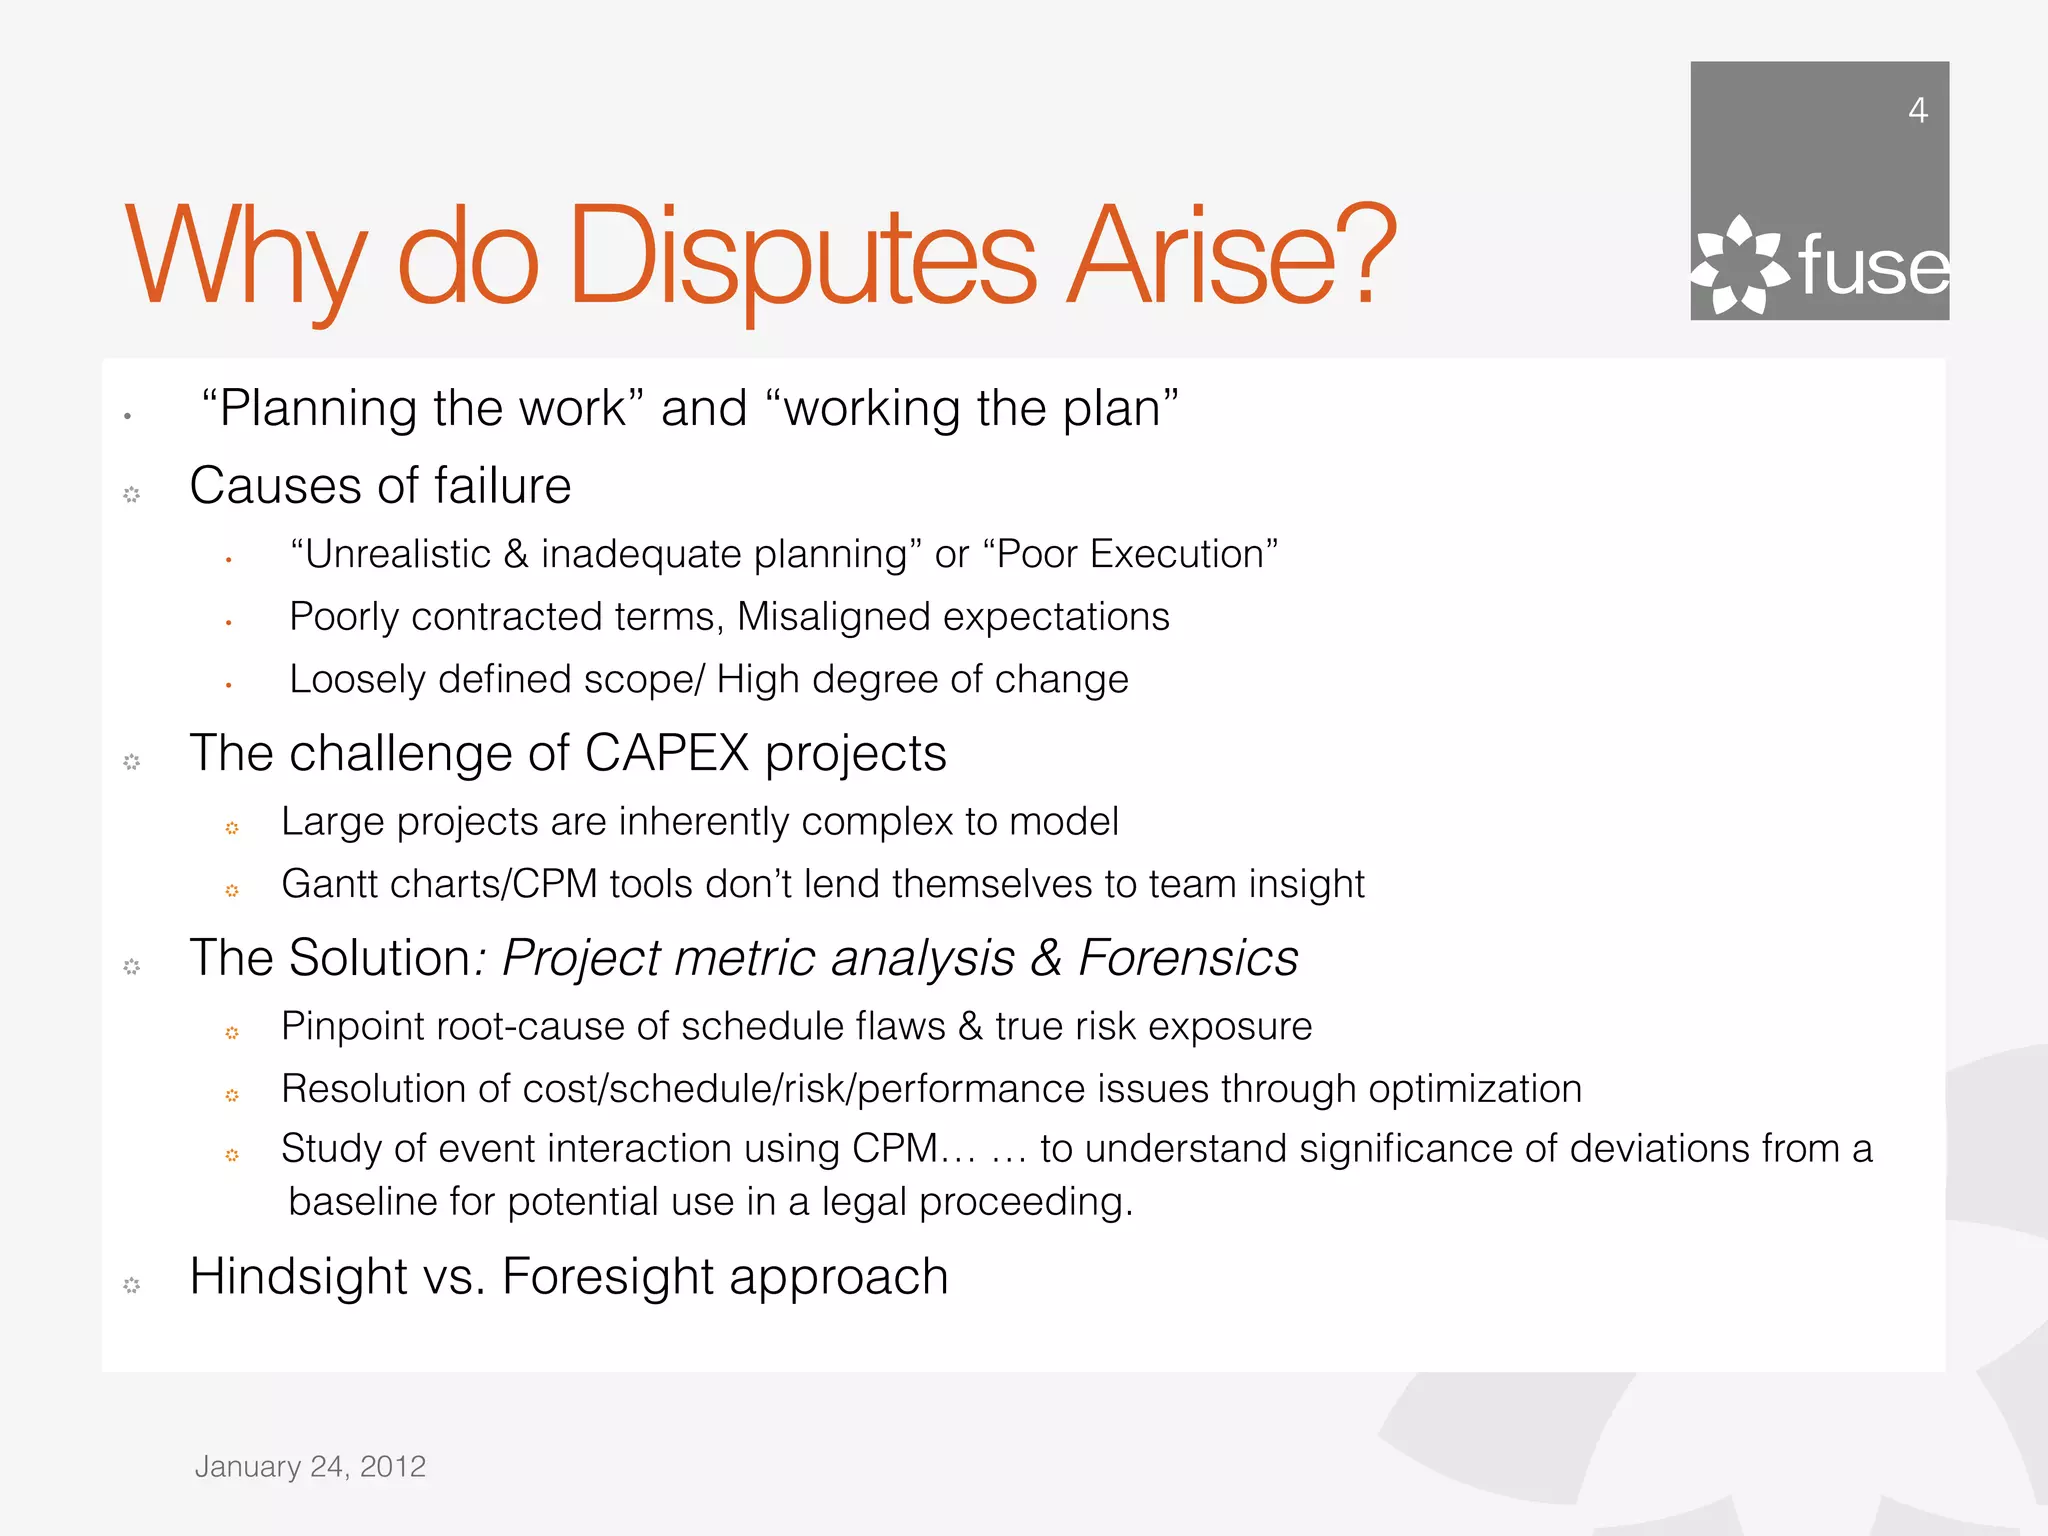
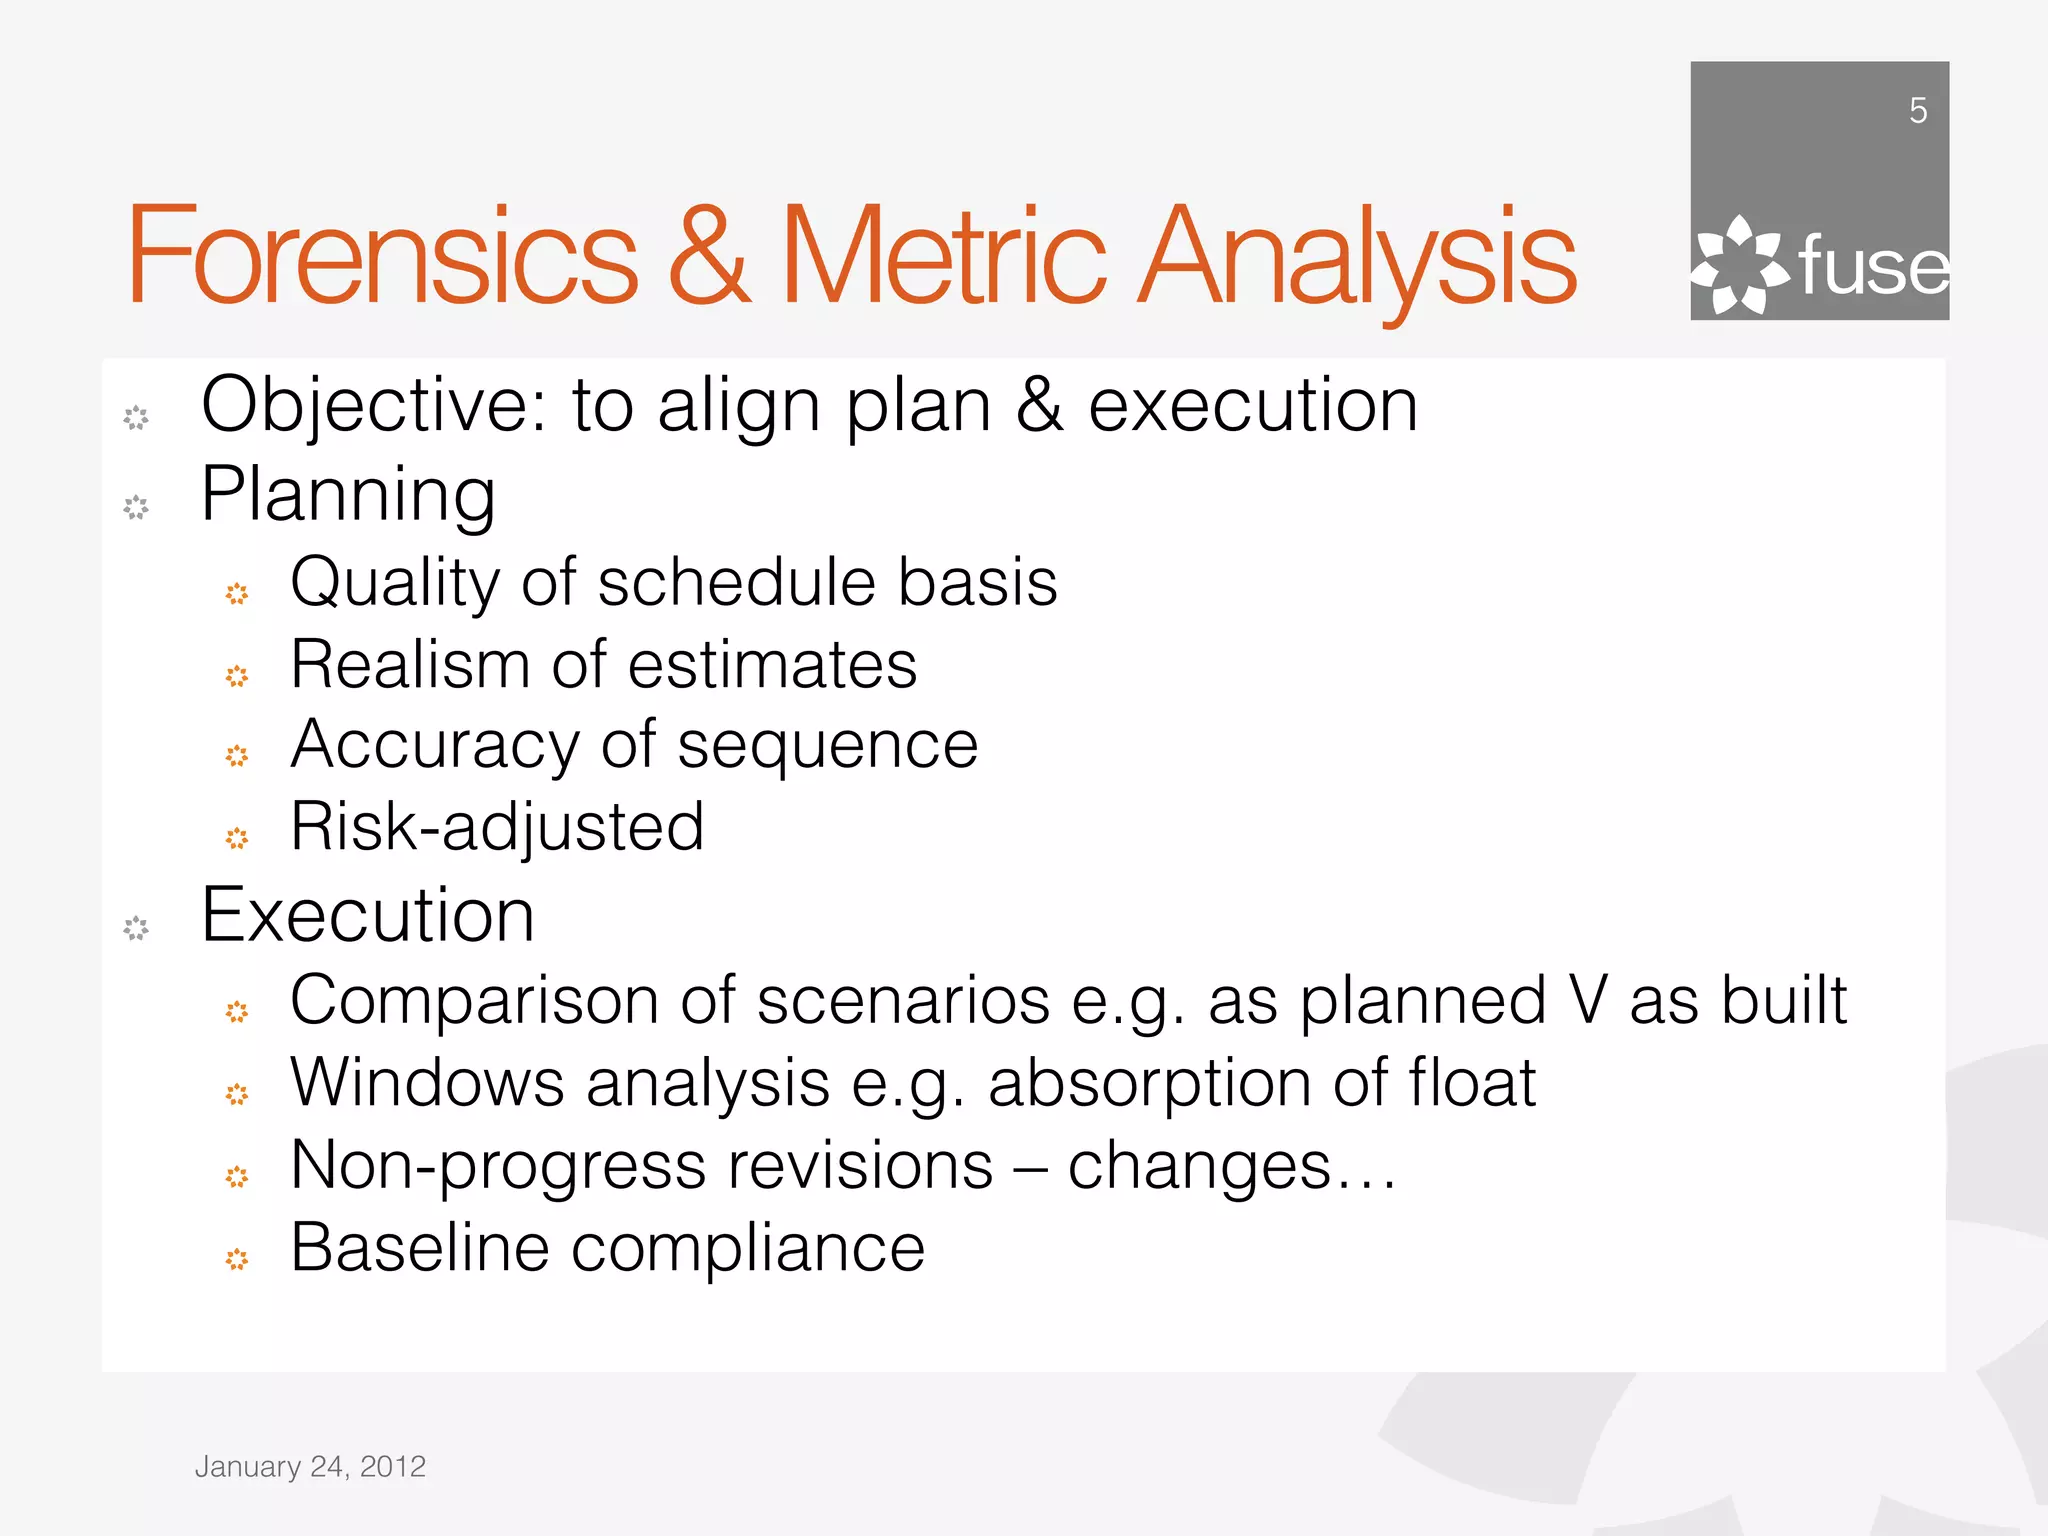
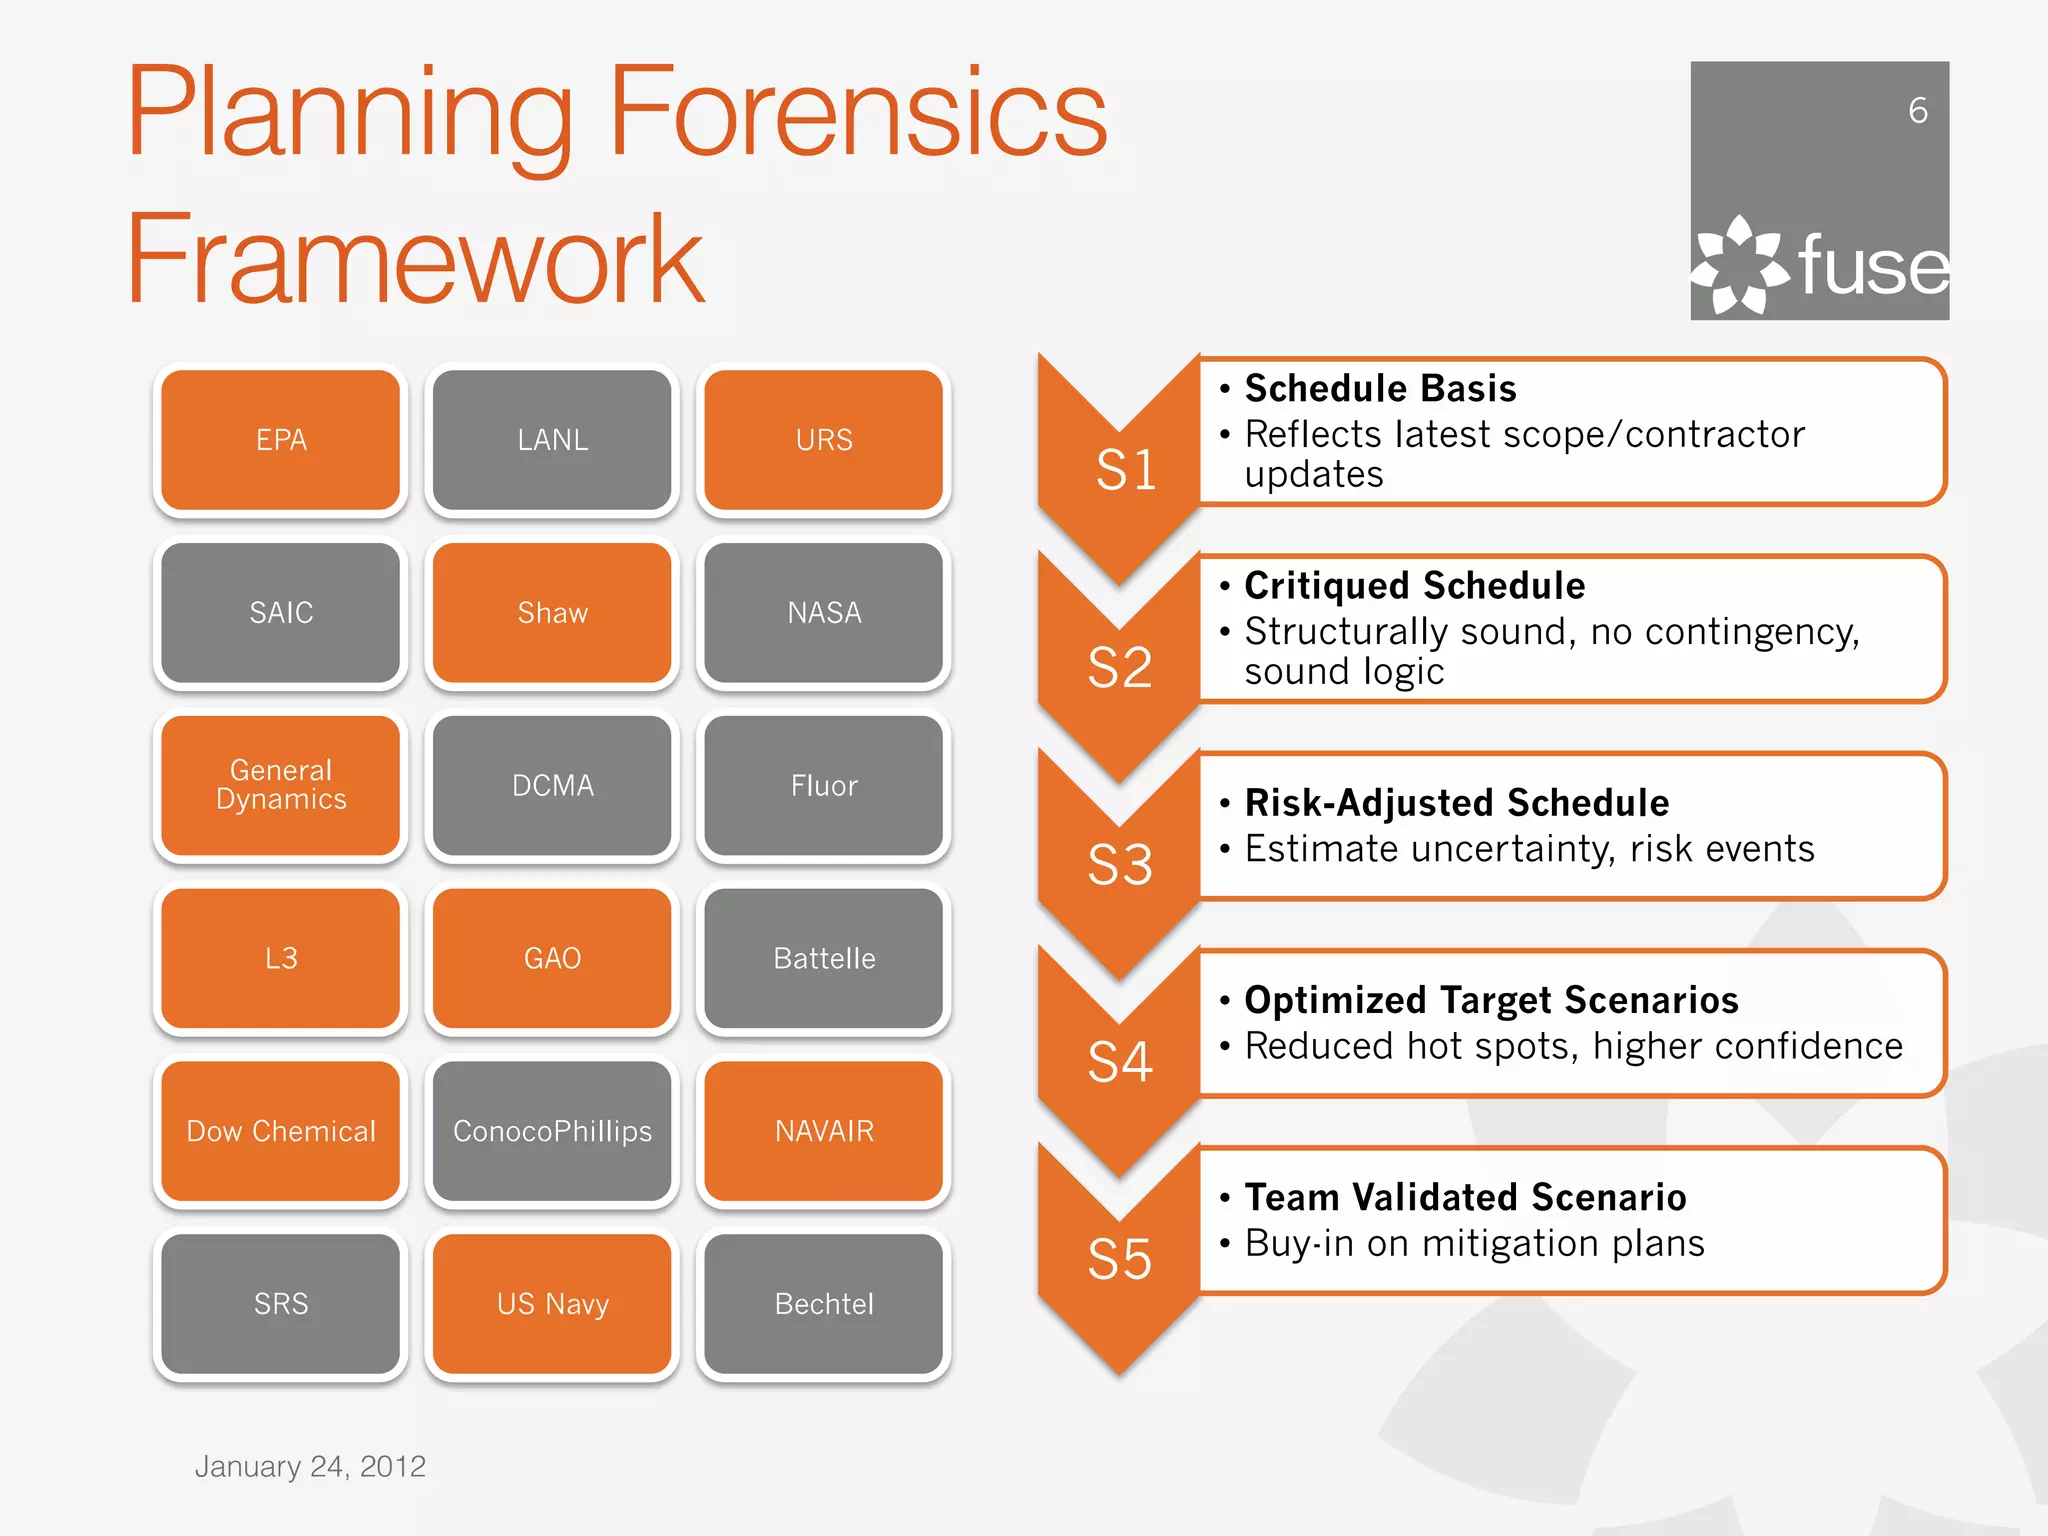
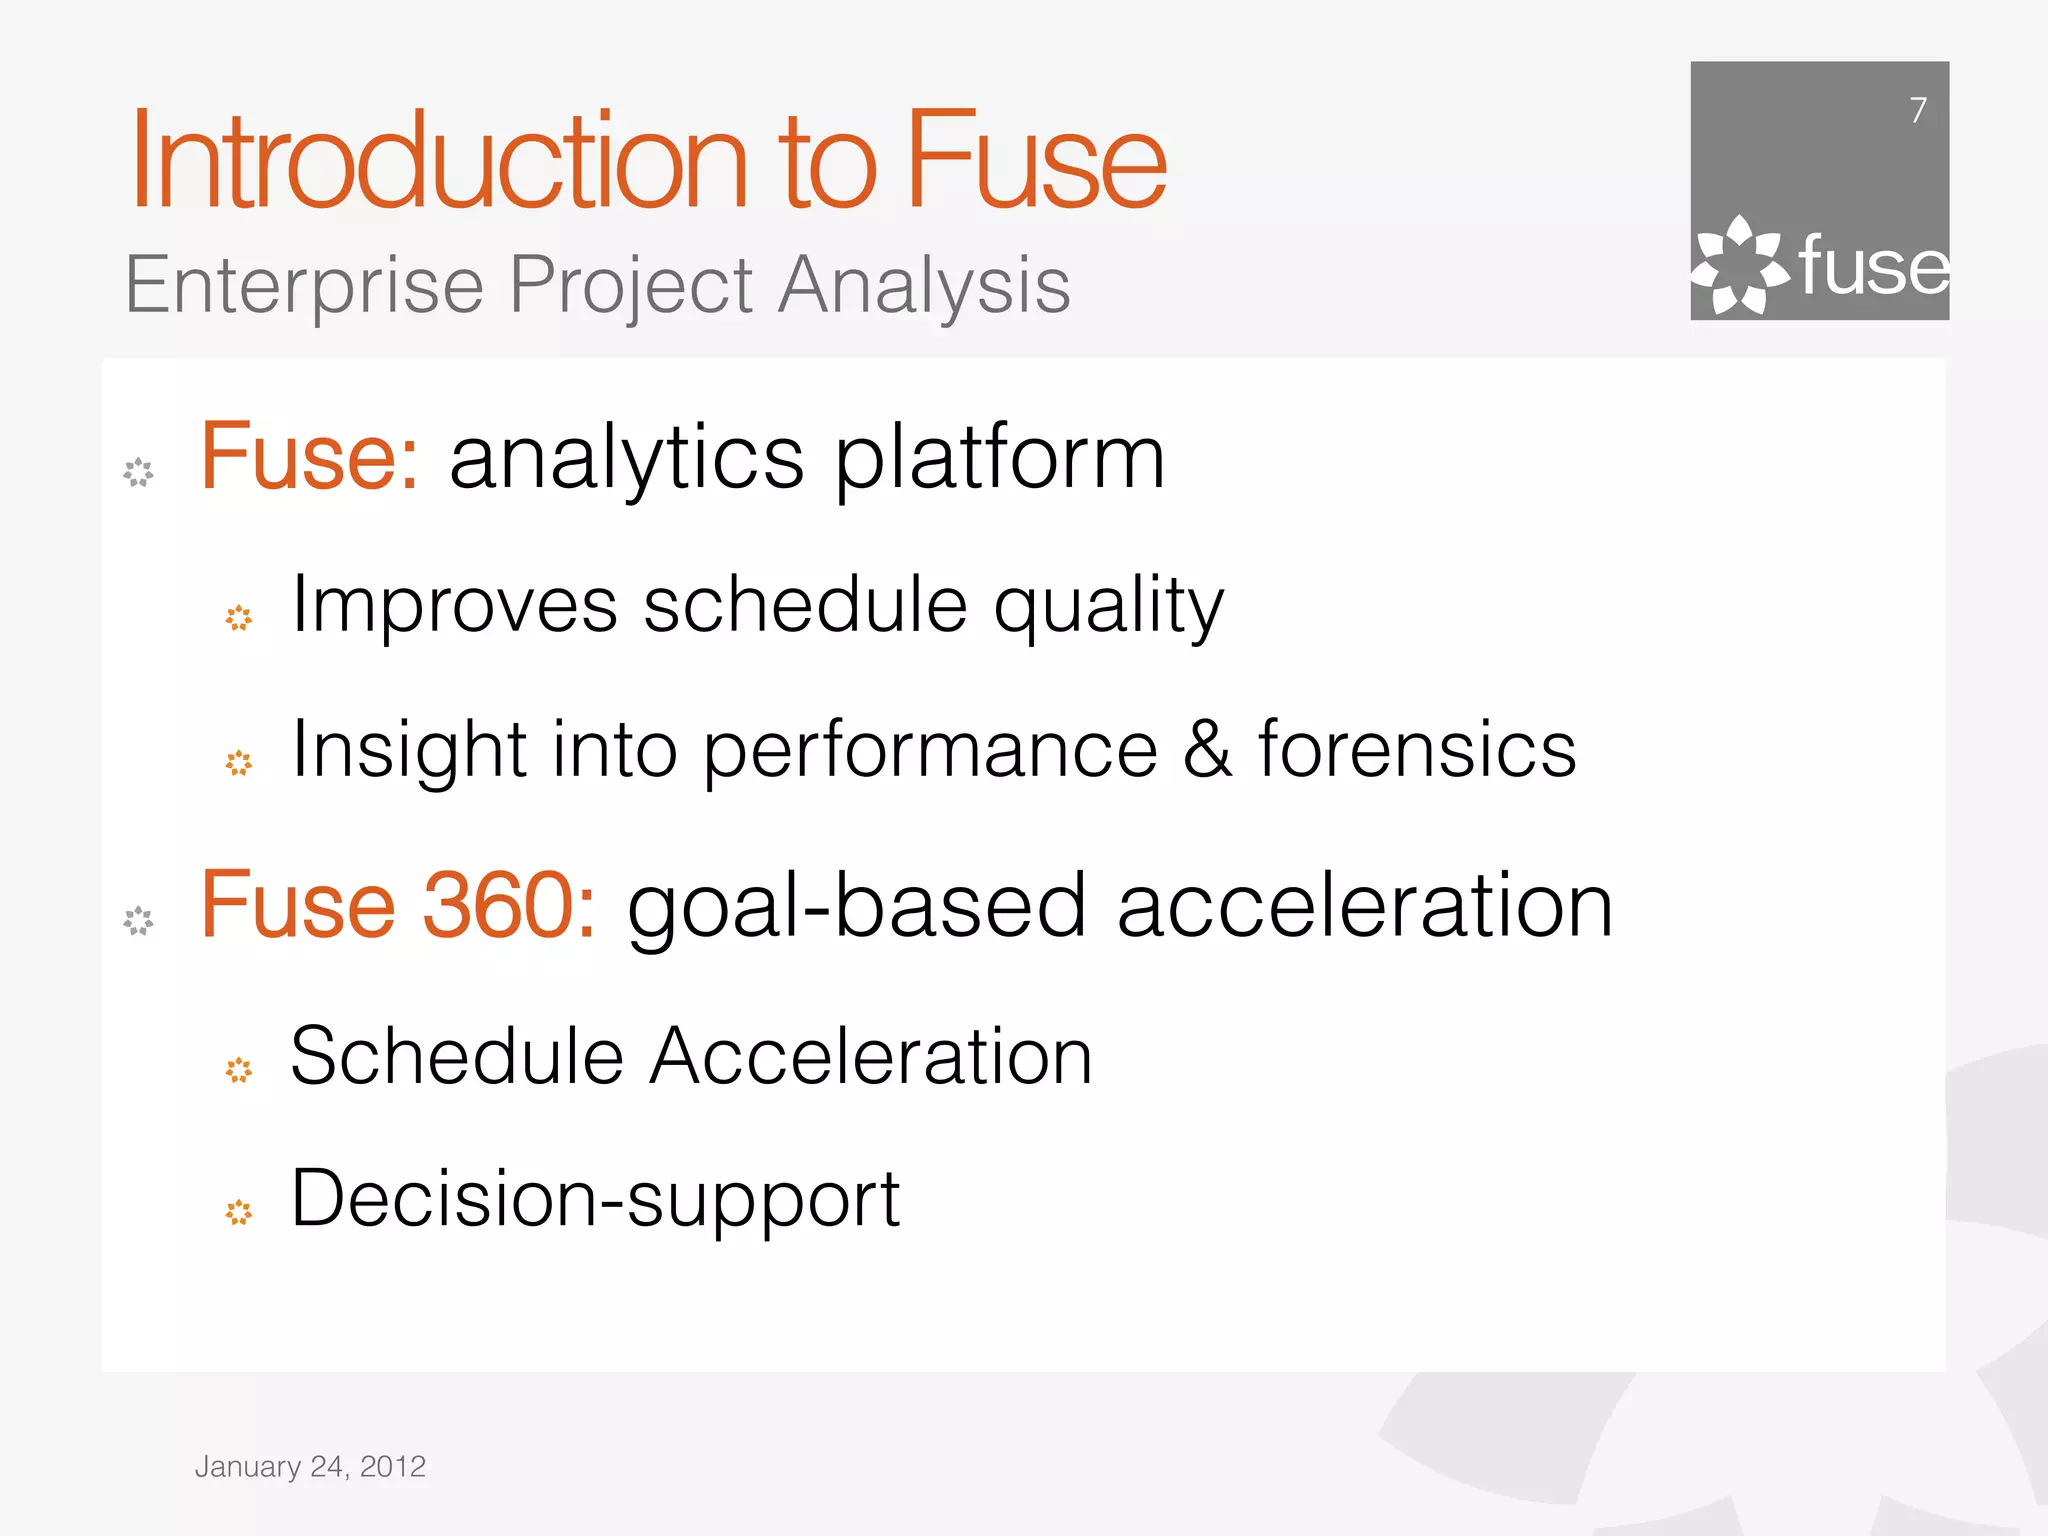
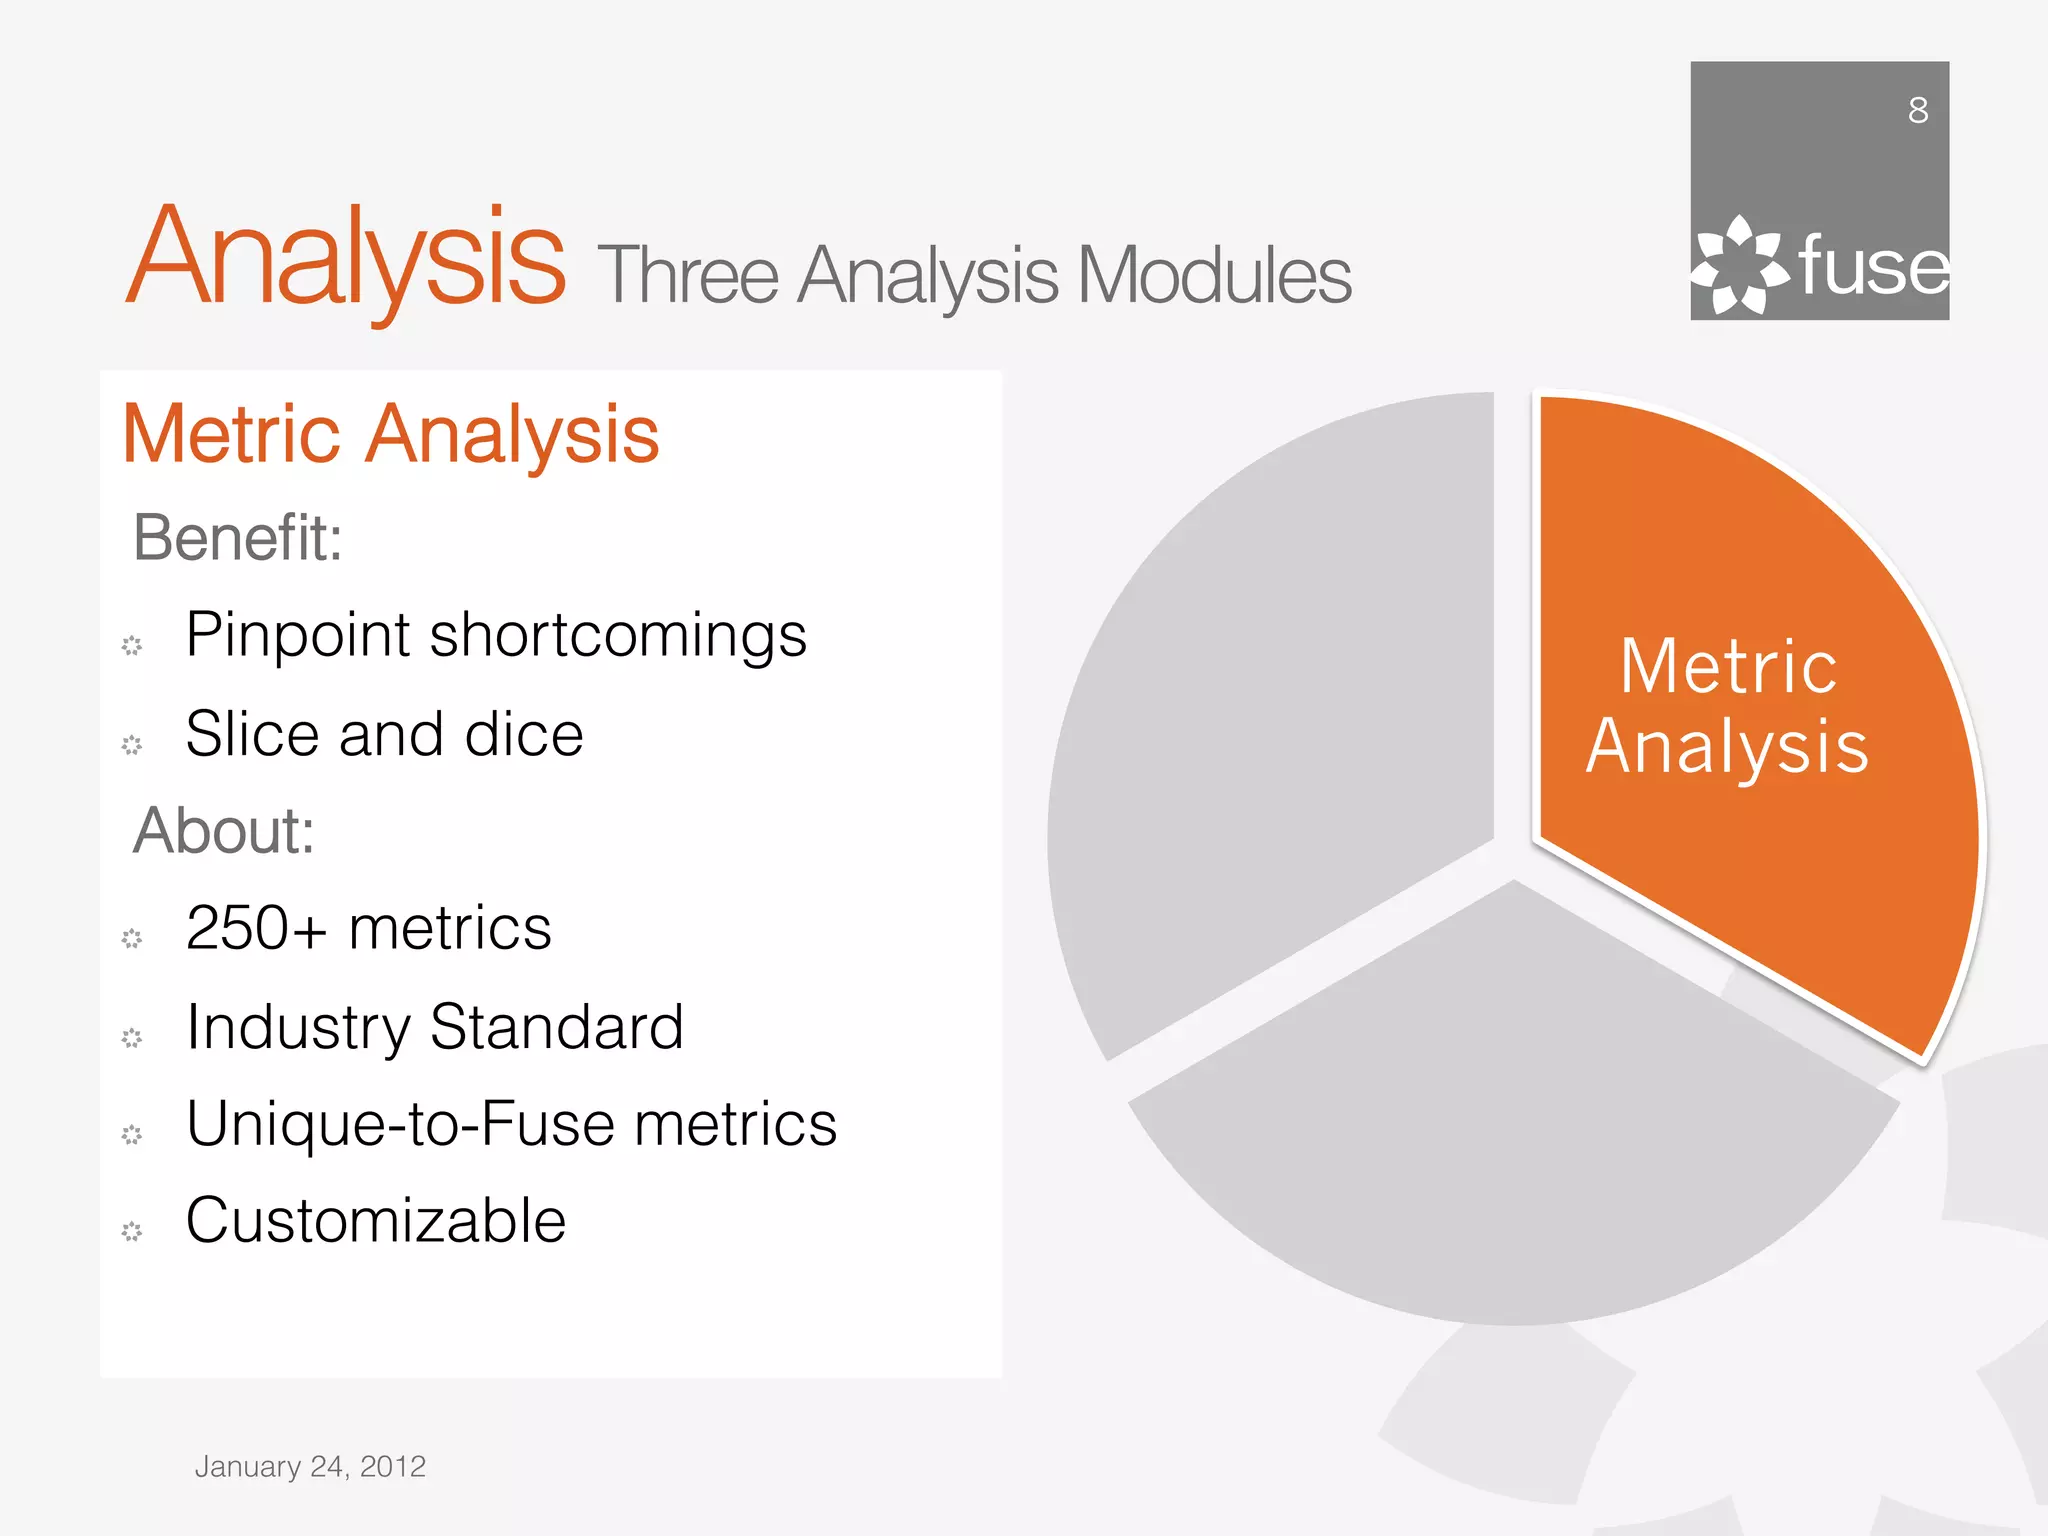
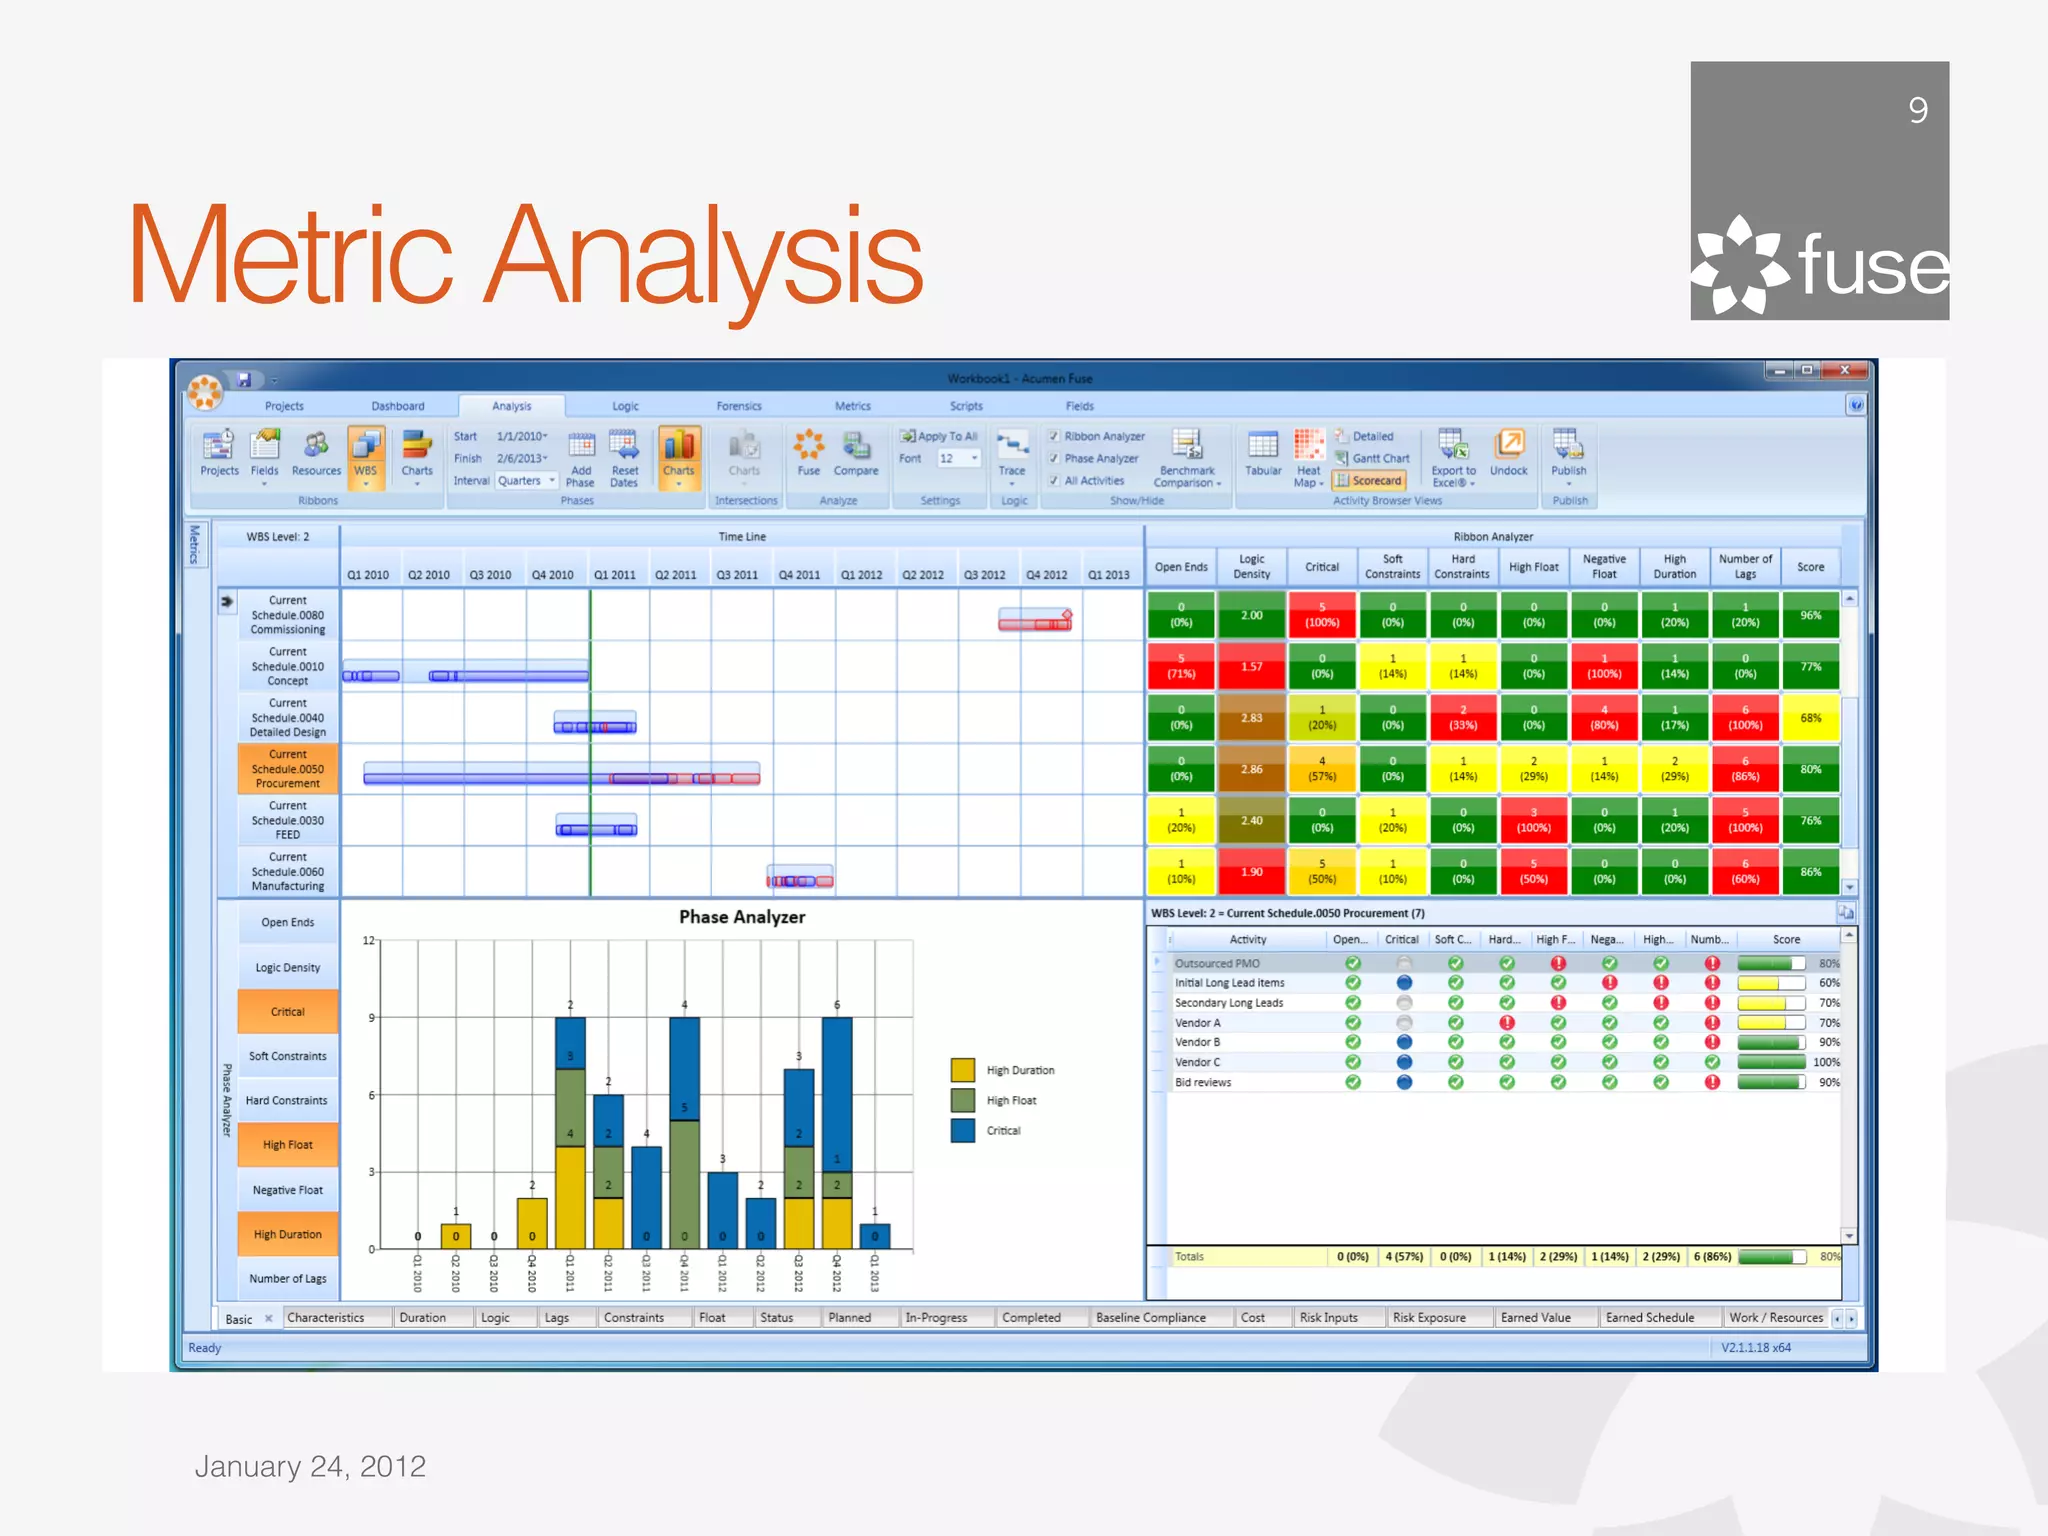
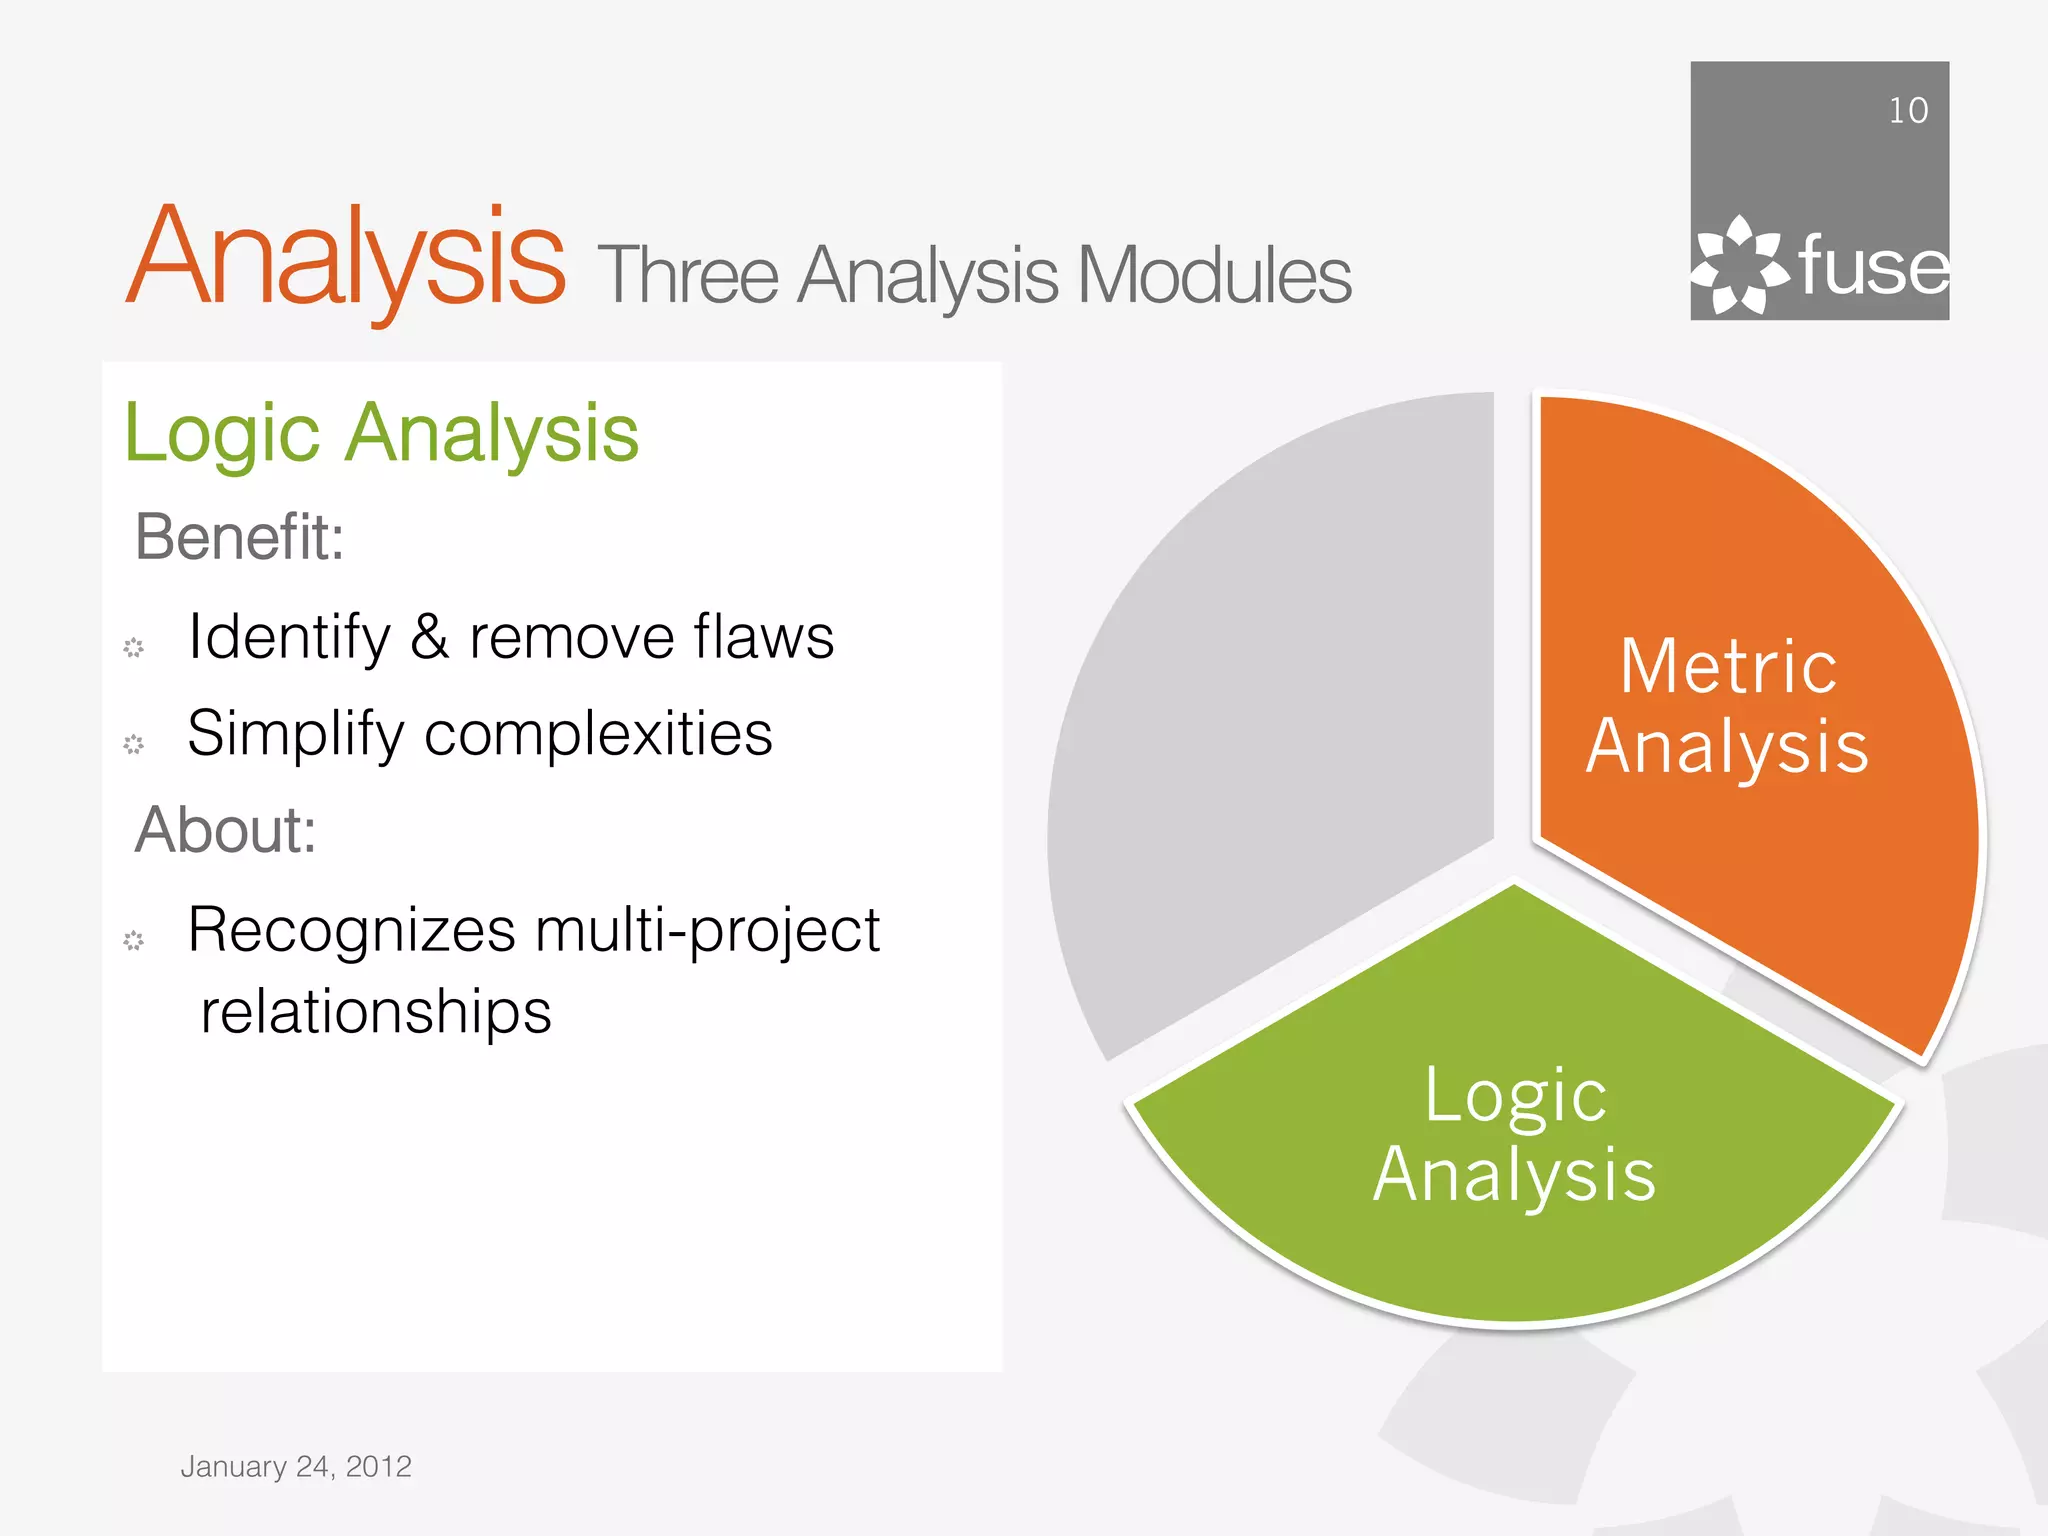
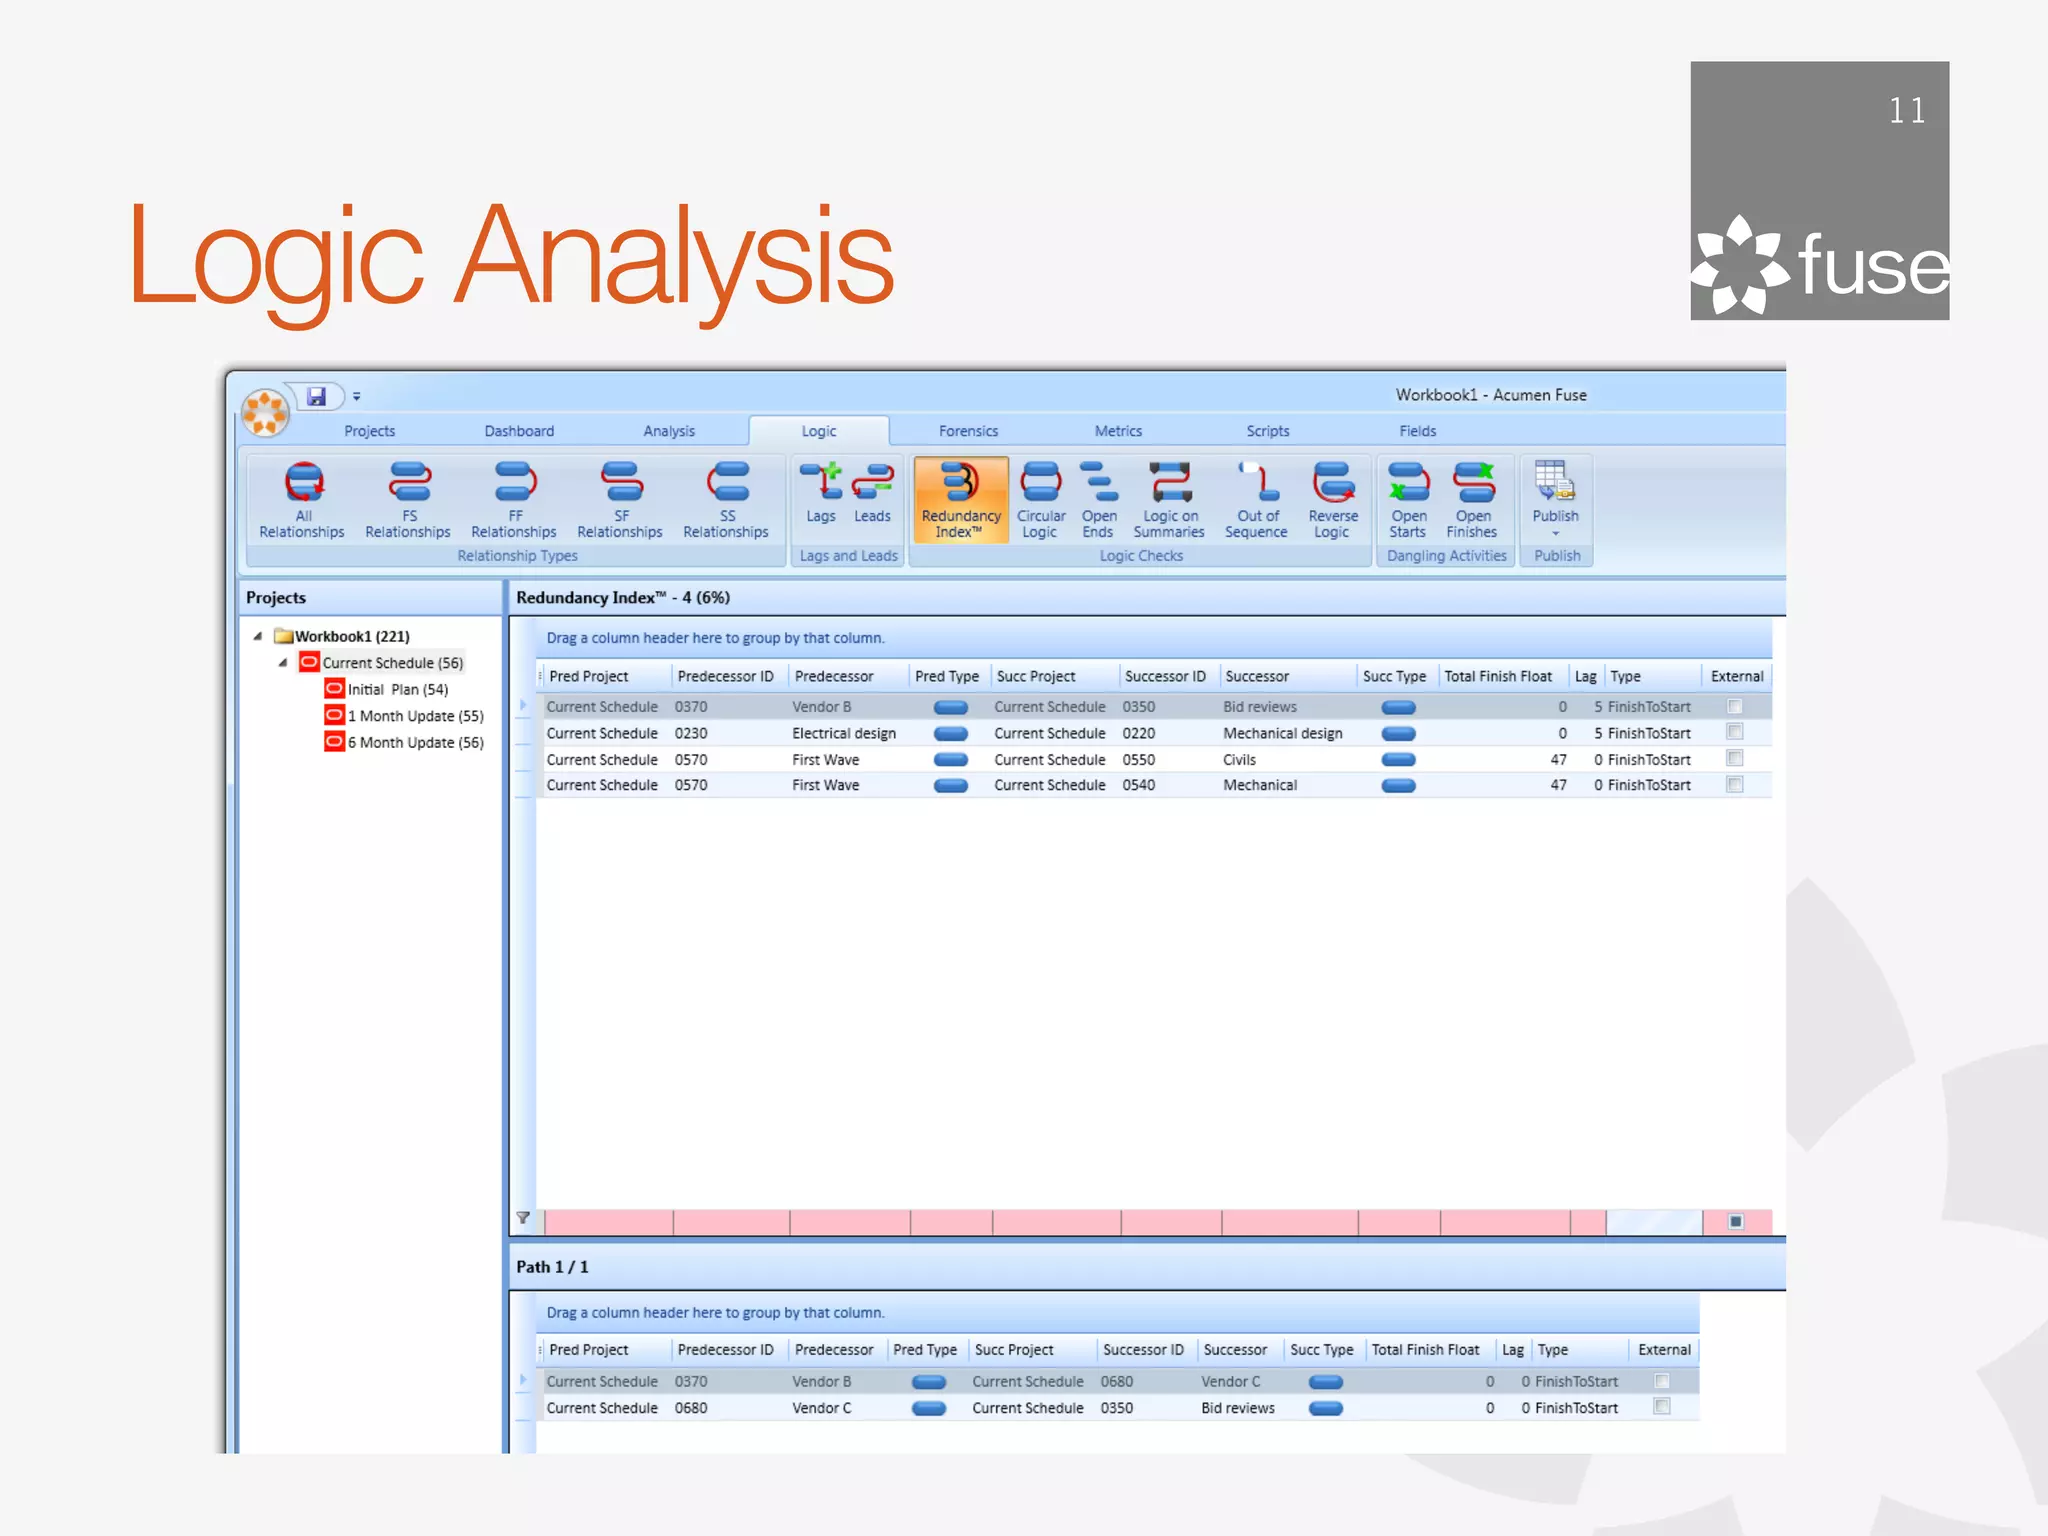
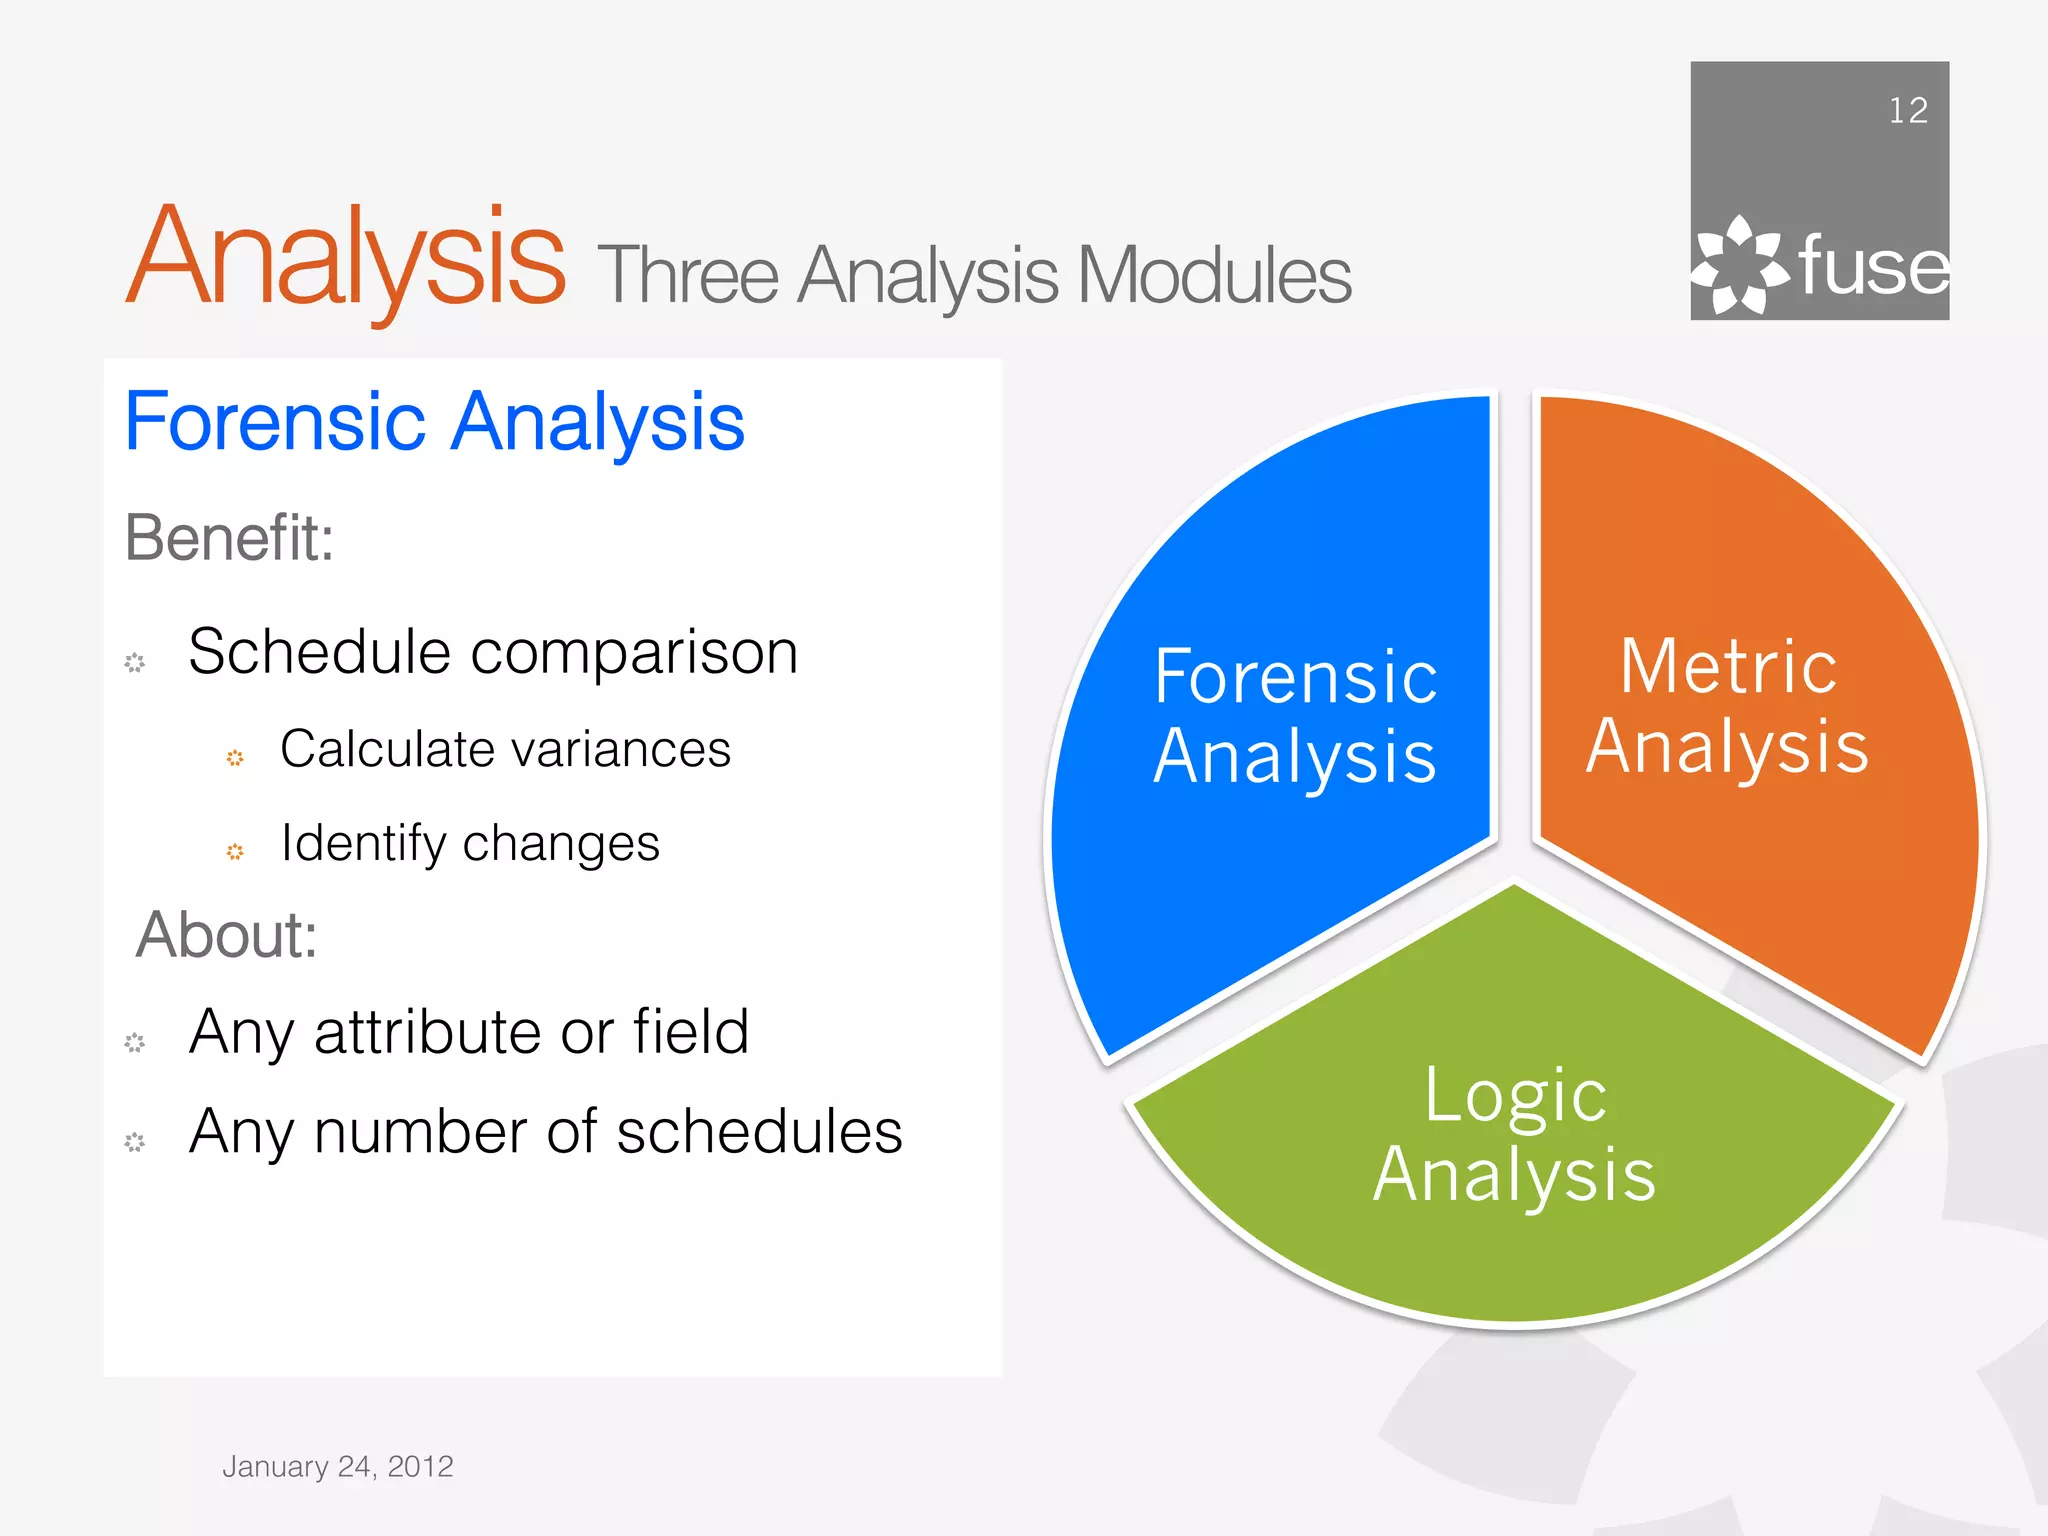
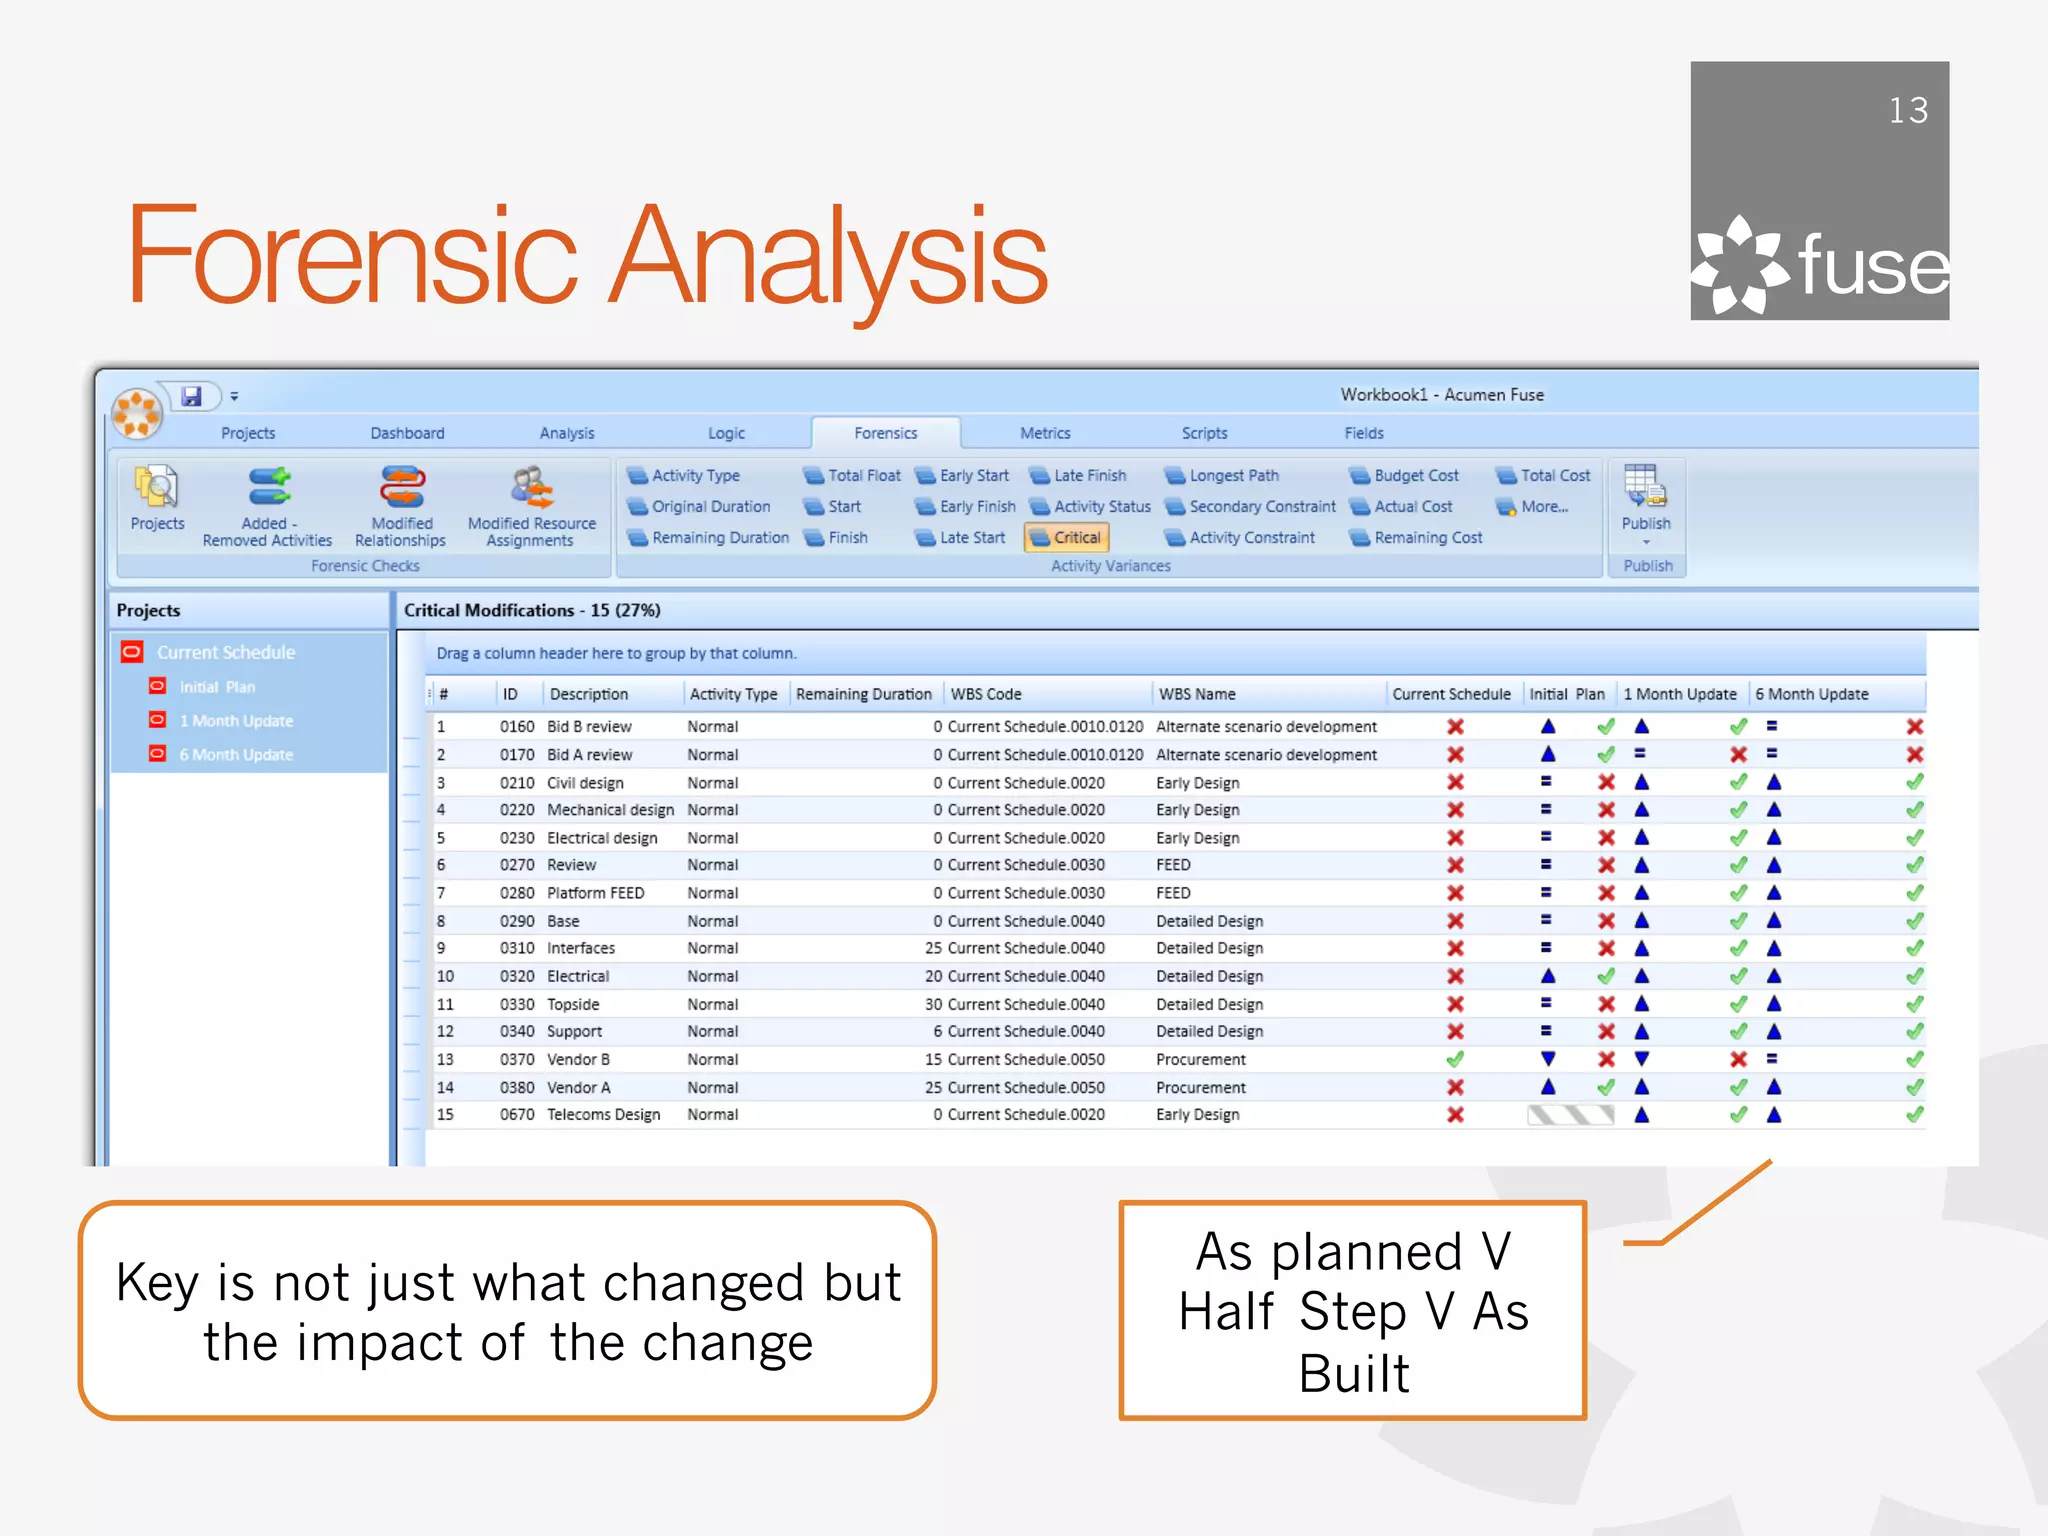
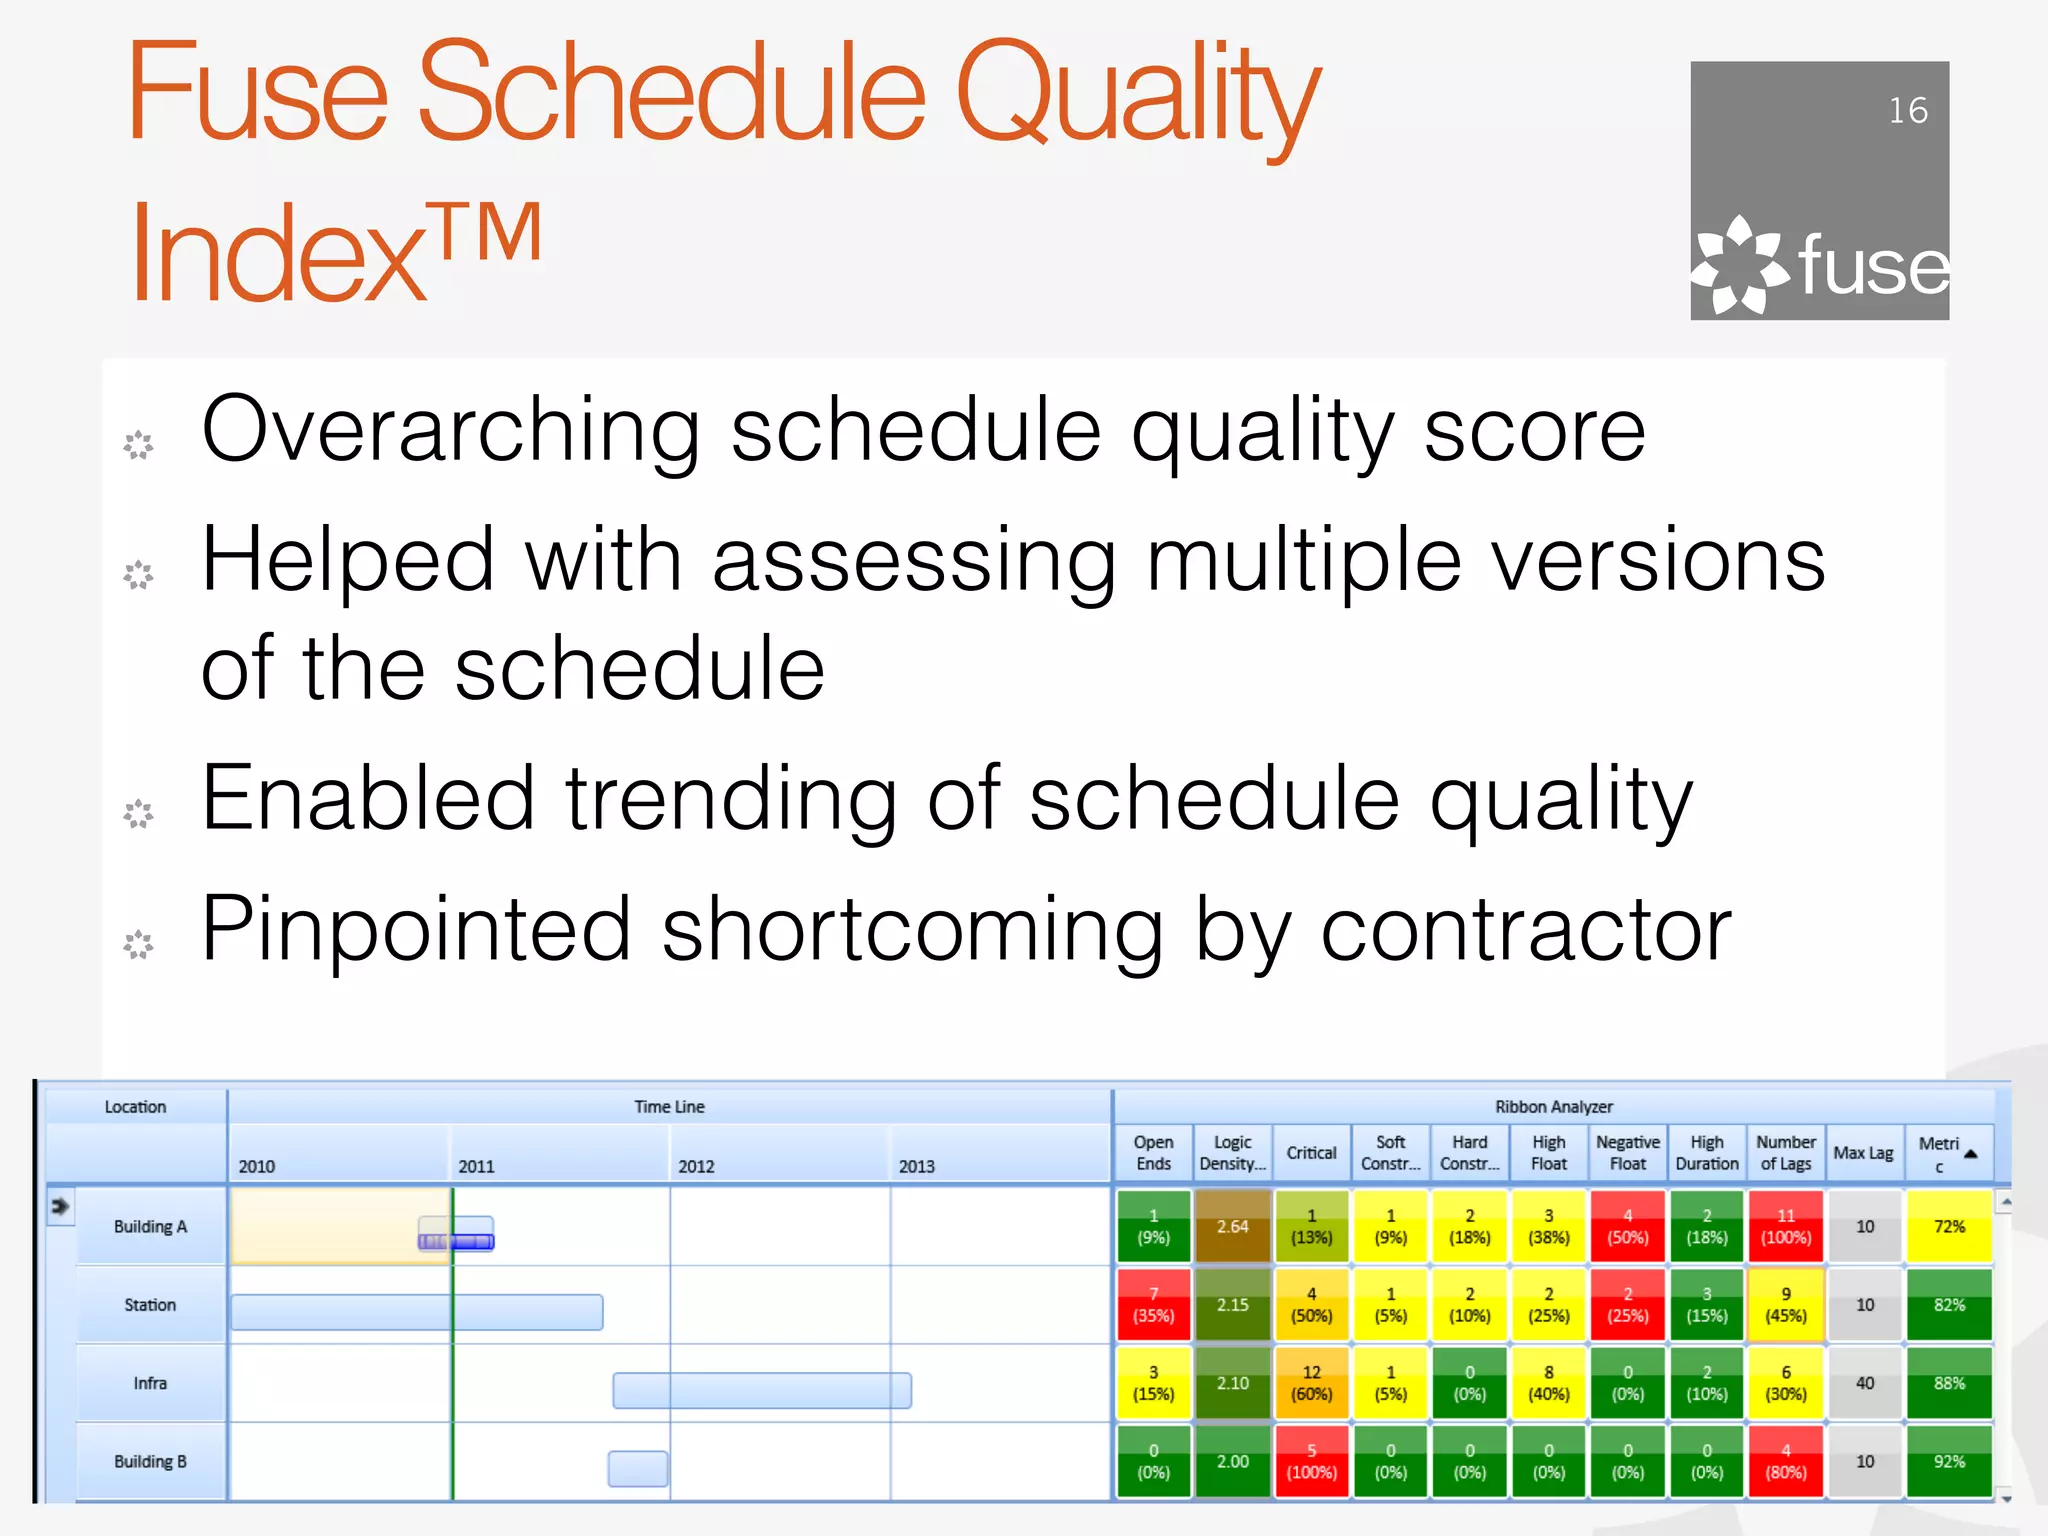
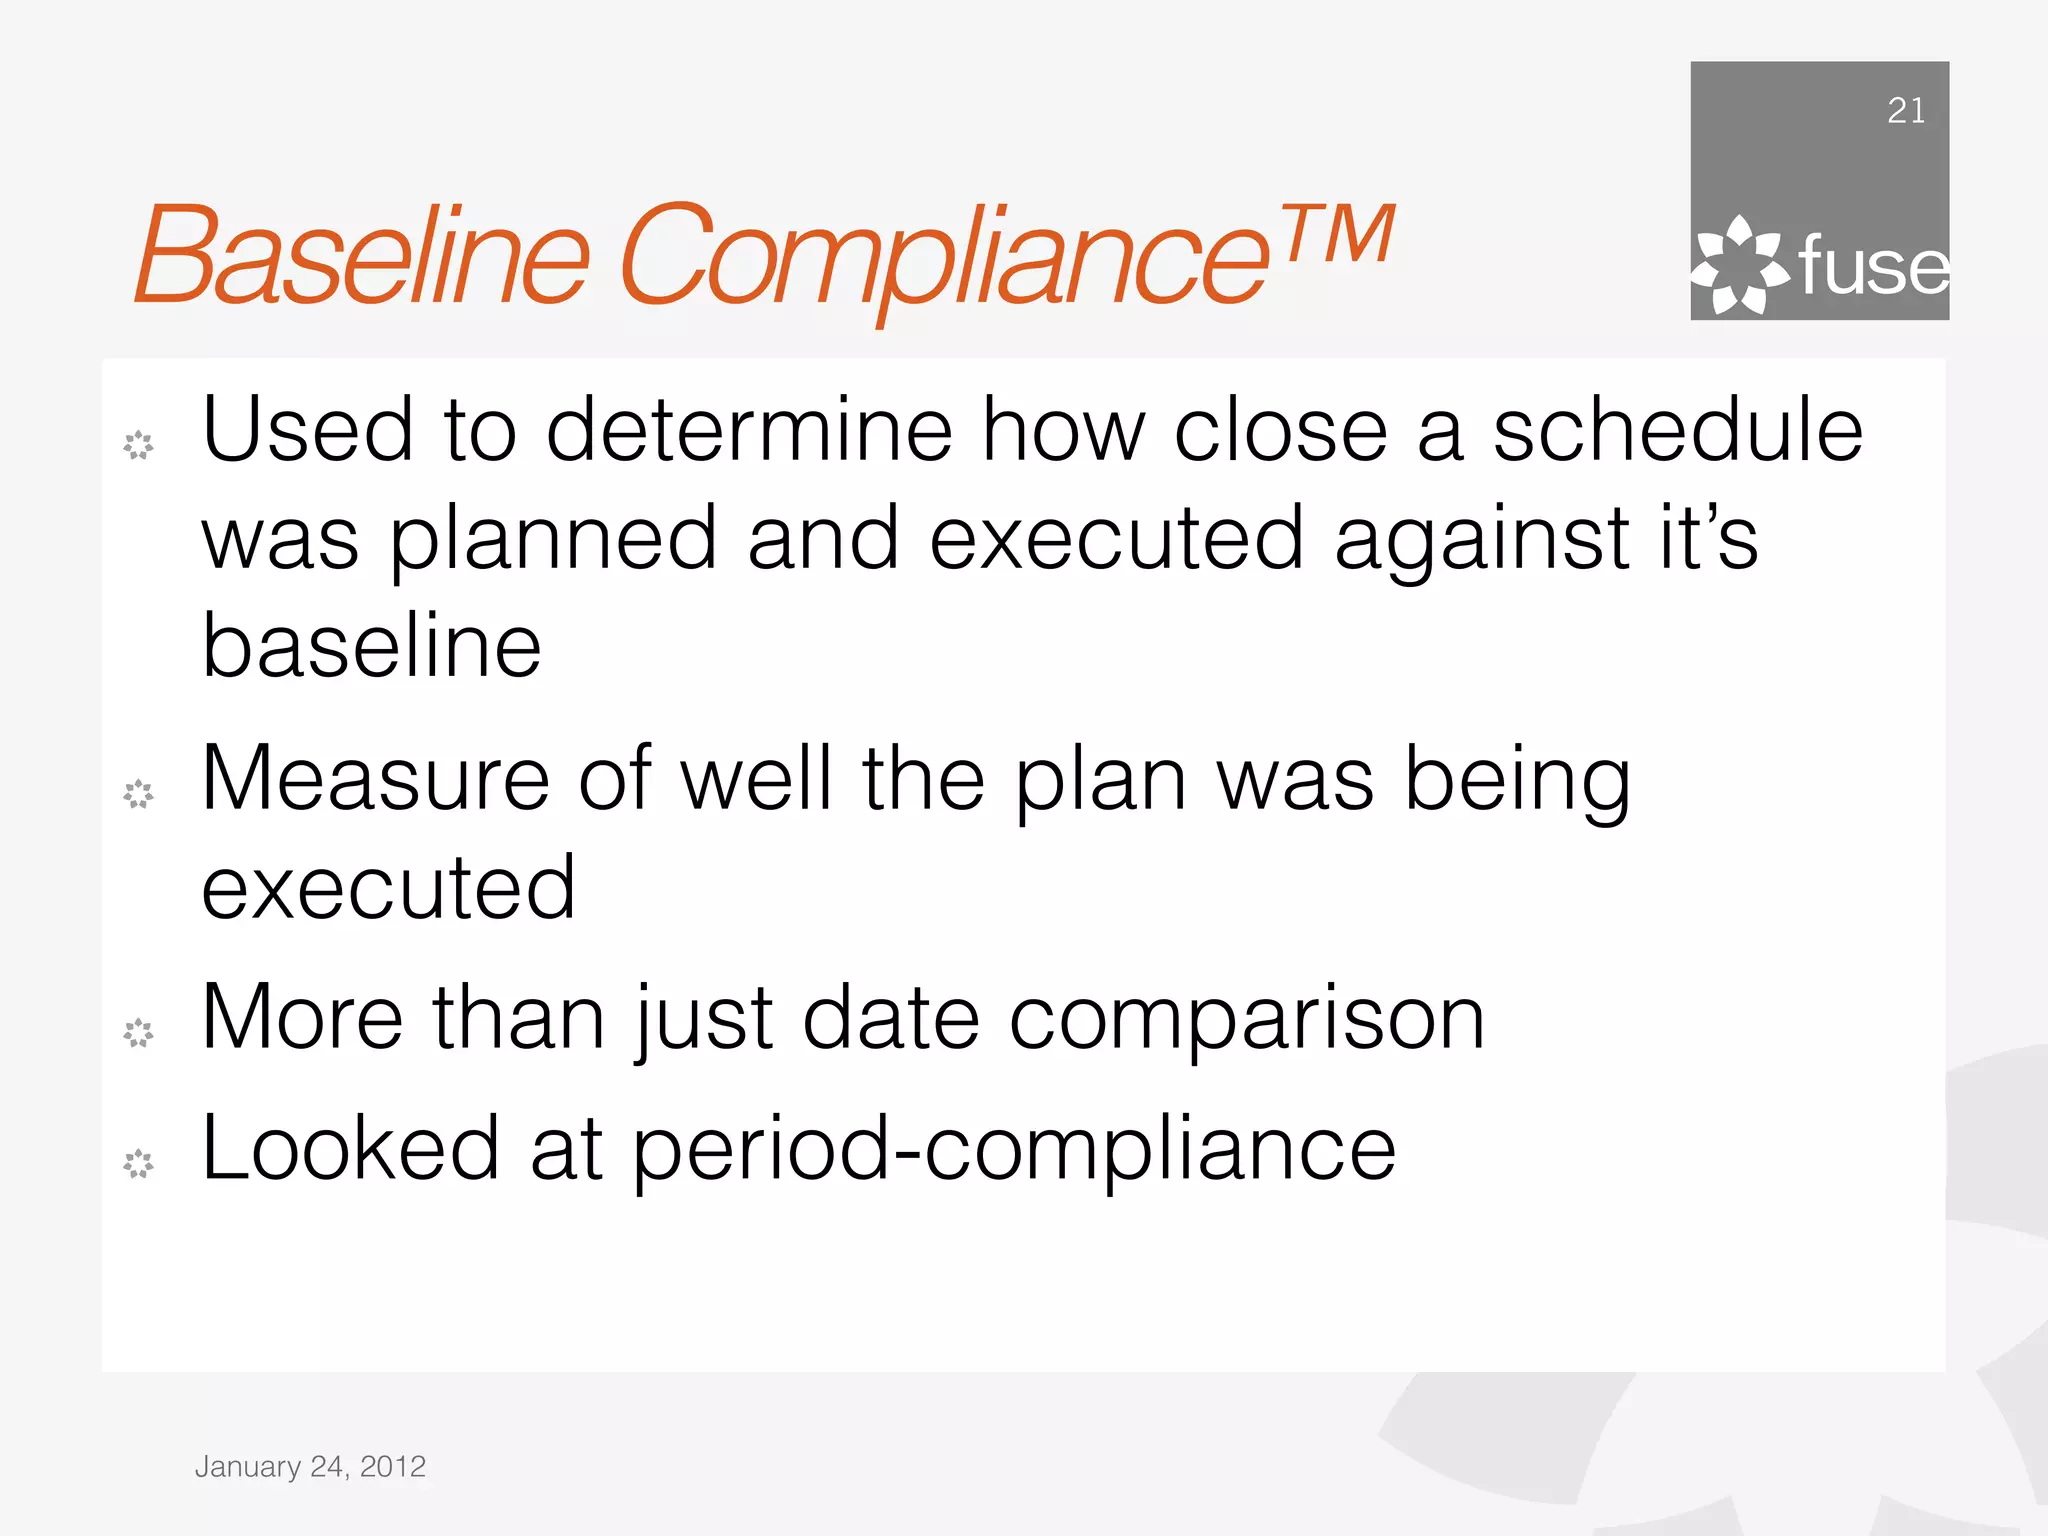
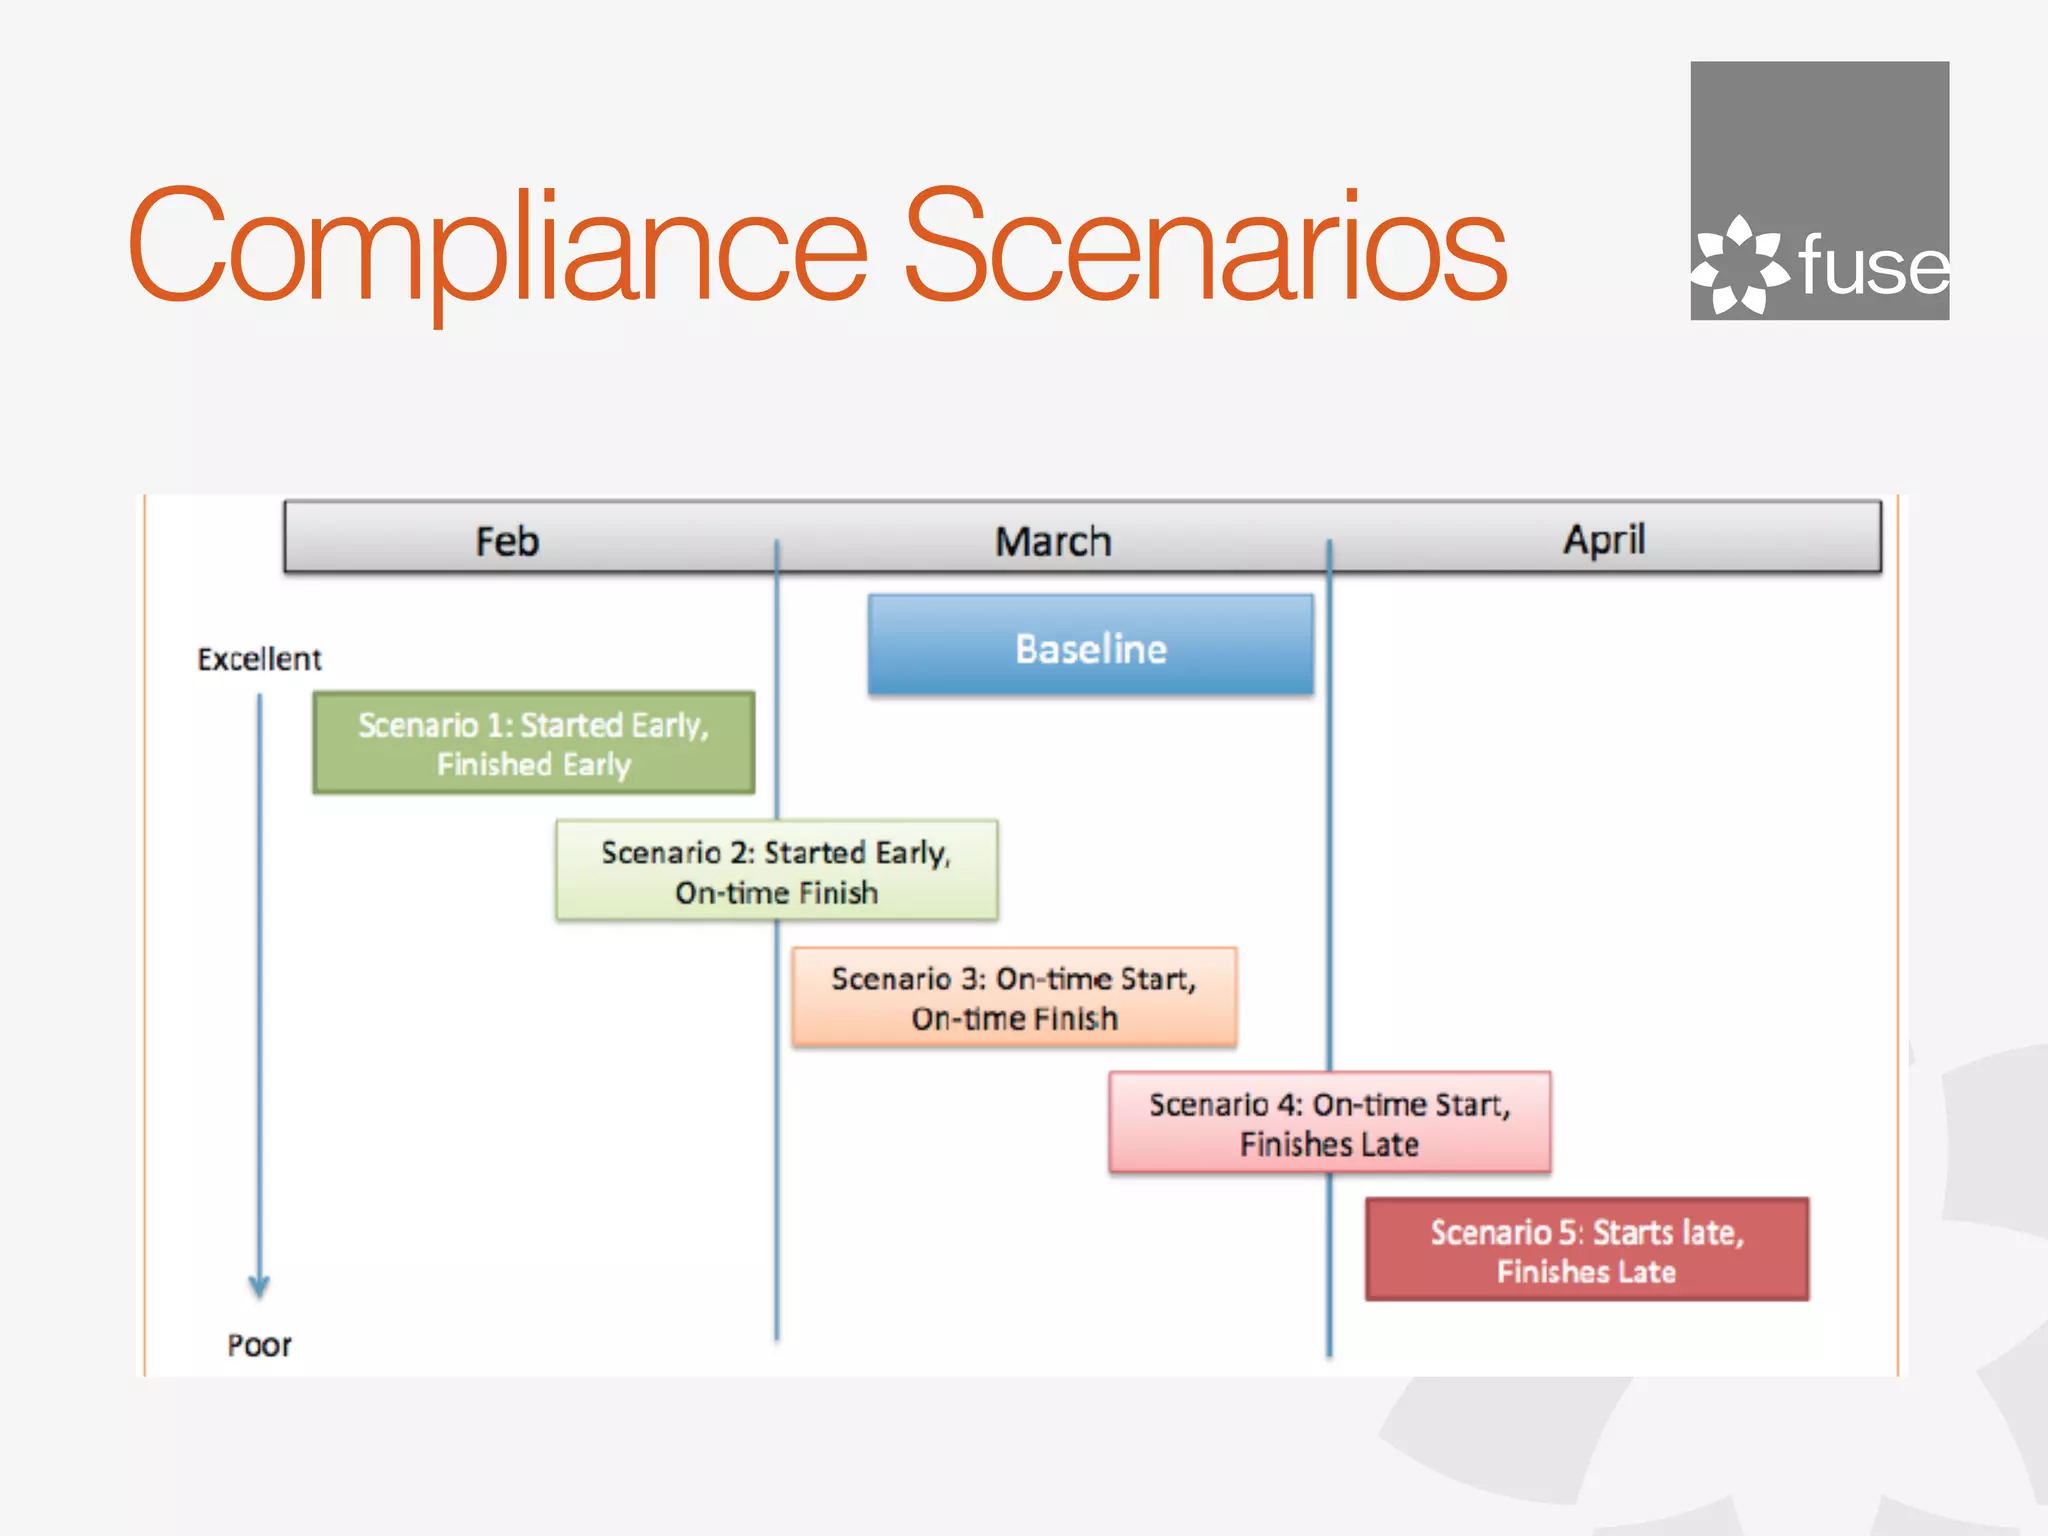
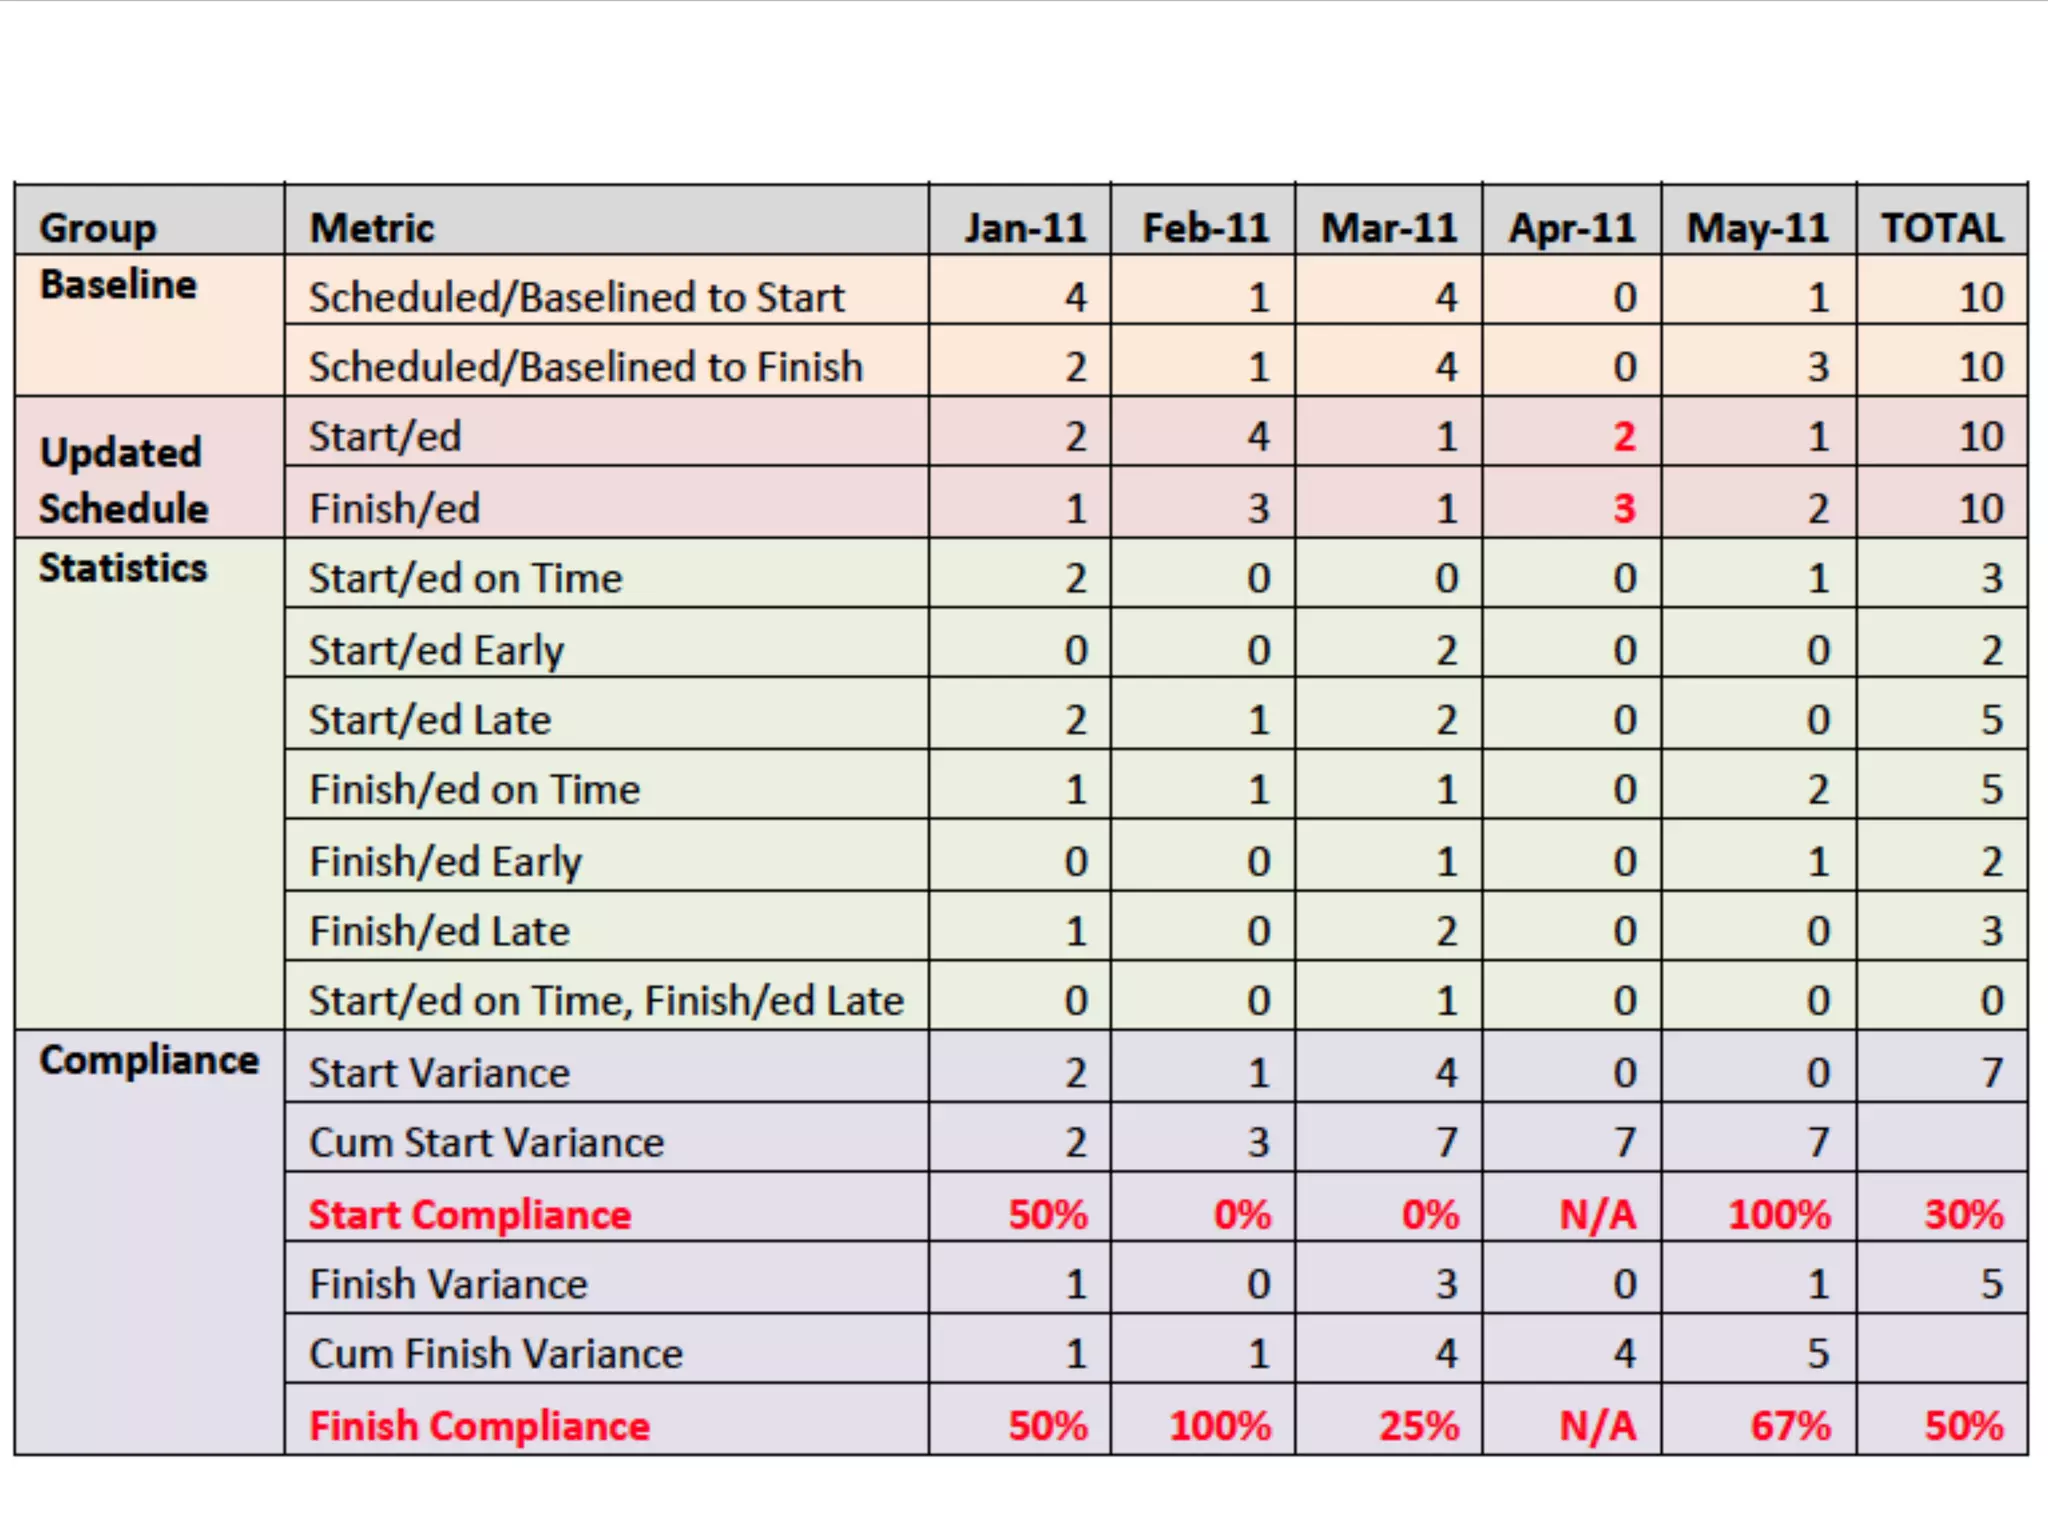
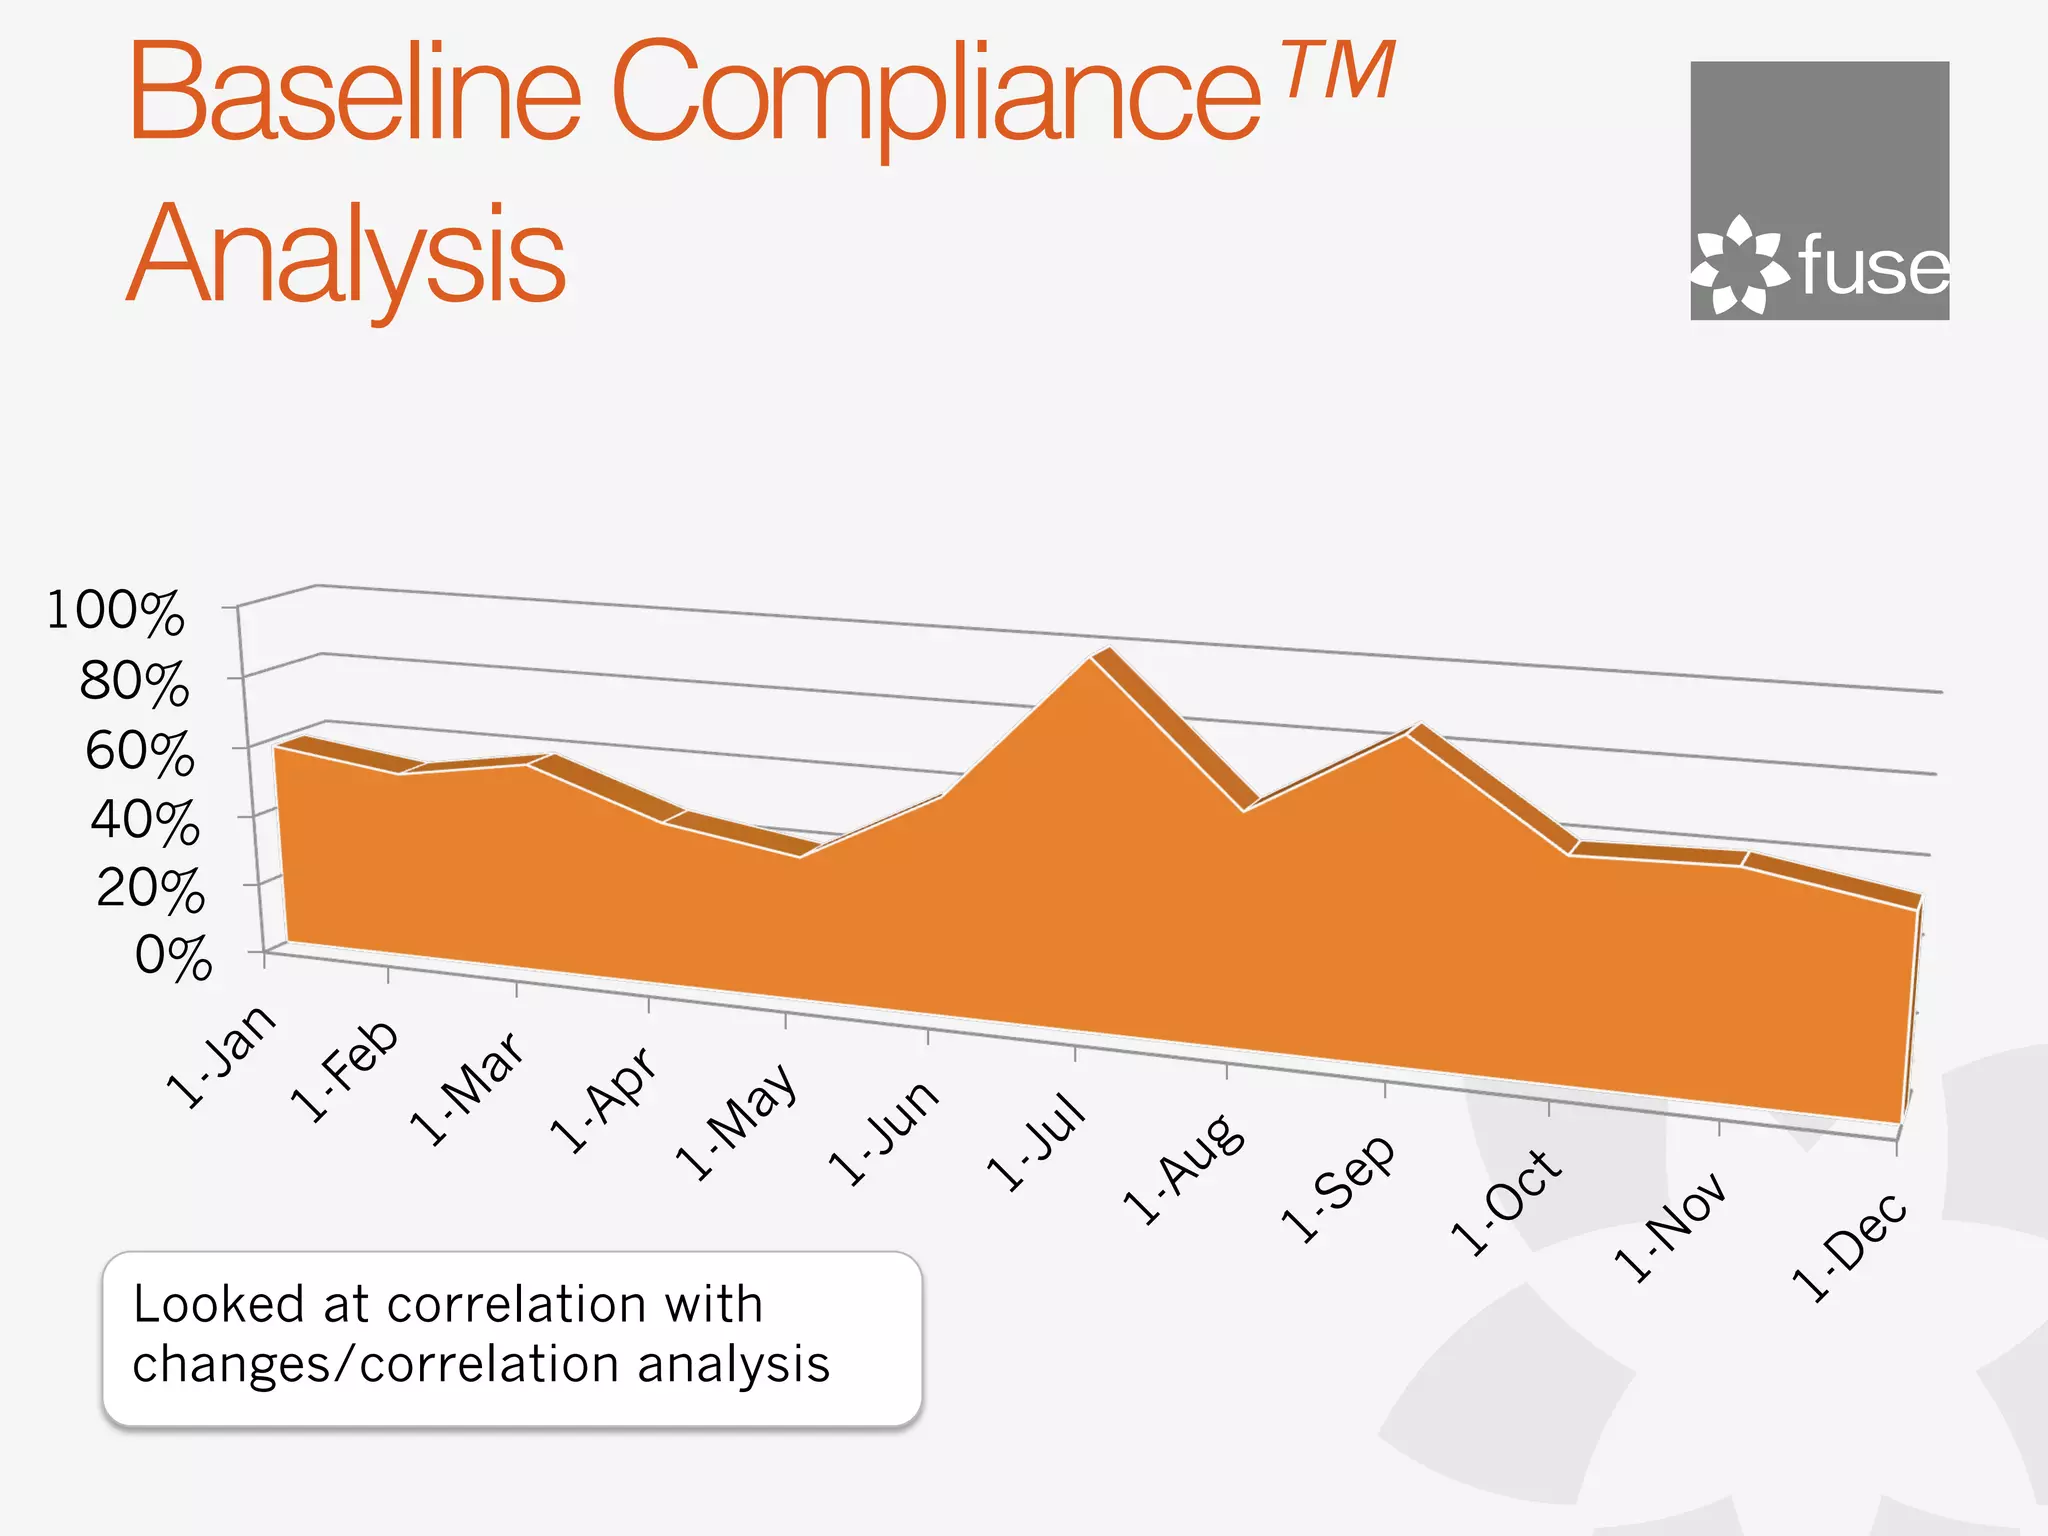


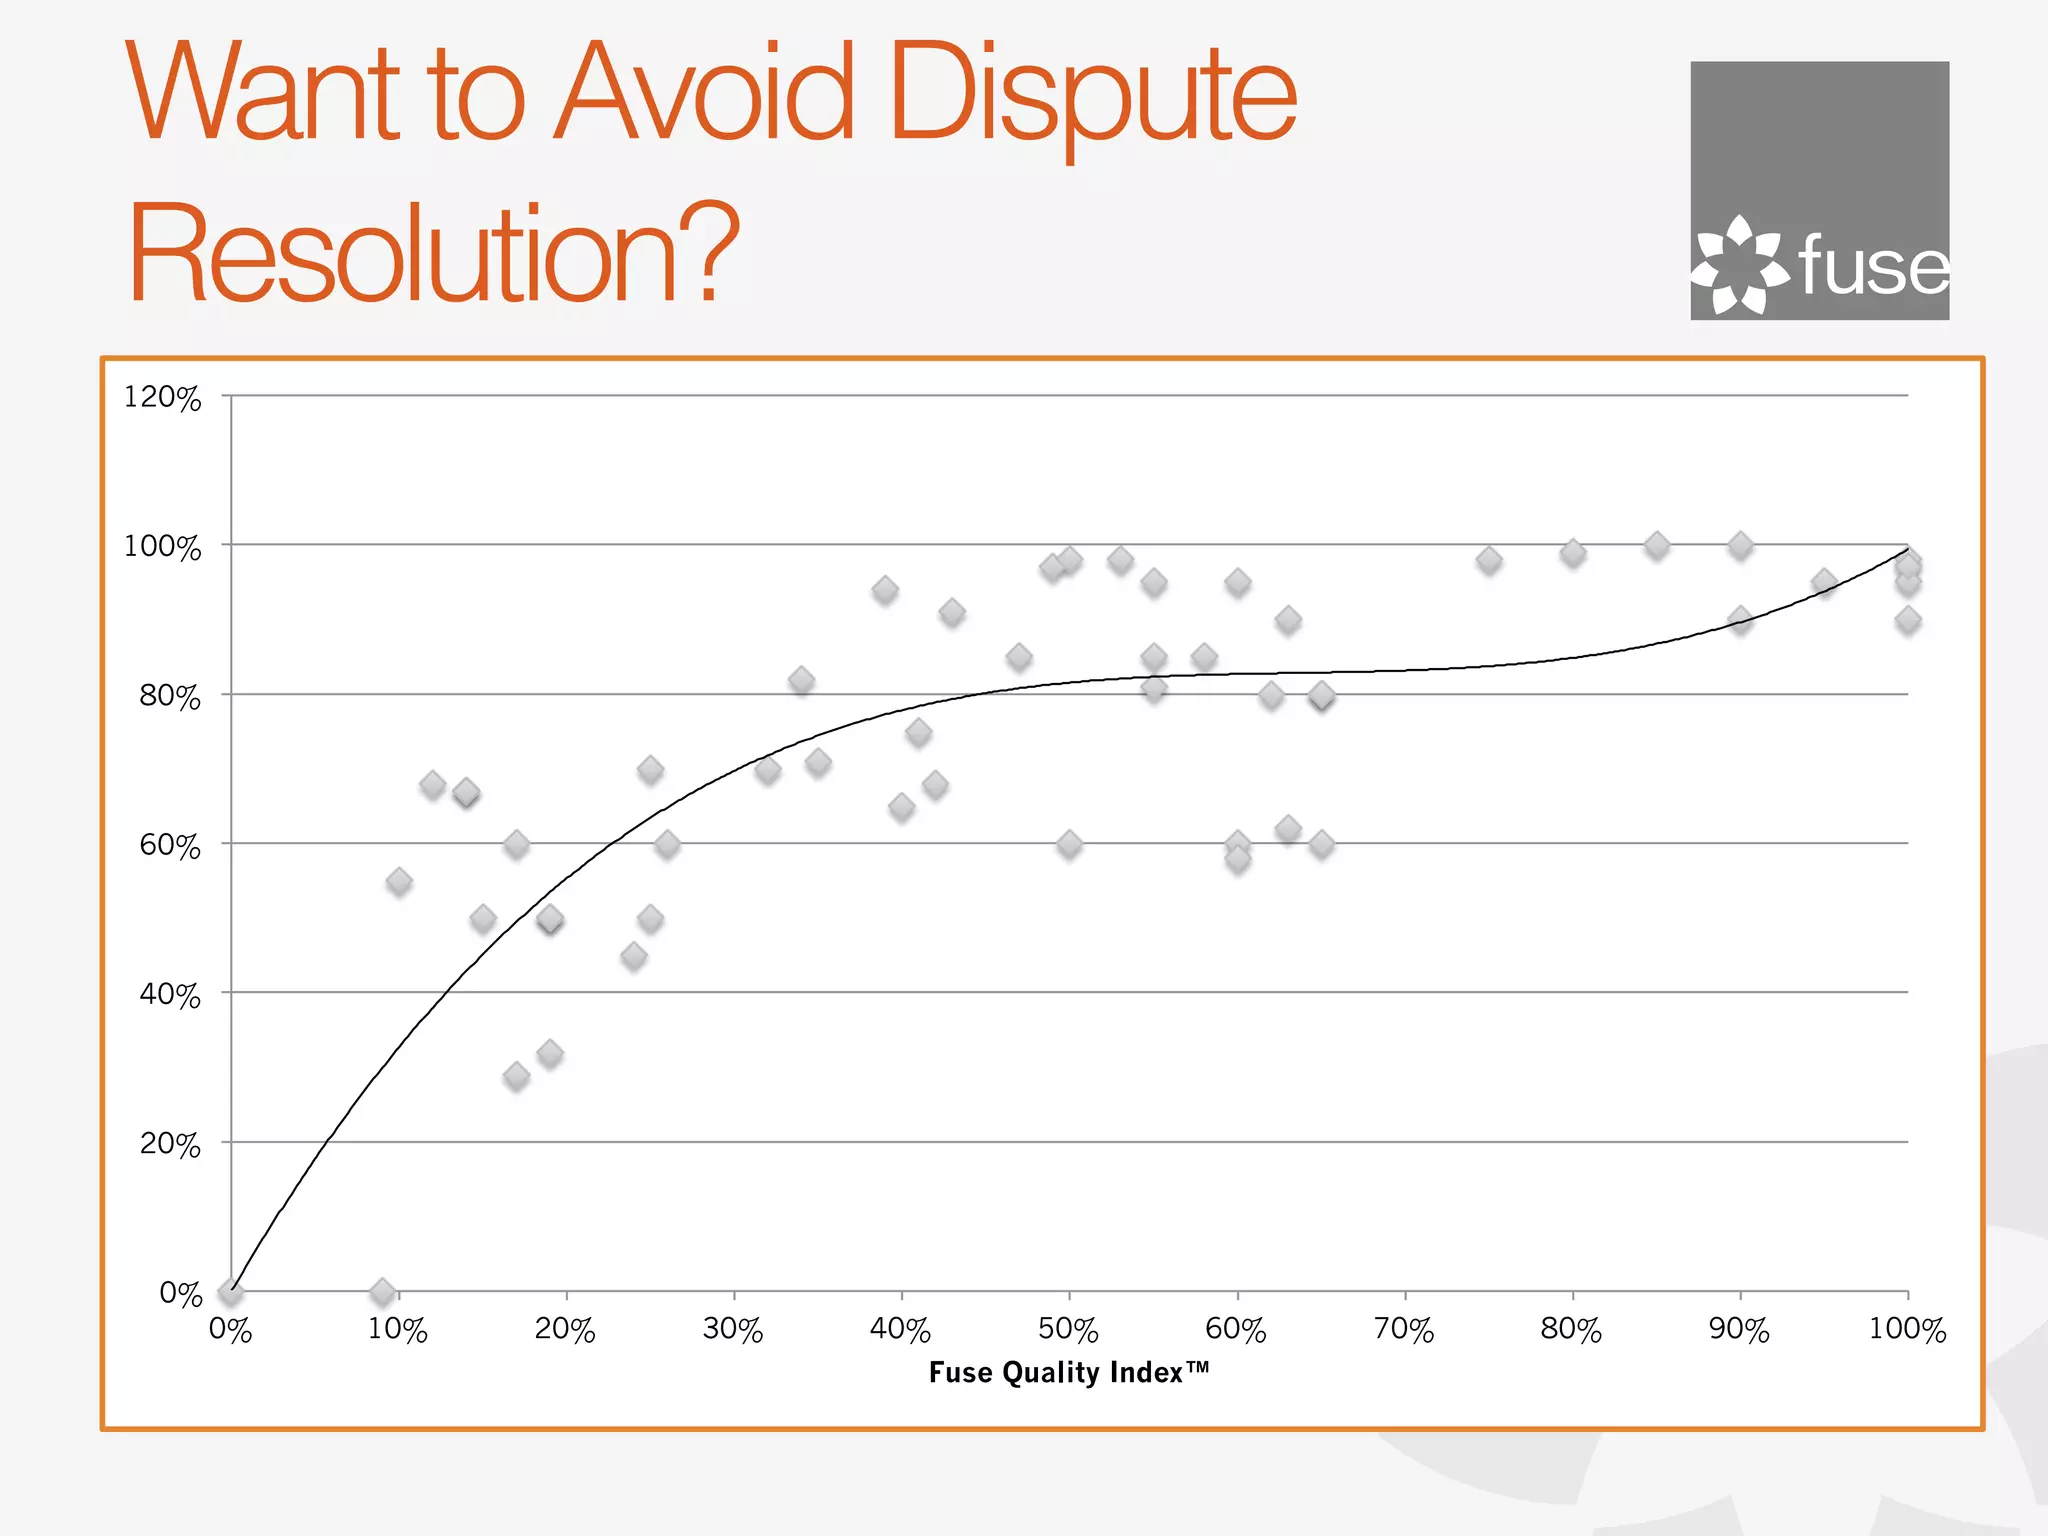

The document discusses effective dispute resolution strategies using Acumen Fuse enterprise project analysis, highlighting case studies involving owner/contractor and joint venture disputes. It emphasizes the importance of accurate project planning, risk assessment, and the tools used for forensic analysis of project schedules to diagnose issues and optimize outcomes. Acumen Fuse offers various analytics modules tailored to improve project execution through enhanced scheduling and real-time insights into performance metrics.


![Coded Agents – with UiPath SDK + LangGraph [Virtual Hands-on Workshop]](https://cdn.slidesharecdn.com/ss_thumbnails/codedagentsdeck-251215155422-5497c599-thumbnail.jpg?width=640&height=640&fit=bounds)


