
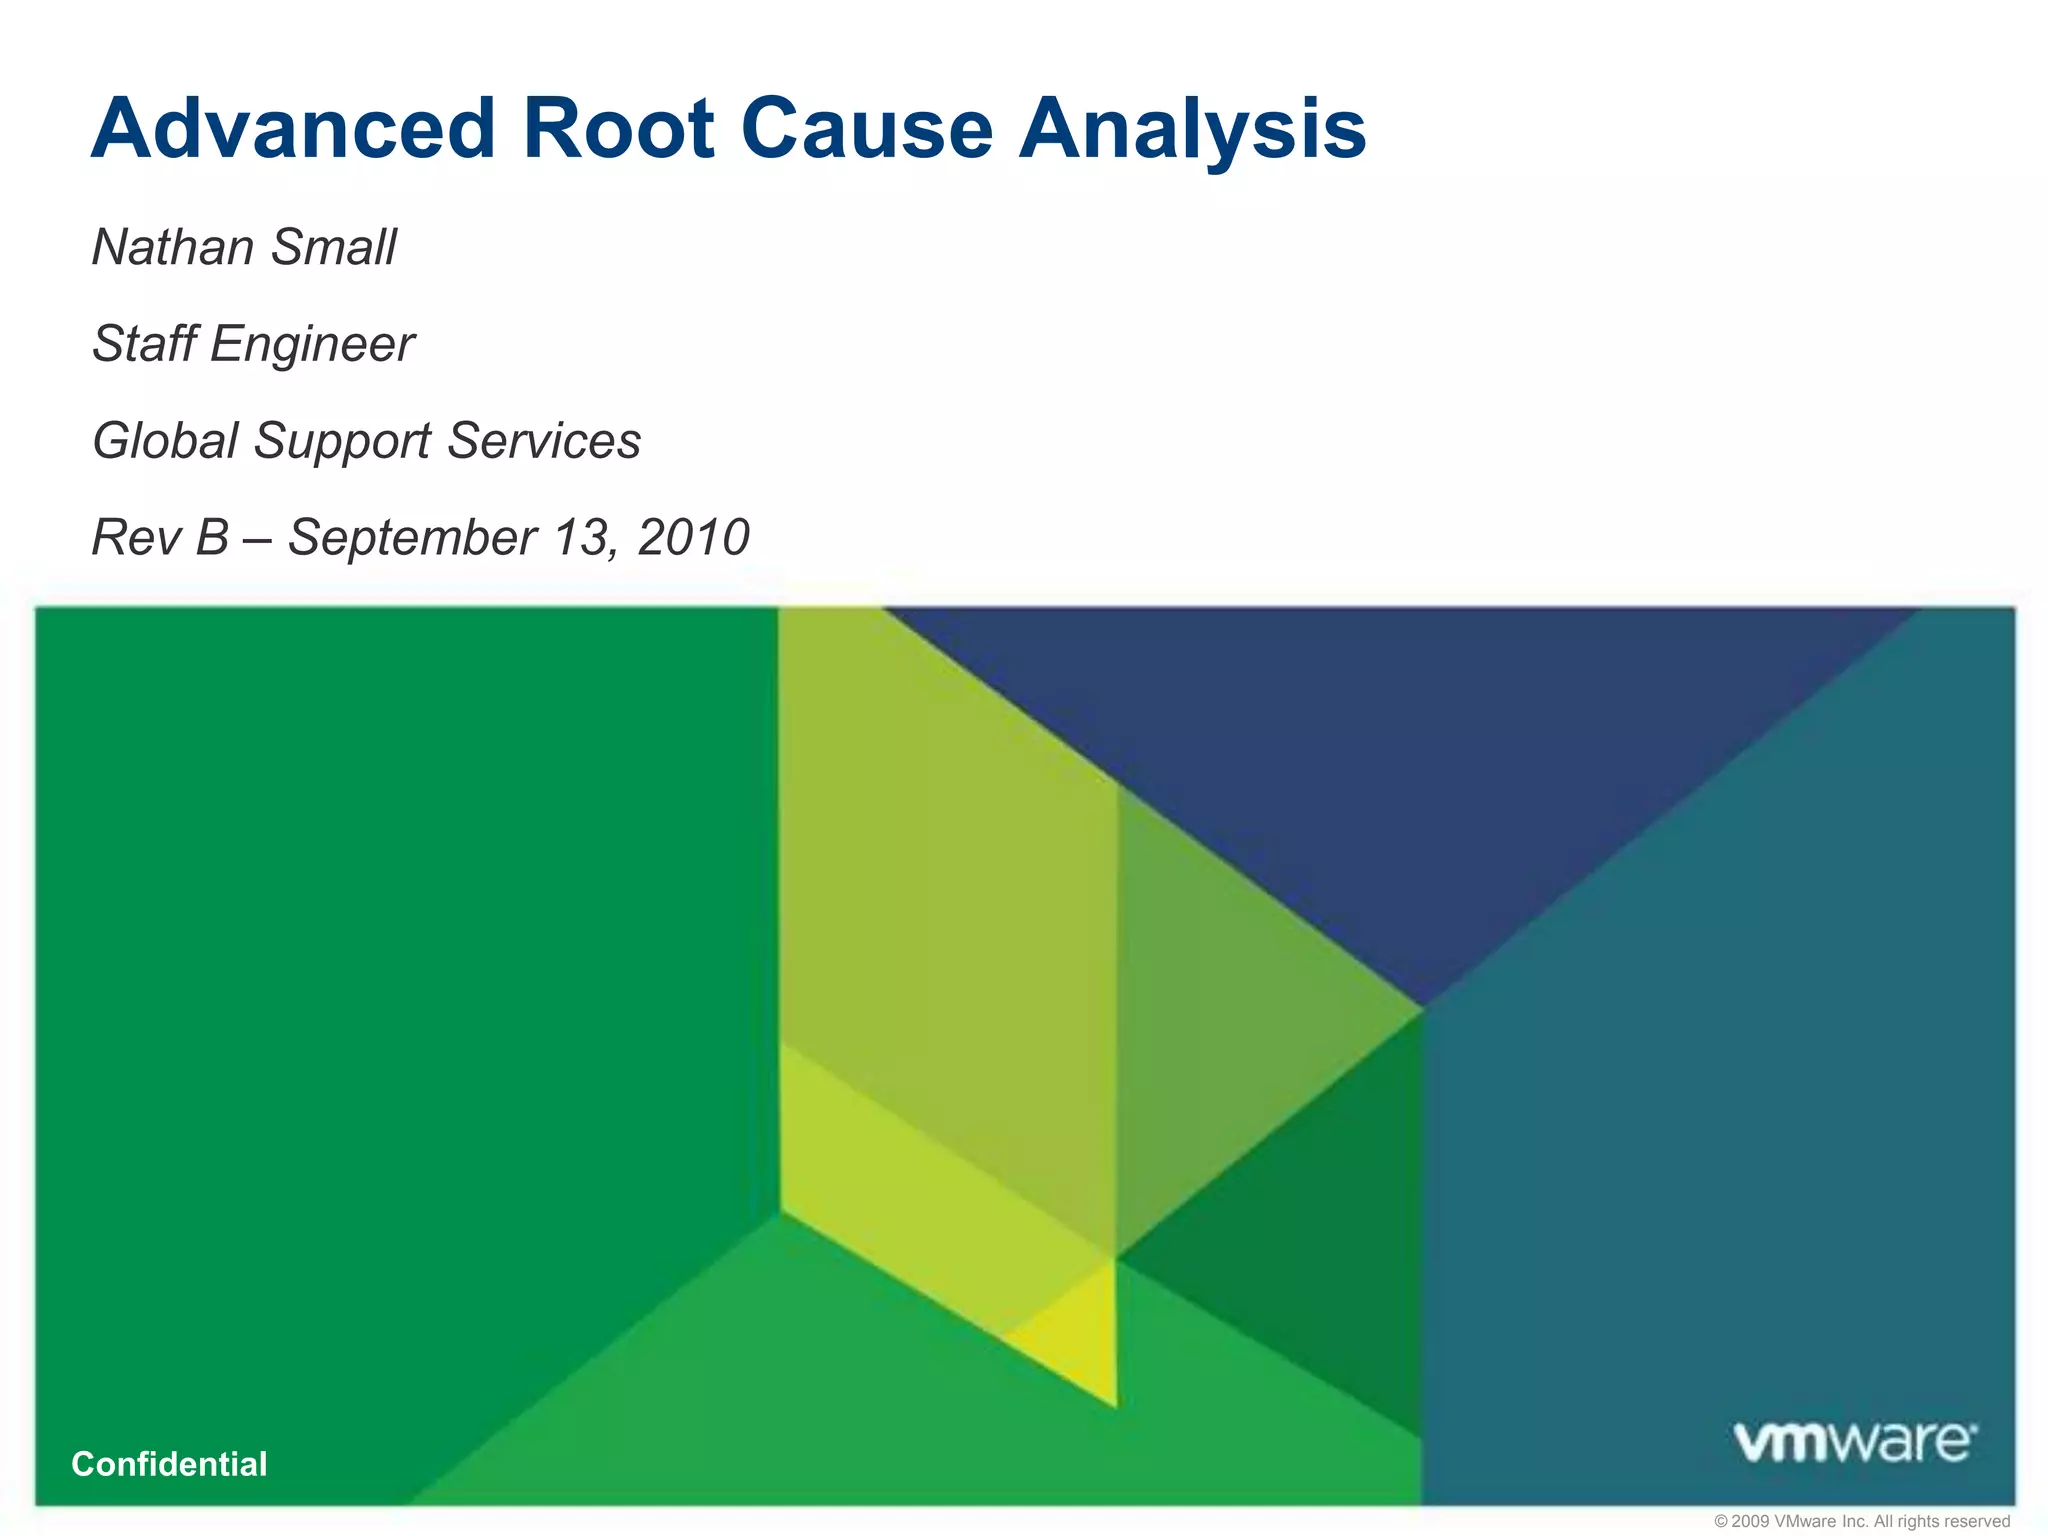
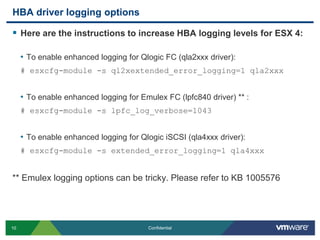
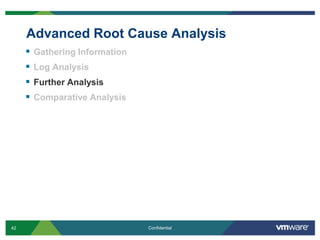
![HBA driver logging optionsA review of /proc/scsi/qla2xxx/X:QLogic PCI to Fibre Channel Host Adapter for QLE2460: Firmware version 4.04.09 [IP] [Multi-ID] [84XX] , Driver version 8.02.01-k1-vmw39BIOS version 2.02FCODE version 2.00EFI version 2.00Flash FW version 4.03.01ISP: ISP2432Login retry count = 008Execution throttle = 2048ZIO mode = 0x6, ZIO timer = 1Commands retried with dropped frame(s) = 40541](https://image.slidesharecdn.com/advancedrca-110314163040-phpapp02/85/Advanced-Root-Cause-Analysis-9-320.jpg)
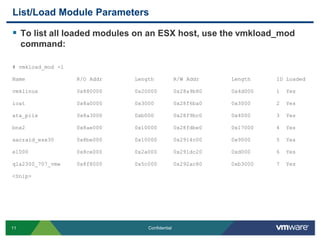
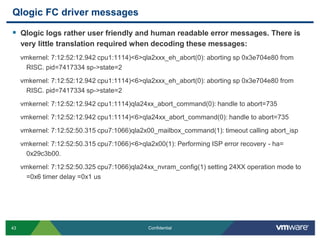
![List/Load Module ParametersTo set a loadable module parameter, use esxcfg-module (Persistent across reboots):# esxcfg-module –s extended_error_logging=1 qla4xxx*Note: Ensure you enter the module parameter correctly otherwise the module will fail to load on boot. This action will append a line to the bottom of /etc/vmware/esx.conf in the form of the following:<Snip> /upgrades/complete[0000]/name = "depricatePrettyName"/upgrades/complete[0001]/name = "moduleLineReformat"/upgrades/complete[0002]/name = "enableTSO310"/upgrades/complete[0003]/name = "persistVmkNicName"/vmkernel/module/qla4xxx.o/options = "extended_error_logging=1“](https://image.slidesharecdn.com/advancedrca-110314163040-phpapp02/85/Advanced-Root-Cause-Analysis-13-320.jpg)
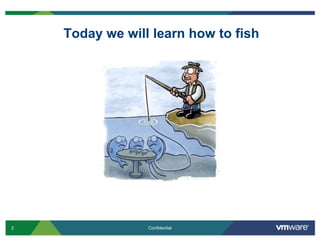
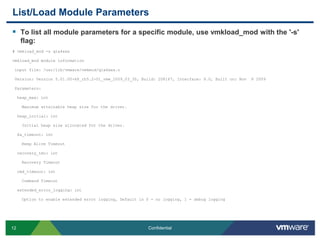
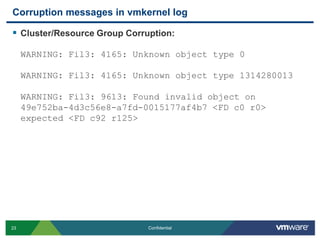
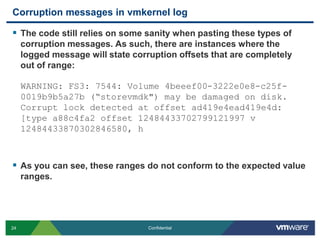
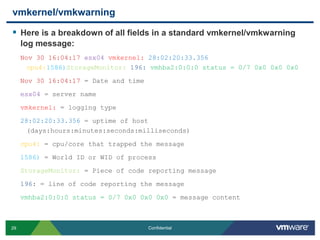
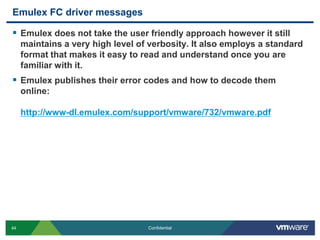
![Corruption messages in vmkernel logWhen corruption occurs it can be useful to review the logs from the host that saw the corruption occur. These messages will usually indicate what volume saw corruption, what type of corruption was seen, and what part of the VMFS structure experienced corruption (offset):Heartbeat Region Corruption:WARNING: Swap: vm 1086: 2268: Failed to open swap file '/volumes/4730e995-faa64138-6e6f-001a640a8998/foo/foo-560e1410.vswp': Invalid metadataFSS: 390: Failed with status Invalid metadata for f530 28 1 46ee2036 61d5698d 4004b12 f4c3b923 0 0 0 0 0 0 0 FS3: 6710: Reclaiming timed out heartbeat [HB state abcdef02 offset 3313664 gen 3 stamp 21824288493247 uuid 4a2ff95d-7967268a-db5c-001a64ca3e46 jrnl <FB 59001> drv 7.33] failed: Invalid metadata](https://image.slidesharecdn.com/advancedrca-110314163040-phpapp02/85/Advanced-Root-Cause-Analysis-21-320.jpg)
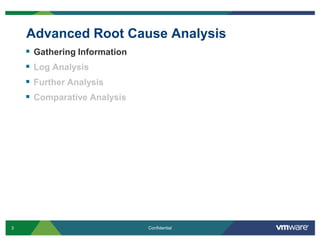
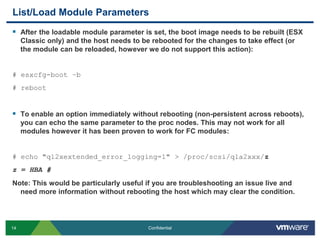
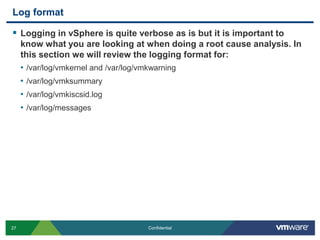
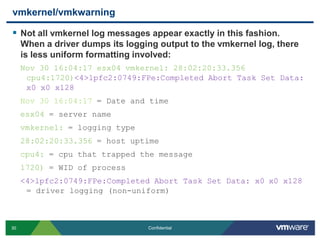
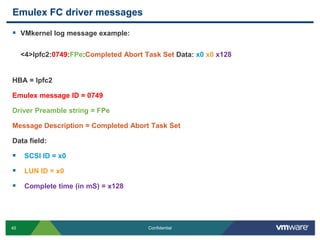
![Corruption messages in vmkernel logFile Lock Corruption:vmkernel: Invalid lock address 0[lockAddr 0] Invalid lock type 0x0[lockAddr 496217088] Invalid lock addrWARNING: FS3: 556: Volume 4bef2afb-b8226400-2f20-0019b9b5a27b (“vmfs1") may be damaged on disk. Corrupt lock detected at offset 1d93ac00: [type 0 offset 0 v 0, hb offset 0WARNING: FS3: 7544: Volume 4beeef00-3222e0e8-c25f-0019b9b5a27b (“storevmdk") may be damaged on disk. Corrupt lock detected at offset ad419e4ead419e4d: [type a88c4fa2 offset 12484433702799121997 v 12484433870302846580, h](https://image.slidesharecdn.com/advancedrca-110314163040-phpapp02/85/Advanced-Root-Cause-Analysis-22-320.jpg)
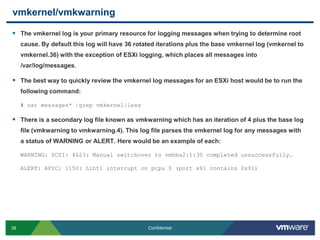
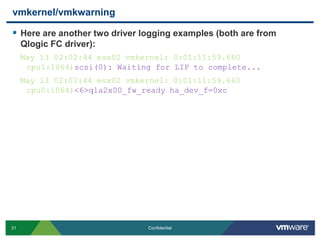
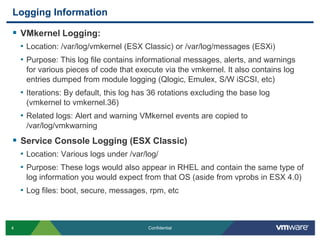
![messagesThe format for messages is no different than that of standard logging for any Linux distribution:Jan 24 00:01:01 esx6 syslogd 1.4.1: restart.It is important to know what information we populate in this log. One such object would be the vprobs logging, a new feature introduce in vSphere:Jan 24 00:11:21 esx6 vobd: Jan 24 00:11:21.656: 3552646292992us: [vprob.vmfs.heartbeat.timedout] 49fdca7e-4d680d70-51f7-0015c5f29bb6 SAN006-T3-PC2-001-RP-V5.Jan 24 00:11:23 esx6 vobd: Jan 24 00:11:23.592: 3552648228889us: [vprob.vmfs.heartbeat.recovered] 49fdca7e-4d680d70-51f7-0015c5f29bb6 SAN006-T3-PC2-001-RP-V5.](https://image.slidesharecdn.com/advancedrca-110314163040-phpapp02/85/Advanced-Root-Cause-Analysis-34-320.jpg)
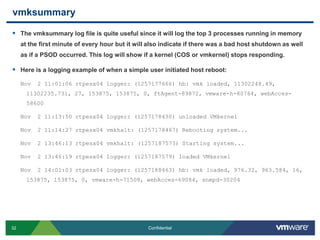
![Tracing a commandVI Client Log (C:\Documents and Settings\USERNAME\Local Settings\Application Data\VMware\vpx\viclient-#.log):[viclient:SoapTran] 2010-06-23 10:21:39.929 Invoke 82 Start RescanAllHba on HostStorageSystem:storageSystem-19961 [bs-tse-vc40.bsl.vmware.com]. [Caller: VpxClient.HostConfig.StorageRescanRequestManager.RescanAllHba][viclient:SoapTran] 2010-06-23 10:21:44.460 Invoke 82 Finish RescanAllHba on HostStorageSystem:storageSystem-19961 [bs-tse-vc40.bsl.vmware.com] - Serial:0.001, Server:004.528[viclient:SoapTran] 2010-06-23 10:21:44.460 Invoke 85 Start RescanVmfs on HostStorageSystem:storageSystem-19961 [bs-tse-vc40.bsl.vmware.com]. [Caller: VpxClient.HostConfig.StorageRescanRequestManager.OnSingleRescanComplete][viclient:SoapTran] 2010-06-23 10:21:46.241 Invoke 85 Finish RescanVmfs on HostStorageSystem:storageSystem-19961 [bs-tse-vc40.bsl.vmware.com] - Serial:0.000, Server:001.735](https://image.slidesharecdn.com/advancedrca-110314163040-phpapp02/85/Advanced-Root-Cause-Analysis-37-320.jpg)
![Tracing a commandHost VC agent Log (/var/log/vmware/vpxa/vpxa.log):[2010-06-23 10:36:48.794 0x134cab90 info 'App'] [VpxLRO] -- BEGIN task-internal-6871 -- -- vim.host.StorageSystem.rescanAllHba -- 52dc67f5-a2d1-af98-67f1-6bdf9f335997[2010-06-23 10:36:50.055 0x134cab90 info 'App'] [VpxLRO] -- FINISH task-internal-6871 -- -- vim.host.StorageSystem.rescanAllHba -- 52dc67f5-a2d1-af98-67f1-6bdf9f335997[2010-06-23 10:36:53.354 0x13446b90 info 'App'] [VpxLRO] -- BEGIN task-internal-6873 -- -- vim.host.StorageSystem.rescanVmfs -- 52dc67f5-a2d1-af98-67f1-6bdf9f335997[2010-06-23 10:36:53.764 0x13446b90 info 'App'] [VpxLRO] -- FINISH task-internal-6873 -- -- vim.host.StorageSystem.rescanVmfs -- 52dc67f5-a2d1-af98-67f1-6bdf9f335997](https://image.slidesharecdn.com/advancedrca-110314163040-phpapp02/85/Advanced-Root-Cause-Analysis-38-320.jpg)
![Tracing a commandHostd Log (/var/log/vmware/hostd.log):[2010-06-23 10:36:48.795 1A6C2B90 info 'TaskManager'] Task Created : haTask-ha-host-vim.host.StorageSystem.rescanAllHba-258139[2010-06-23 10:36:48.949 1A6C2B90 verbose 'StorageSystem'] SendStorageInfoEvent() called[2010-06-23 10:36:48.950 1A6C2B90 verbose 'Hostsvc::DatastoreSystem'] ReconcileVMFSDatastores called: refresh = true, rescan = false[2010-06-23 10:36:48.950 1A6C2B90 verbose 'FSVolumeProvider'] RefreshVMFSVolumes called<Snip>[2010-06-23 10:36:50.047 1A6C2B90 info 'TaskManager'] Task Completed : haTask-ha-host-vim.host.StorageSystem.rescanAllHba-258139 Status success](https://image.slidesharecdn.com/advancedrca-110314163040-phpapp02/85/Advanced-Root-Cause-Analysis-39-320.jpg)
![Tracing a commandHostd Log (/var/log/vmware/hostd.log) continued:[2010-06-23 10:36:53.355 1A6C2B90 info 'TaskManager'] Task Created : haTask-ha-host-vim.host.StorageSystem.rescanVmfs-258143[2010-06-23 10:36:53.355 1A6C2B90 verbose 'Hostsvc::DatastoreSystem'] ReconcileVMFSDatastores called: refresh = true, rescan = true[2010-06-23 10:36:53.355 1A6C2B90 verbose 'FSVolumeProvider'] RefreshVMFSVolumes called[2010-06-23 10:36:53.355 1A6C2B90 verbose 'FSVolumeProvider'] RescanVmfs called<Snip>[2010-06-23 10:36:53.763 1A6C2B90 verbose 'Hostsvc::DatastoreSystem'] ReconcileVMFSDatastores: Done discovering new filesystem volumes.[2010-06-23 10:36:53.764 1A6C2B90 info 'TaskManager'] Task Completed : haTask-ha-host-vim.host.StorageSystem.rescanVmfs-258143 Status success](https://image.slidesharecdn.com/advancedrca-110314163040-phpapp02/85/Advanced-Root-Cause-Analysis-40-320.jpg)
![Log Field Data: Example 1vmkernel.logApr 8 06:09:27 esxvmkernel: 7:12:07:20.454 cpu2:1274)VSCSI: 2803: Reset request on handle 8322 (0 outstanding commands)Apr 8 06:09:27 esxvmkernel: 7:12:07:20.454 cpu4:1061)VSCSI: 3019: Resetting handle 8322 [0/0]Apr 8 06:09:27 esxvmkernel: 7:12:07:20.454 cpu4:1061)VSCSI: 2871: Completing reset on handle 8322 (0 outstanding commands)](https://image.slidesharecdn.com/advancedrca-110314163040-phpapp02/85/Advanced-Root-Cause-Analysis-56-320.jpg)

The document provides detailed information on advanced root cause analysis techniques in VMware environments, focusing on various logging mechanisms such as vmkernel, hostd, and vpxa logging. It explains how to enhance logging levels for HBA drivers, set up serial line logging or remote syslog for missing logs, and crash a VM or ESX host to capture memory dumps for troubleshooting. Additionally, instructions for managing and interpreting logs related to system corruption are included.


