Downloaded 553 times


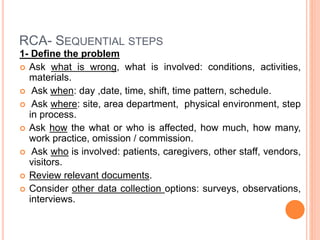


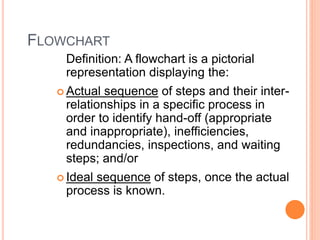


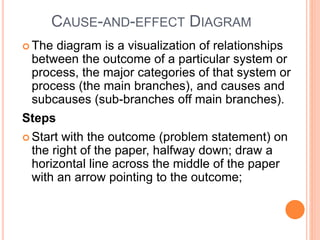


The document outlines the root cause analysis (RCA) process, emphasizing its importance in addressing sentinel events by identifying underlying system problems. It details sequential steps including problem definition, task/process analysis, change analysis, control barriers analysis, and cause-and-effect analysis, along with tools like flowcharts and cause-and-effect diagrams. Additionally, it discusses brainstorming, affinity diagrams, and multi-voting as collaborative methods to uncover and prioritize potential solutions for quality improvement.


