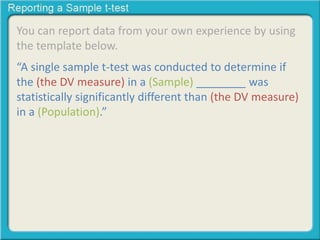
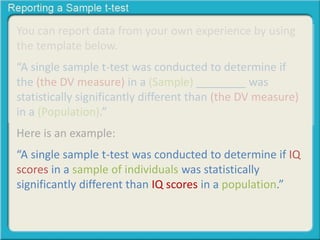
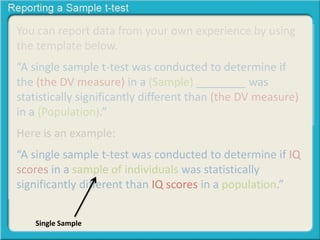
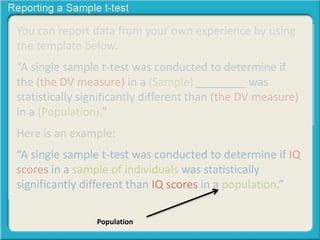
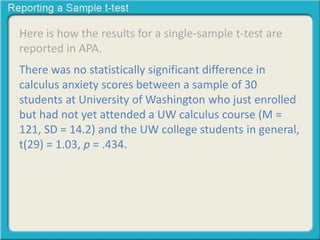
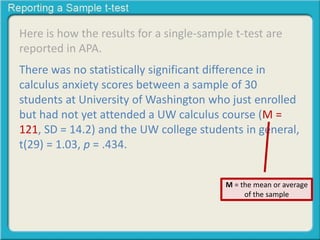
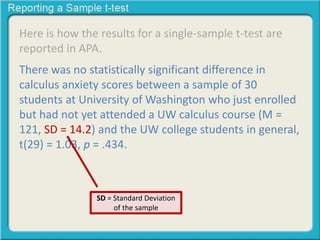
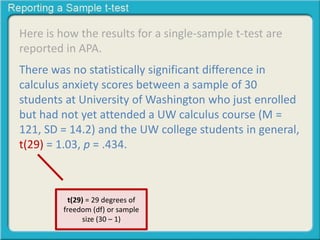
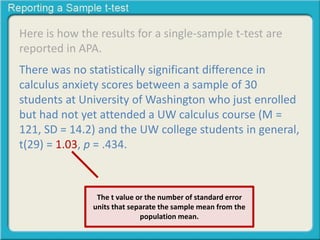
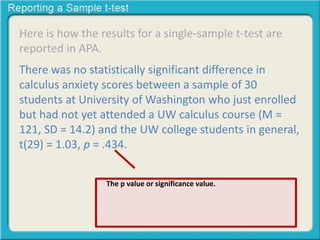
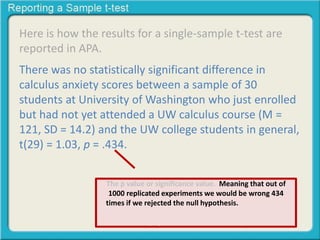
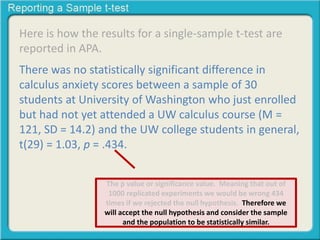
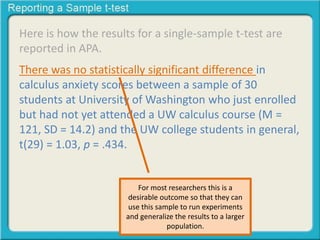
Reporting a Single Sample t-test
Learning Module
Note – the reporting format shown in this learning
module is for APA. For other formats consult specific
format guides.
Note – the reporting format shown in this learning
module is for APA. For other formats consult specific
format guides.
It is also recommended to consult the latest APA
manual to compare what is described in this learning
module with the most updated formats for APA.
Reporting the Study using APA
You can report data from your own experience by using
the template below.
You can report data from your own experience by using
the template below.
“A single sample t-test was conducted to determine if
the (the DV measure) in a (Sample) ________ was
statistically significantly different than (the DV measure)
in a (Population).”
You can report data from your own experience by using
the template below.
“A single sample t-test was conducted to determine if
the (the DV measure) in a (Sample) ________ was
statistically significantly different than (the DV measure)
in a (Population).”
Here is an example:
You can report data from your own experience by using
the template below.
“A single sample t-test was conducted to determine if
the (the DV measure) in a (Sample) ________ was
statistically significantly different than (the DV measure)
in a (Population).”
Here is an example:
“A single sample t-test was conducted to determine if IQ
scores in a sample of individuals was statistically
significantly different than IQ scores in a population.”
Single Sample
You can report data from your own experience by using
the template below.
“A single sample t-test was conducted to determine if
the (the DV measure) in a (Sample) ________ was
statistically significantly different than (the DV measure)
in a (Population).”
Here is an example:
“A single sample t-test was conducted to determine if IQ
scores in a sample of individuals was statistically
significantly different than IQ scores in a population.”
Population
Reporting Results using APA
Here is how the results for a single-sample t-test are
reported in APA.
Here is how the results for a single-sample t-test are
reported in APA.
There was no statistically significant difference in
calculus anxiety scores between a sample of 30
students at University of Washington who just enrolled
but had not yet attended a UW calculus course (M =
121, SD = 14.2) and the UW college students in general,
t(29) = 1.03, p = .434.
M = the mean or average
of the sample
Here is how the results for a single-sample t-test are
reported in APA.
There was no statistically significant difference in
calculus anxiety scores between a sample of 30
students at University of Washington who just enrolled
but had not yet attended a UW calculus course (M =
121, SD = 14.2) and the UW college students in general,
t(29) = 1.03, p = .434.
SD = Standard Deviation
of the sample
Here is how the results for a single-sample t-test are
reported in APA.
There was no statistically significant difference in
calculus anxiety scores between a sample of 30
students at University of Washington who just enrolled
but had not yet attended a UW calculus course (M =
121, SD = 14.2) and the UW college students in general,
t(29) = 1.03, p = .434.
t(29) = 29 degrees of
freedom (df) or sample
size (30 – 1)
Here is how the results for a single-sample t-test are
reported in APA.
There was no statistically significant difference in
calculus anxiety scores between a sample of 30
students at University of Washington who just enrolled
but had not yet attended a UW calculus course (M =
121, SD = 14.2) and the UW college students in general,
t(29) = 1.03, p = .434.
The t value or the number of standard error
units that separate the sample mean from the
population mean.
Here is how the results for a single-sample t-test are
reported in APA.
There was no statistically significant difference in
calculus anxiety scores between a sample of 30
students at University of Washington who just enrolled
but had not yet attended a UW calculus course (M =
121, SD = 14.2) and the UW college students in general,
t(29) = 1.03, p = .434.
The p value or significance value. Meaning that out of
1000 replicated experiments we would be wrong 434
times if we rejected the null hypothesis. Therefore we
will not reject the null hypothesis and consider the sample
and the population to be statistically similar.
Here is how the results for a single-sample t-test are
reported in APA.
There was no statistically significant difference in
calculus anxiety scores between a sample of 30
students at University of Washington who just enrolled
but had not yet attended a UW calculus course (M =
121, SD = 14.2) and the UW college students in general,
t(29) = 1.03, p = .434.
The p value or significance value. Meaning that out of
1000 replicated experiments we would be wrong 434
times if we rejected the null hypothesis. Therefore we
will accept the null hypothesis and consider the sample
and the population to be statistically similar.
Here is how the results for a single-sample t-test are
reported in APA.
There was no statistically significant difference in
calculus anxiety scores between a sample of 30
students at University of Washington who just enrolled
but had not yet attended a UW calculus course (M =
121, SD = 14.2) and the UW college students in general,
t(29) = 1.03, p = .434.
For most researchers this is a
desirable outcome so that they can
use this sample to run experiments
and generalize the results to a larger
population.

Reporting a single sample t test

  • 1.
    Reporting a SingleSample t-test Learning Module
  • 2.
    Note – thereporting format shown in this learning module is for APA. For other formats consult specific format guides.
  • 3.
    Note – thereporting format shown in this learning module is for APA. For other formats consult specific format guides. It is also recommended to consult the latest APA manual to compare what is described in this learning module with the most updated formats for APA.
  • 4.
  • 5.
    You can reportdata from your own experience by using the template below.
  • 6.
    You can reportdata from your own experience by using the template below. “A single sample t-test was conducted to determine if the (the DV measure) in a (Sample) ________ was statistically significantly different than (the DV measure) in a (Population).”
  • 7.
    You can reportdata from your own experience by using the template below. “A single sample t-test was conducted to determine if the (the DV measure) in a (Sample) ________ was statistically significantly different than (the DV measure) in a (Population).” Here is an example:
  • 8.
    You can reportdata from your own experience by using the template below. “A single sample t-test was conducted to determine if the (the DV measure) in a (Sample) ________ was statistically significantly different than (the DV measure) in a (Population).” Here is an example: “A single sample t-test was conducted to determine if IQ scores in a sample of individuals was statistically significantly different than IQ scores in a population.”
  • 9.
    You can reportdata from your own experience by using the template below. “A single sample t-test was conducted to determine if the (the DV measure) in a (Sample) ________ was statistically significantly different than (the DV measure) in a (Population).” Here is an example: “A single sample t-test was conducted to determine if IQ scores in a sample of individuals was statistically significantly different than IQ scores in a population.” Single Sample
  • 10.
    You can reportdata from your own experience by using the template below. “A single sample t-test was conducted to determine if the (the DV measure) in a (Sample) ________ was statistically significantly different than (the DV measure) in a (Population).” Here is an example: “A single sample t-test was conducted to determine if IQ scores in a sample of individuals was statistically significantly different than IQ scores in a population.” Population
  • 11.
  • 12.
    Here is howthe results for a single-sample t-test are reported in APA.
  • 13.
    Here is howthe results for a single-sample t-test are reported in APA. There was no statistically significant difference in calculus anxiety scores between a sample of 30 students at University of Washington who just enrolled but had not yet attended a UW calculus course (M = 121, SD = 14.2) and the UW college students in general, t(29) = 1.03, p = .434.
  • 14.
    Here is howthe results for a single-sample t-test are reported in APA. There was no statistically significant difference in calculus anxiety scores between a sample of 30 students at University of Washington who just enrolled but had not yet attended a UW calculus course (M = 121, SD = 14.2) and the UW college students in general, t(29) = 1.03, p = .434. M = the mean or average of the sample
  • 15.
    Here is howthe results for a single-sample t-test are reported in APA. There was no statistically significant difference in calculus anxiety scores between a sample of 30 students at University of Washington who just enrolled but had not yet attended a UW calculus course (M = 121, SD = 14.2) and the UW college students in general, t(29) = 1.03, p = .434. SD = Standard Deviation of the sample
  • 16.
    Here is howthe results for a single-sample t-test are reported in APA. There was no statistically significant difference in calculus anxiety scores between a sample of 30 students at University of Washington who just enrolled but had not yet attended a UW calculus course (M = 121, SD = 14.2) and the UW college students in general, t(29) = 1.03, p = .434. t(29) = 29 degrees of freedom (df) or sample size (30 – 1)
  • 17.
    Here is howthe results for a single-sample t-test are reported in APA. There was no statistically significant difference in calculus anxiety scores between a sample of 30 students at University of Washington who just enrolled but had not yet attended a UW calculus course (M = 121, SD = 14.2) and the UW college students in general, t(29) = 1.03, p = .434. The t value or the number of standard error units that separate the sample mean from the population mean.
  • 18.
    Here is howthe results for a single-sample t-test are reported in APA. There was no statistically significant difference in calculus anxiety scores between a sample of 30 students at University of Washington who just enrolled but had not yet attended a UW calculus course (M = 121, SD = 14.2) and the UW college students in general, t(29) = 1.03, p = .434. The p value or significance value. Meaning that out of 1000 replicated experiments we would be wrong 434 times if we rejected the null hypothesis. Therefore we will not reject the null hypothesis and consider the sample and the population to be statistically similar.
  • 19.
    Here is howthe results for a single-sample t-test are reported in APA. There was no statistically significant difference in calculus anxiety scores between a sample of 30 students at University of Washington who just enrolled but had not yet attended a UW calculus course (M = 121, SD = 14.2) and the UW college students in general, t(29) = 1.03, p = .434. The p value or significance value. Meaning that out of 1000 replicated experiments we would be wrong 434 times if we rejected the null hypothesis. Therefore we will not reject the null hypothesis and consider the sample and the population to be statistically similar.
  • 20.
    Here is howthe results for a single-sample t-test are reported in APA. There was no statistically significant difference in calculus anxiety scores between a sample of 30 students at University of Washington who just enrolled but had not yet attended a UW calculus course (M = 121, SD = 14.2) and the UW college students in general, t(29) = 1.03, p = .434. The p value or significance value. Meaning that out of 1000 replicated experiments we would be wrong 434 times if we rejected the null hypothesis. Therefore we will accept the null hypothesis and consider the sample and the population to be statistically similar.
  • 21.
    Here is howthe results for a single-sample t-test are reported in APA. There was no statistically significant difference in calculus anxiety scores between a sample of 30 students at University of Washington who just enrolled but had not yet attended a UW calculus course (M = 121, SD = 14.2) and the UW college students in general, t(29) = 1.03, p = .434. For most researchers this is a desirable outcome so that they can use this sample to run experiments and generalize the results to a larger population.