Downloaded 312 times


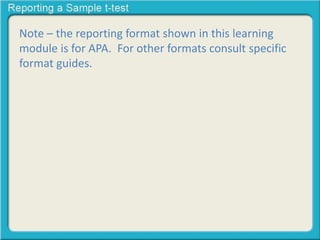


![Here is how the results for a single-sample t-test are
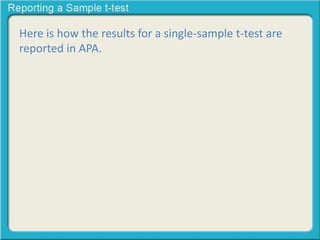
reported in APA.
Students taking statistics courses in psychology at the
University of Washington reported studying similar
hours for tests (M = 121, SD = 14.2) compared to UW
college students in general, t(33) = 2.10, p = .034.
Here is a template:
[Describe the single sample] [Report the results] (M =
[ ], SD = [ ]) than [Insert population], t( ) = [ ], p = [ ].](https://image.slidesharecdn.com/reportingasinglesamplet-testrevised-140916141525-phpapp02/85/Reporting-a-single-sample-t-test-13-320.jpg)
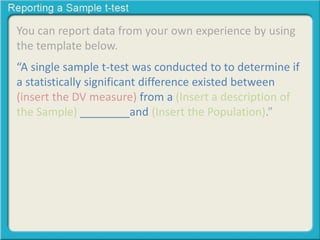
![Here is how the results for a single-sample t-test are
reported in APA.
Students taking statistics courses in psychology at the
University of Washington reported studying similar
hours for tests (M = 121, SD = 14.2) compared to UW
college students in general, t(33) = 2.10, p = .034.
Here is a template:
[Describe the single sample] [Report the results] (M =
[ ], SD = [ ]) than [Insert population], t( ) = [ ], p = [ ].
Just fill in the blanks by using the SPSS output.](https://image.slidesharecdn.com/reportingasinglesamplet-testrevised-140916141525-phpapp02/85/Reporting-a-single-sample-t-test-14-320.jpg)

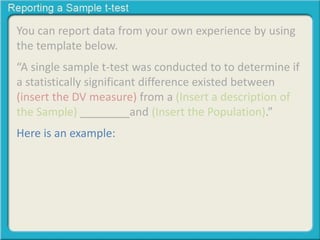
![Let’s start by filling in the Mean and Standard Deviation
for each condition.
Persons who eat broccoli regularly received statistically
significantly higher IQ scores (M = [ ], SD = [ ]) than
the general population, t( ) = [ ], p = [ ].](https://image.slidesharecdn.com/reportingasinglesamplet-testrevised-140916141525-phpapp02/85/Reporting-a-single-sample-t-test-16-320.jpg)
![Let’s start by filling in the Mean and Standard Deviation
for each condition.
Persons who eat broccoli regularly received statistically
significantly higher IQ scores (M = [ ], SD = [ ]) than
the general population, t( ) = [ ], p = [ ].](https://image.slidesharecdn.com/reportingasinglesamplet-testrevised-140916141525-phpapp02/85/Reporting-a-single-sample-t-test-17-320.jpg)
![Let’s start by filling in the Mean and Standard Deviation
for each condition.
Persons who eat broccoli regularly received statistically
significantly higher IQ scores (M = [120], SD = [ ]) than
the general population, t( ) = [ ], p = [ ].](https://image.slidesharecdn.com/reportingasinglesamplet-testrevised-140916141525-phpapp02/85/Reporting-a-single-sample-t-test-18-320.jpg)
![Let’s start by filling in the Mean and Standard Deviation
for each condition.
Persons who eat broccoli regularly received statistically
significantly higher IQ scores (M = [120], SD = [ ]) than
the general population, t( ) = [ ], p = [ ].](https://image.slidesharecdn.com/reportingasinglesamplet-testrevised-140916141525-phpapp02/85/Reporting-a-single-sample-t-test-19-320.jpg)
![Let’s start by filling in the Mean and Standard Deviation
for each condition.
Persons who eat broccoli regularly received statistically
significantly higher IQ scores (M = [120], SD = [ ]) than
the general population, t( ) = [ ], p = [ ].](https://image.slidesharecdn.com/reportingasinglesamplet-testrevised-140916141525-phpapp02/85/Reporting-a-single-sample-t-test-20-320.jpg)
![Let’s start by filling in the Mean and Standard Deviation
for each condition.
Persons who eat broccoli regularly received statistically
significantly higher IQ scores (M = [120], SD = [12.2])
than the general population, t( ) = [ ], p = [ ].](https://image.slidesharecdn.com/reportingasinglesamplet-testrevised-140916141525-phpapp02/85/Reporting-a-single-sample-t-test-21-320.jpg)
![Let’s start by filling in the Mean and Standard Deviation
for each condition.
Persons who eat broccoli regularly received statistically
significantly higher IQ scores (M = [120], SD = [12.2])
than the general population, t( ) = [ ], p = [ ].
Degrees of
freedom (N-1)](https://image.slidesharecdn.com/reportingasinglesamplet-testrevised-140916141525-phpapp02/85/Reporting-a-single-sample-t-test-22-320.jpg)
![Let’s start by filling in the Mean and Standard Deviation
for each condition.
Persons who eat broccoli regularly received statistically
significantly higher IQ scores (M = [120], SD = [12.2])
than the general population, t(22) = [ ], p = [ ].
Degrees of
freedom (N-1)](https://image.slidesharecdn.com/reportingasinglesamplet-testrevised-140916141525-phpapp02/85/Reporting-a-single-sample-t-test-23-320.jpg)
![Let’s start by filling in the Mean and Standard Deviation
for each condition.
Persons who eat broccoli regularly received statistically
significantly higher IQ scores (M = [120], SD = [12.2])
than the general population, t(22) = [ ], p = [ ].
One-Sample Test
Test Value = 100
t df Sig. (2-tailed) Mean Difference
95% Confidence Interval of the
Difference
Lower Upper
Broccoli_Sample 7.859 22 .000 19.95652 14.6901 25.2229](https://image.slidesharecdn.com/reportingasinglesamplet-testrevised-140916141525-phpapp02/85/Reporting-a-single-sample-t-test-24-320.jpg)
![Let’s start by filling in the Mean and Standard Deviation
for each condition.
Persons who eat broccoli regularly received statistically
significantly higher IQ scores (M = [120], SD = [12.2])
than the general population, t(22) = [7.86], p = [ ].
One-Sample Test
Test Value = 100
t df Sig. (2-tailed) Mean Difference
95% Confidence Interval of the
Difference
Lower Upper
Broccoli_Sample 7.859 22 .000 19.95652 14.6901 25.2229](https://image.slidesharecdn.com/reportingasinglesamplet-testrevised-140916141525-phpapp02/85/Reporting-a-single-sample-t-test-25-320.jpg)
![Let’s start by filling in the Mean and Standard Deviation
for each condition.
Persons who eat broccoli regularly received statistically
significantly higher IQ scores (M = [120], SD = [12.2])
than the general population, t(22) = [7.86], p = [ ].
One-Sample Test
Test Value = 100
t df Sig. (2-tailed) Mean Difference
95% Confidence Interval of the
Difference
Lower Upper
Broccoli_Sample 7.859 22 .000 19.95652 14.6901 25.2229](https://image.slidesharecdn.com/reportingasinglesamplet-testrevised-140916141525-phpapp02/85/Reporting-a-single-sample-t-test-26-320.jpg)
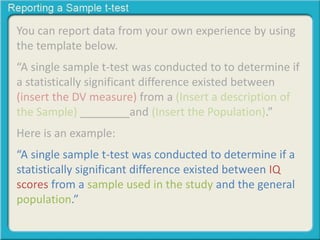
![Let’s start by filling in the Mean and Standard Deviation
for each condition.
Persons who eat broccoli regularly received statistically
significantly higher IQ scores (M = [120], SD = [12.2])
than the general population, t(22) = [7.86], p = [0.000].
One-Sample Test
Test Value = 100
t df Sig. (2-tailed) Mean Difference
95% Confidence Interval of the
Difference
Lower Upper
Broccoli_Sample 7.859 22 .000 19.95652 14.6901 25.2229](https://image.slidesharecdn.com/reportingasinglesamplet-testrevised-140916141525-phpapp02/85/Reporting-a-single-sample-t-test-27-320.jpg)

This document provides guidance on reporting the results of a single sample t-test in APA format. It includes templates for describing the test and population in the introduction and reporting the mean, standard deviation, t-value and significance in the results. An example is given of a hypothetical single sample t-test comparing IQ scores of people who eat broccoli regularly to the general population.