Downloaded 441 times


This document provides information on conducting a one-way analysis of variance (ANOVA) using SPSS. It uses an example where a farmer tests the effect of different fertilizers (biological, chemical, none) on the weight of parsley plants. The summary is: The document walks through running a one-way ANOVA in SPSS to analyze the weights of parsley plants that received different fertilizers. The ANOVA results show that fertilizer significantly affects weight. A post hoc test finds a significant difference between plants that received chemical fertilizer versus no fertilizer. The document also briefly describes two-way ANOVAs for analyzing the effects of two independent variables.
Introduction to data analysis and types of ANOVA tests (t Test, One-way and N-way ANOVA, ANCOVA).
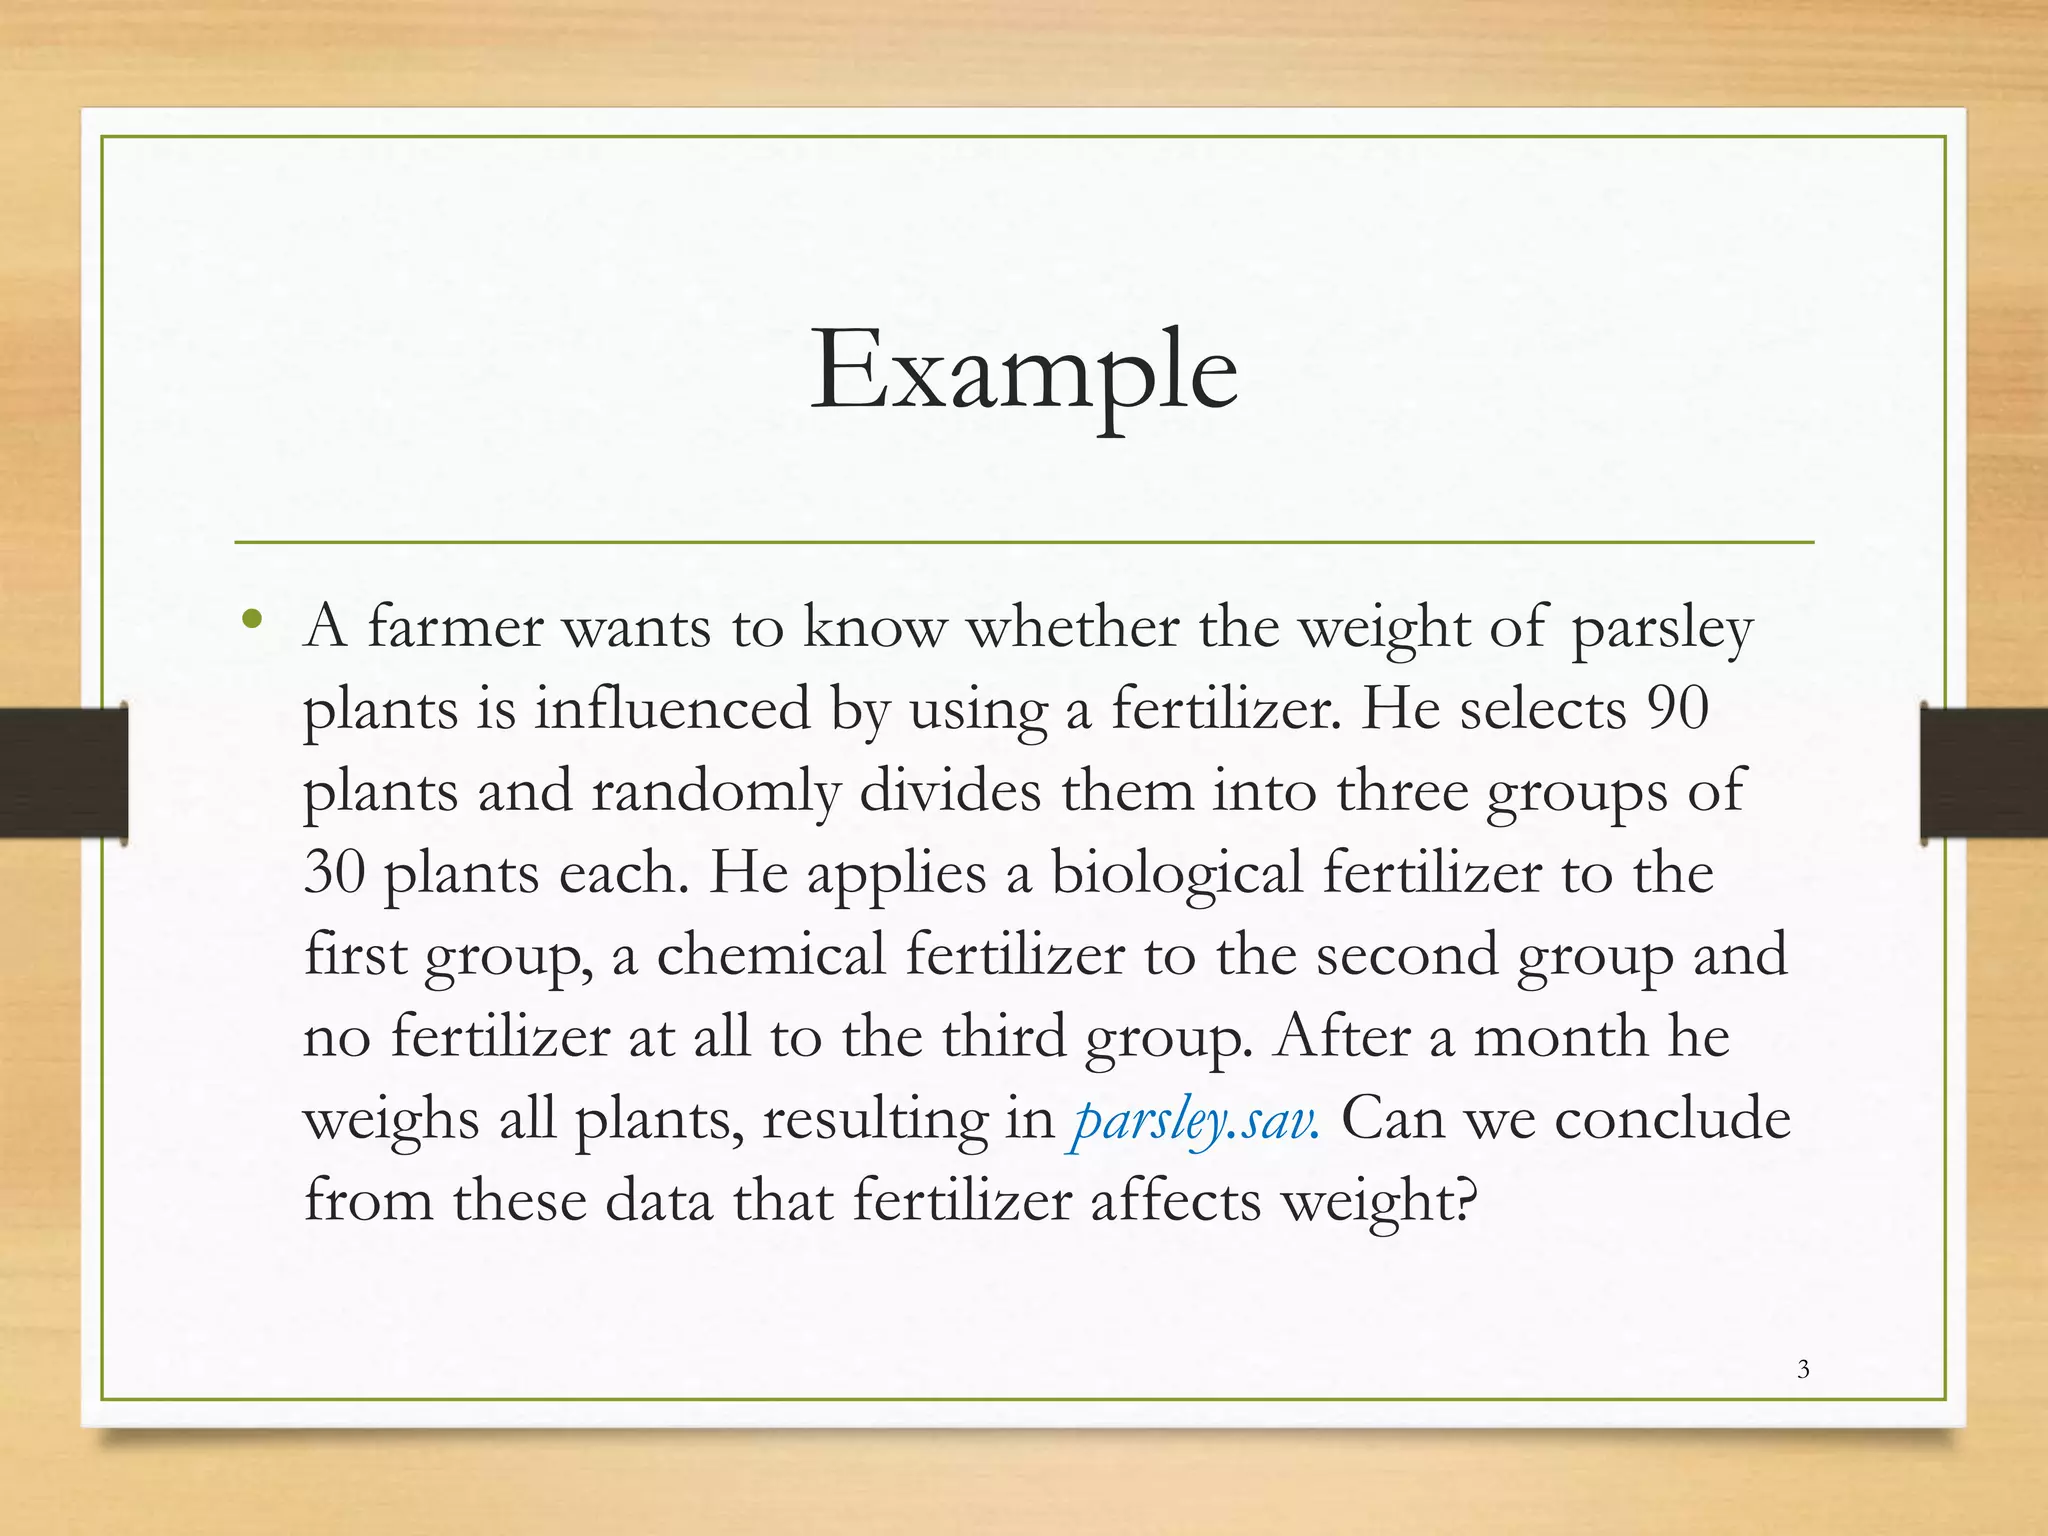
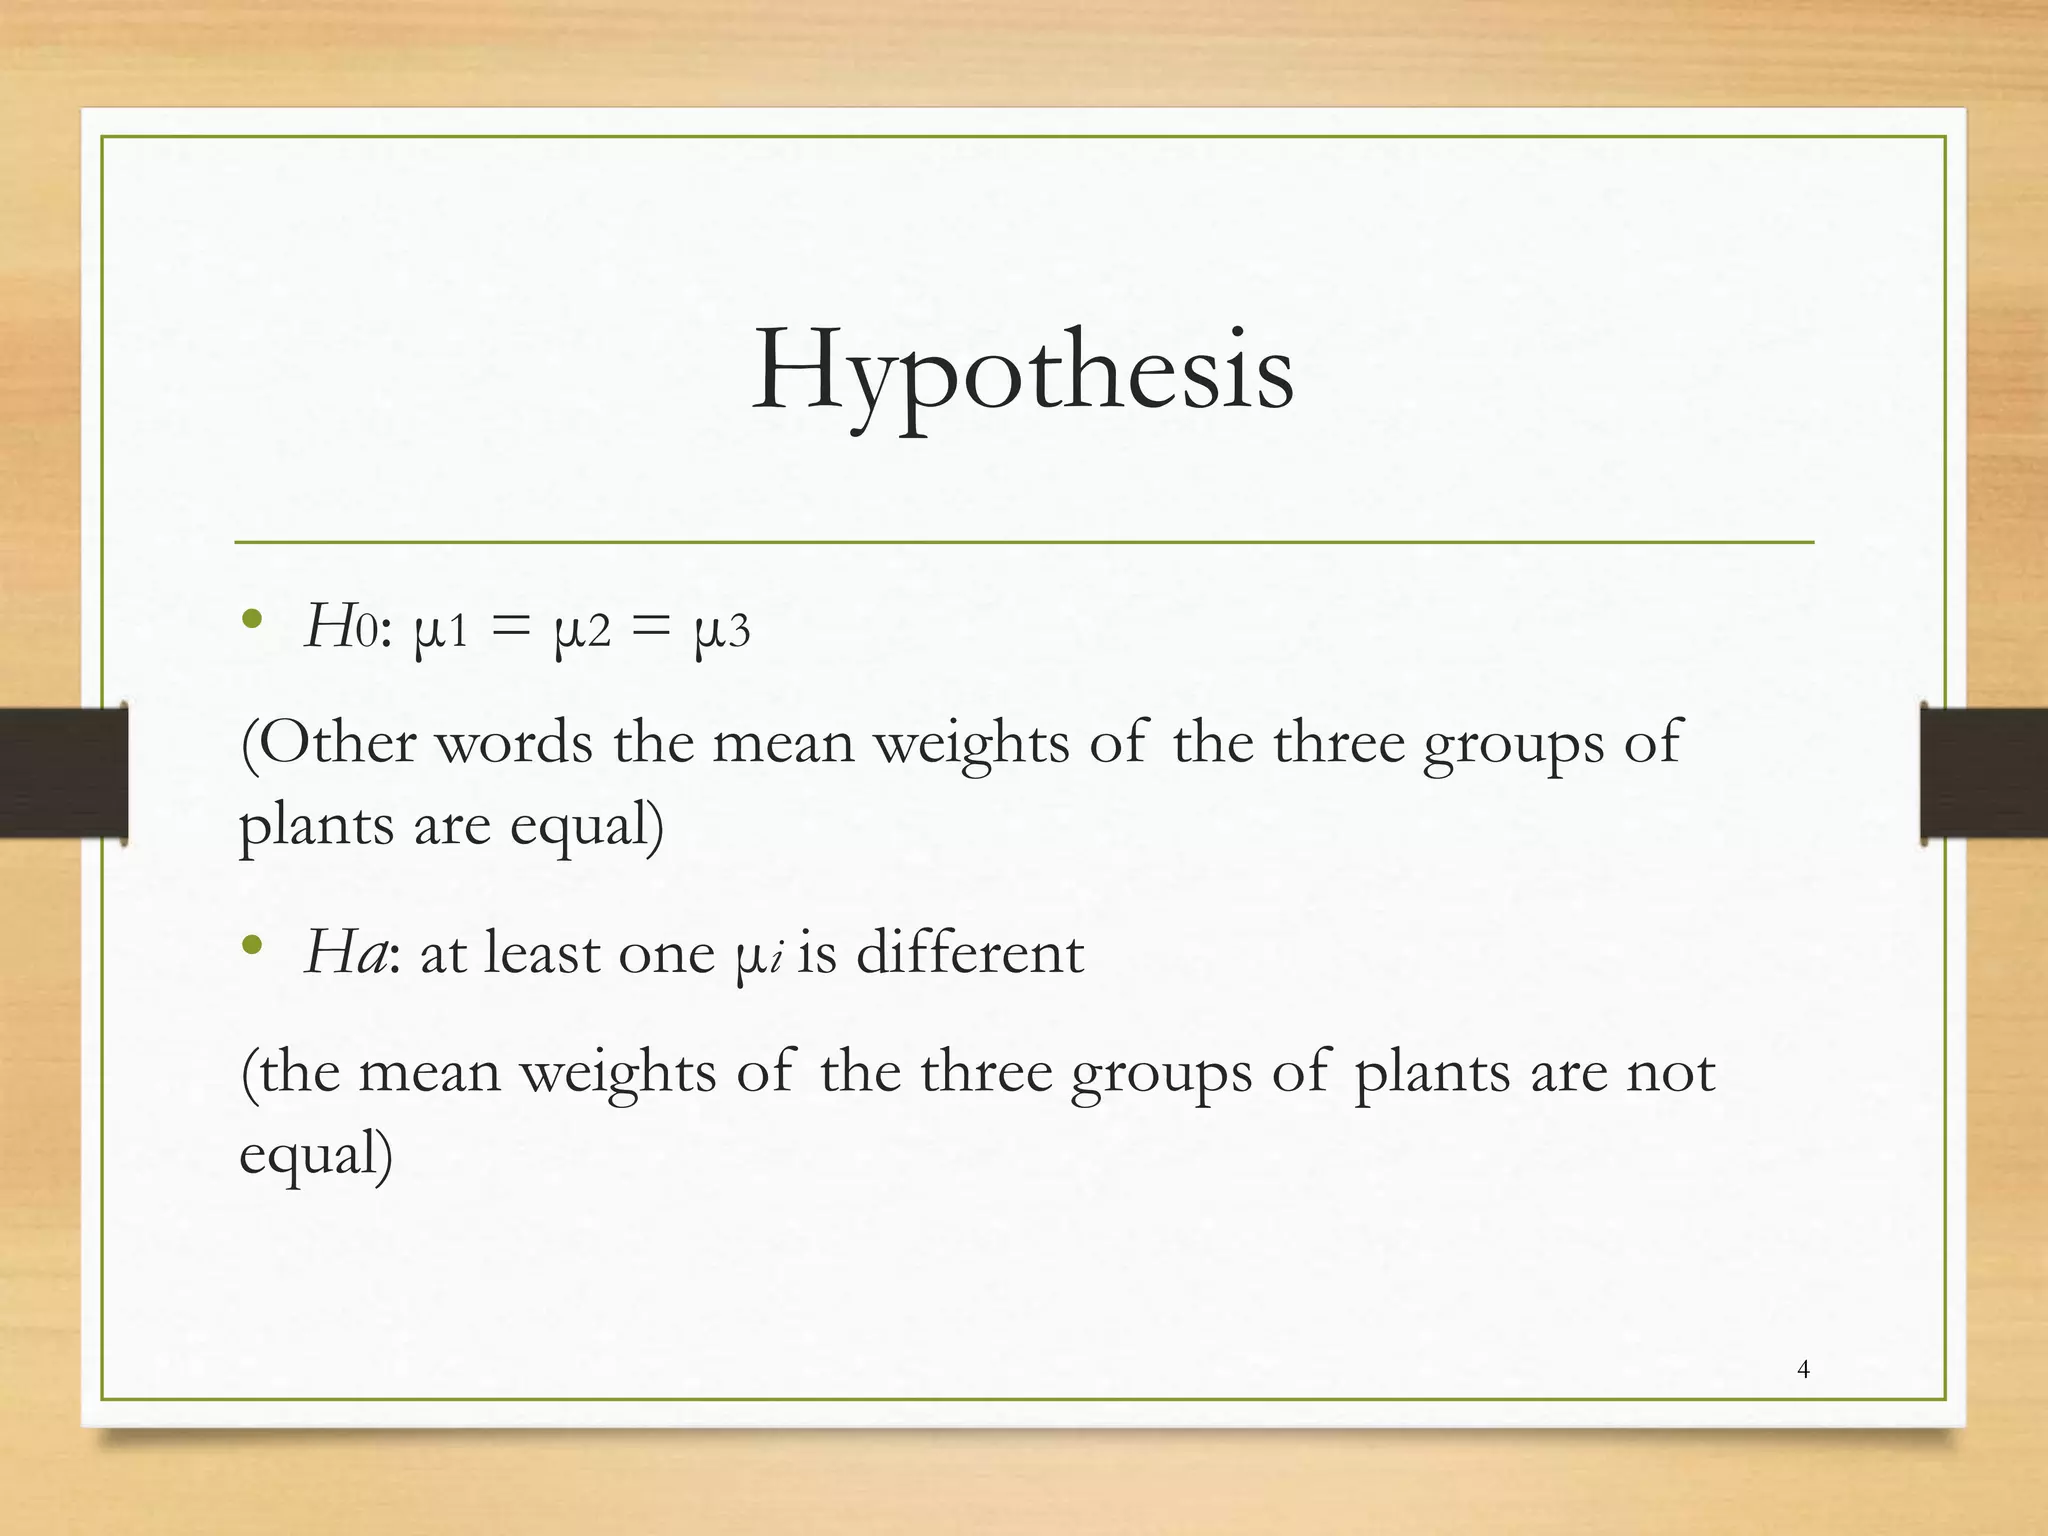
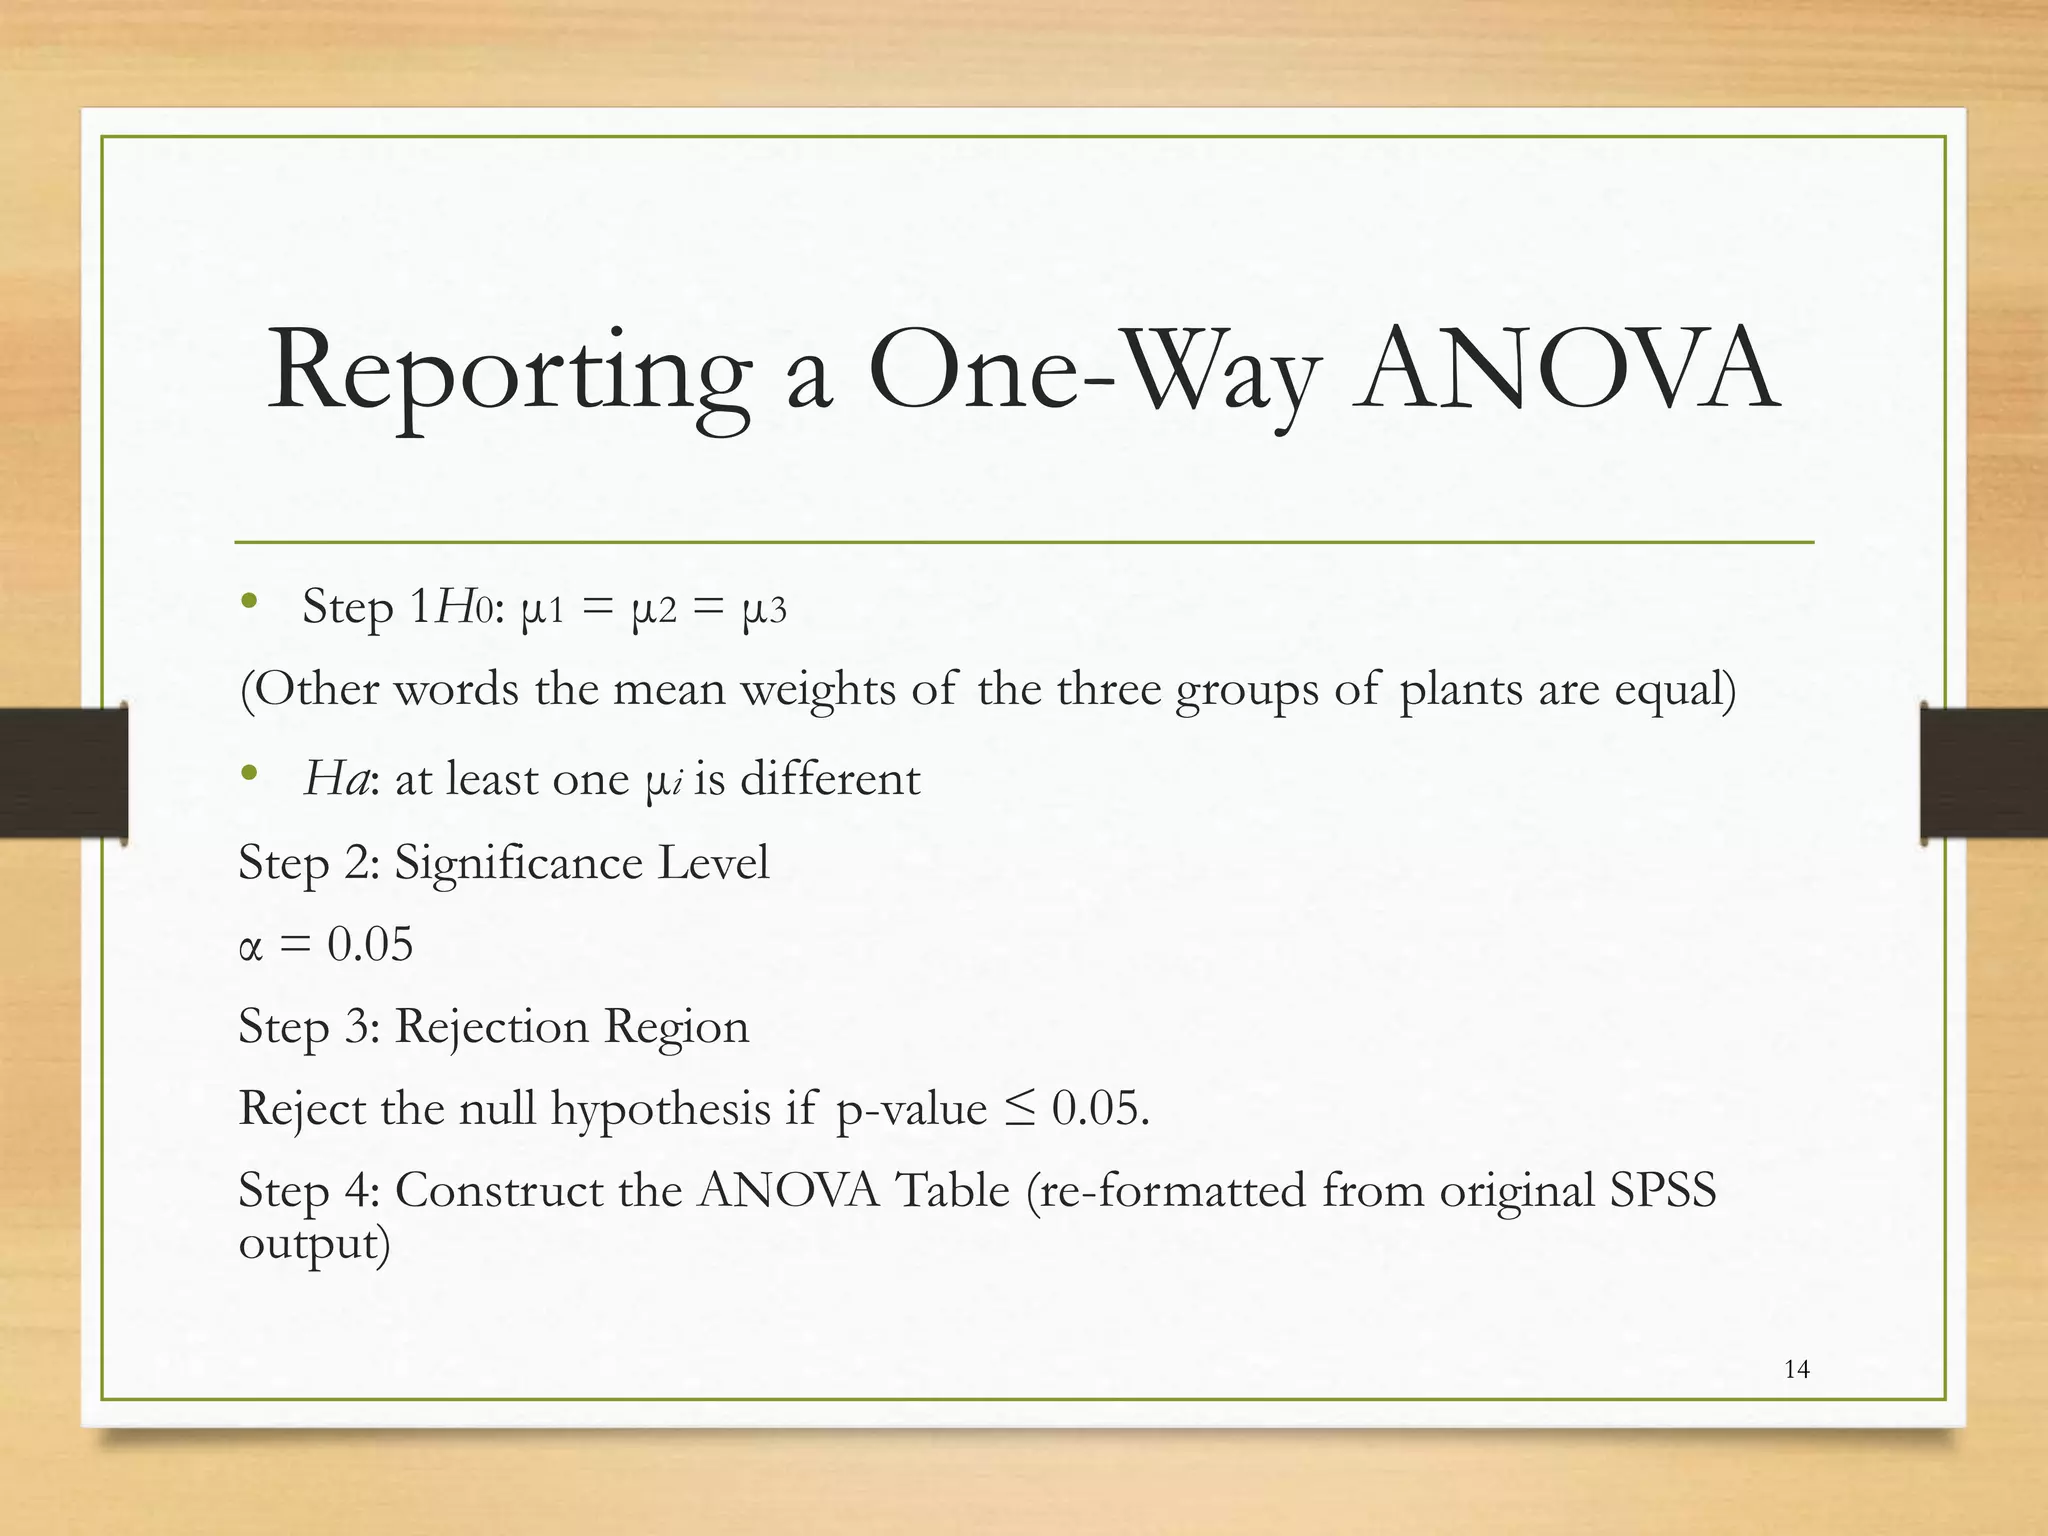
Description of a farmer's experiment testing the effect of different fertilizers on parsley plant weight, with null and alternative hypotheses.
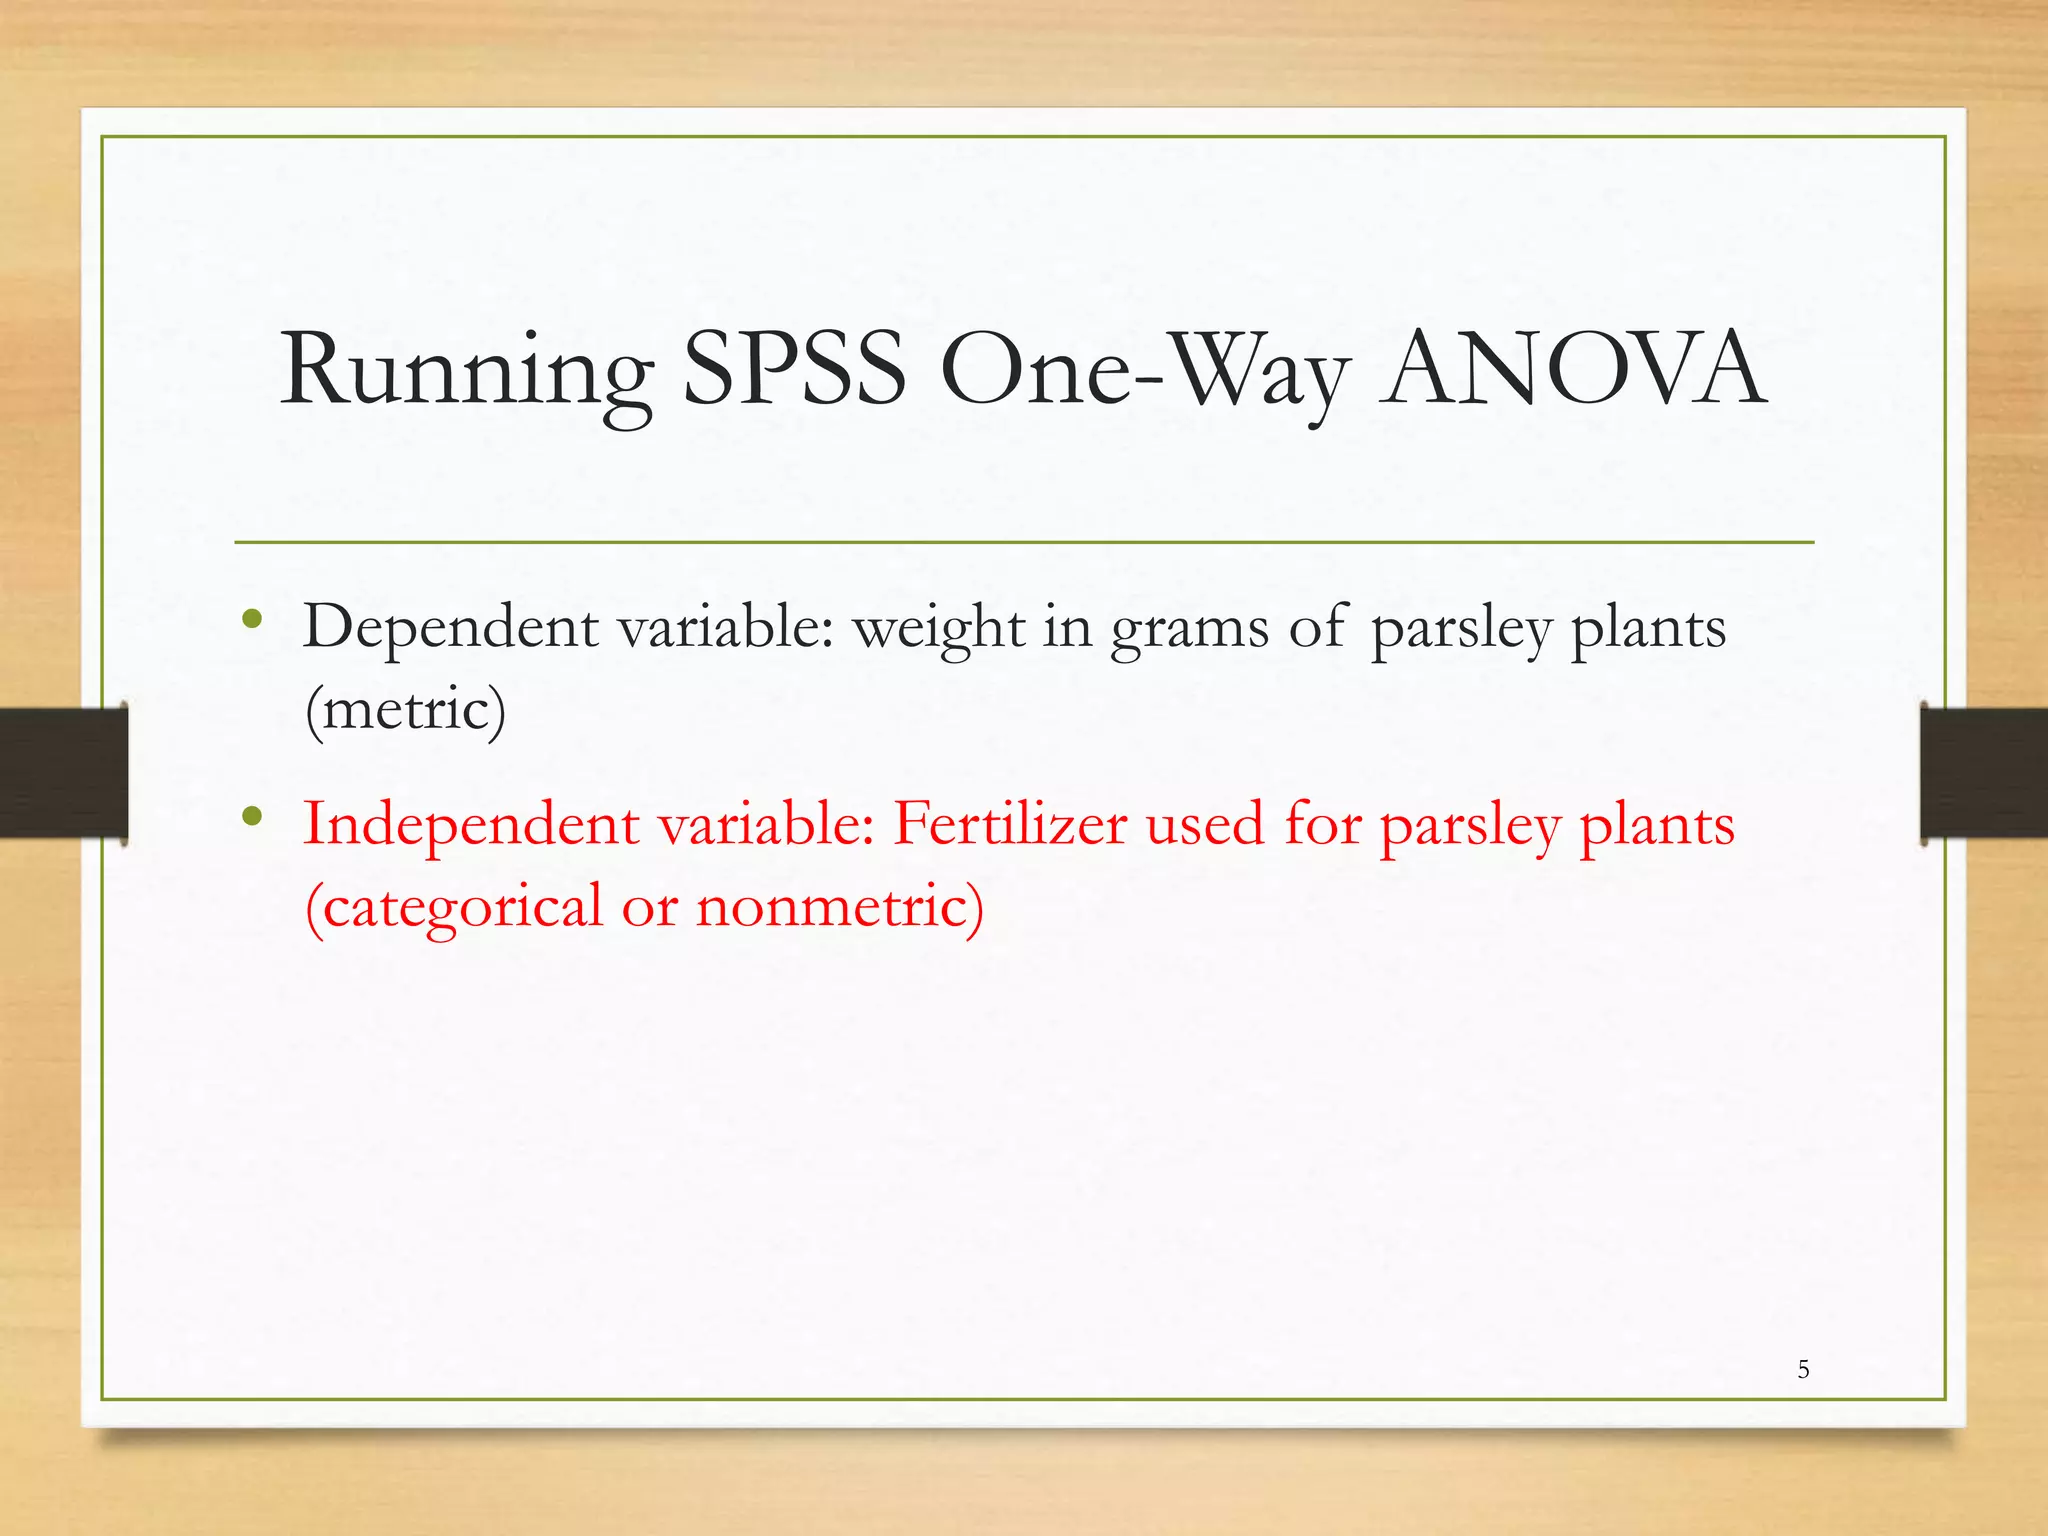
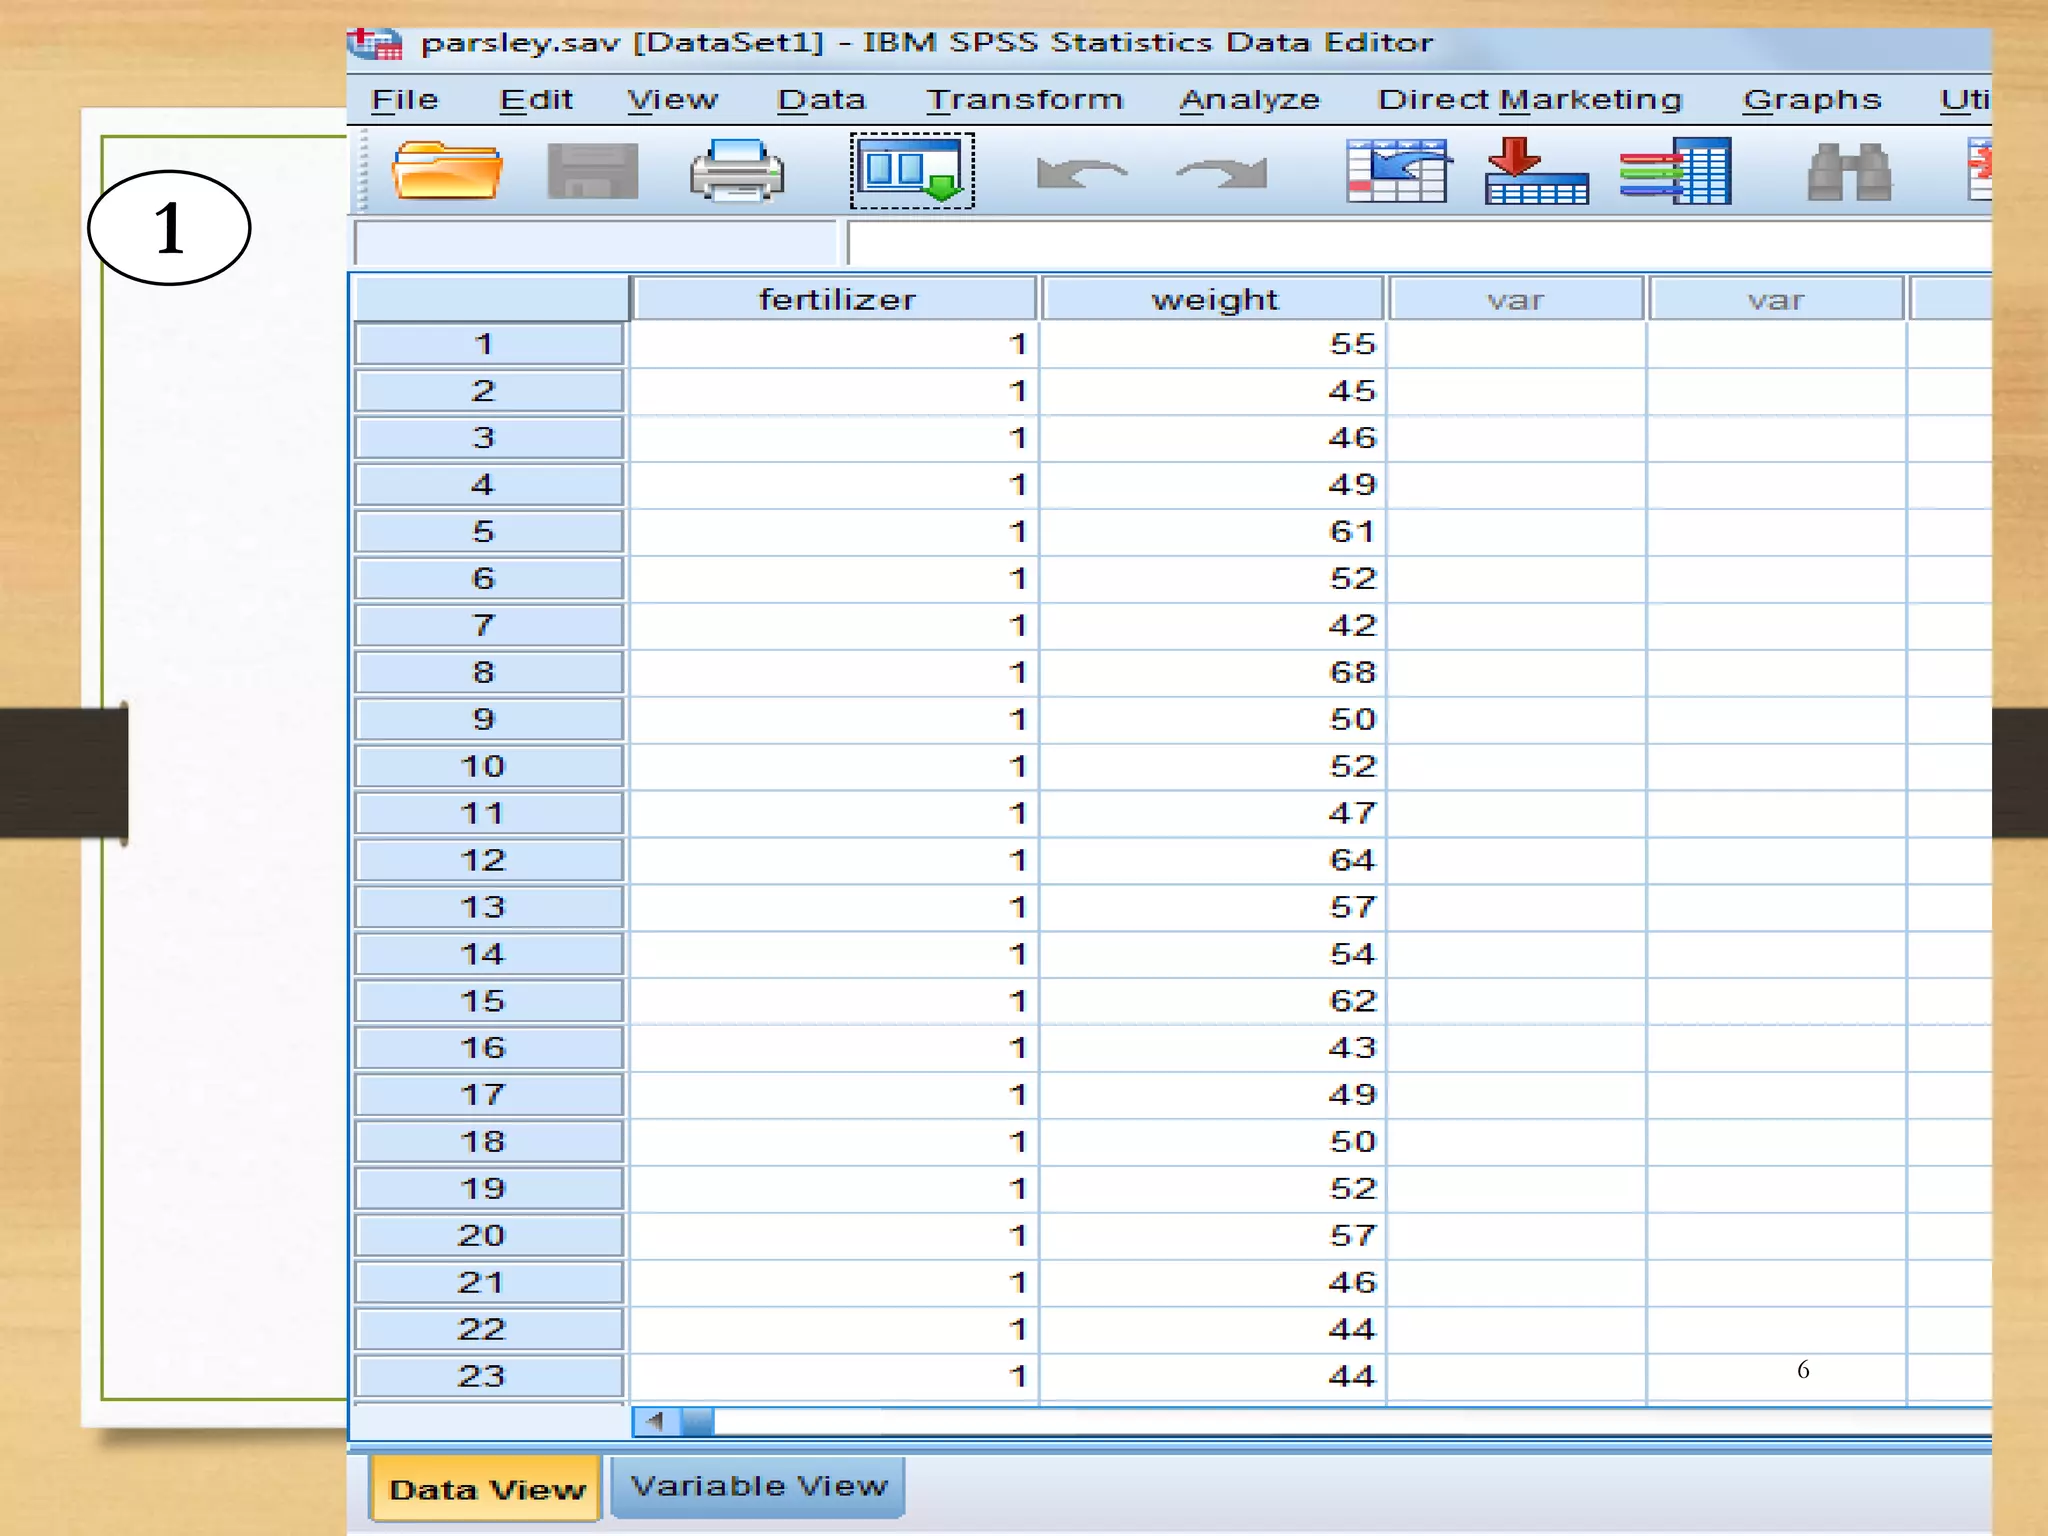
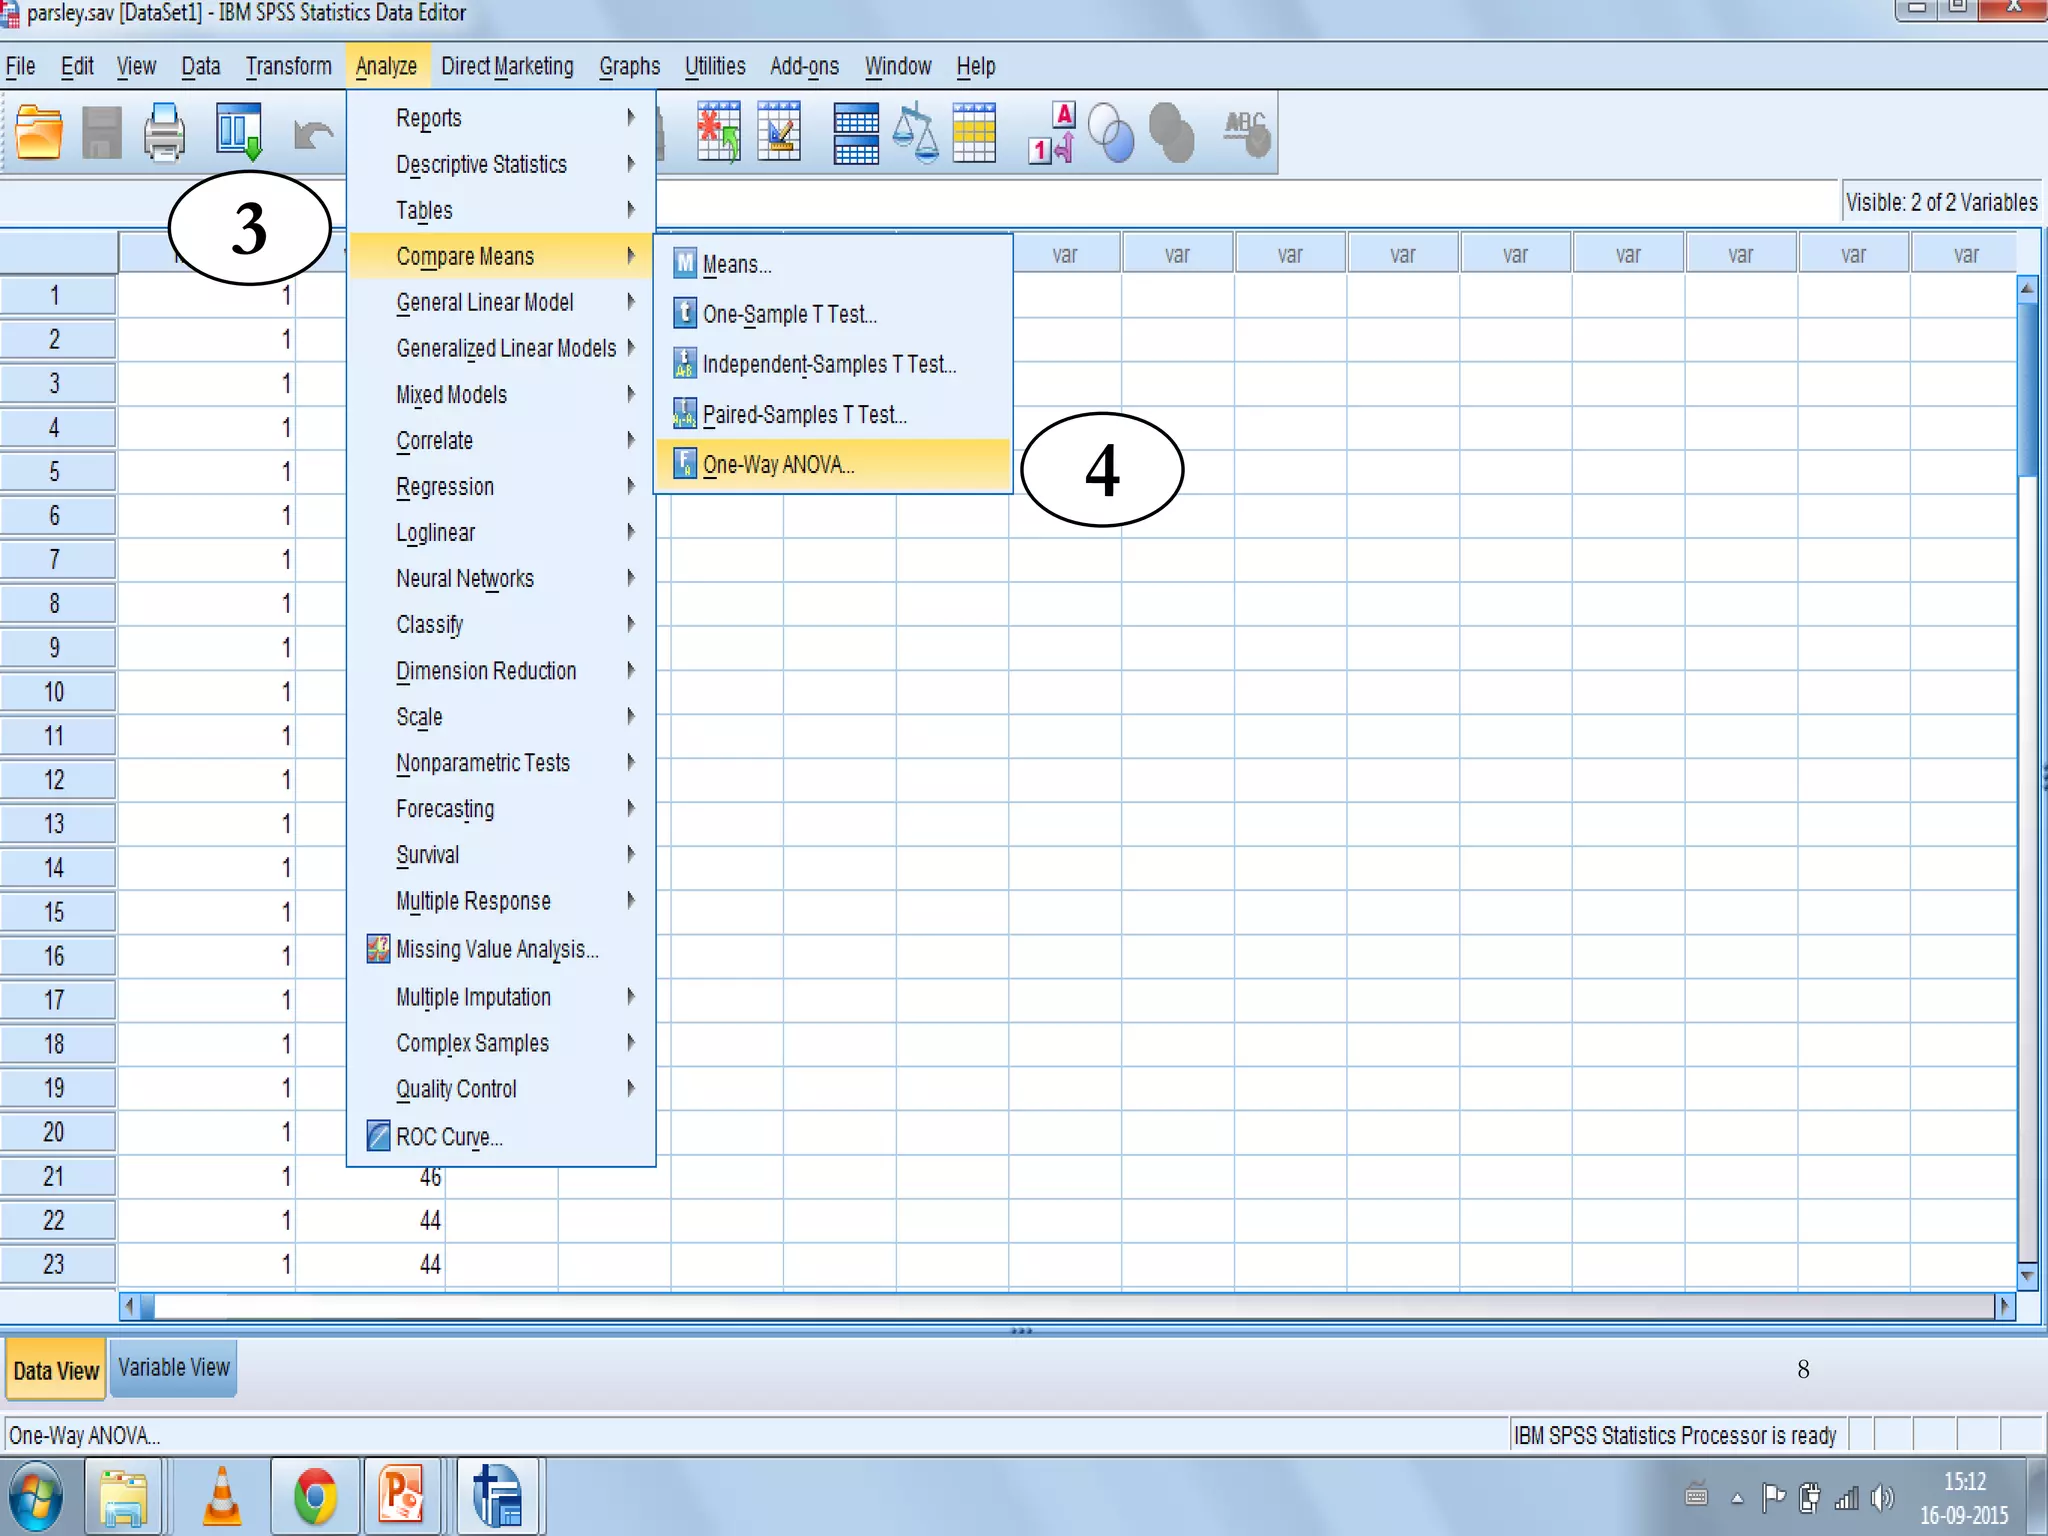
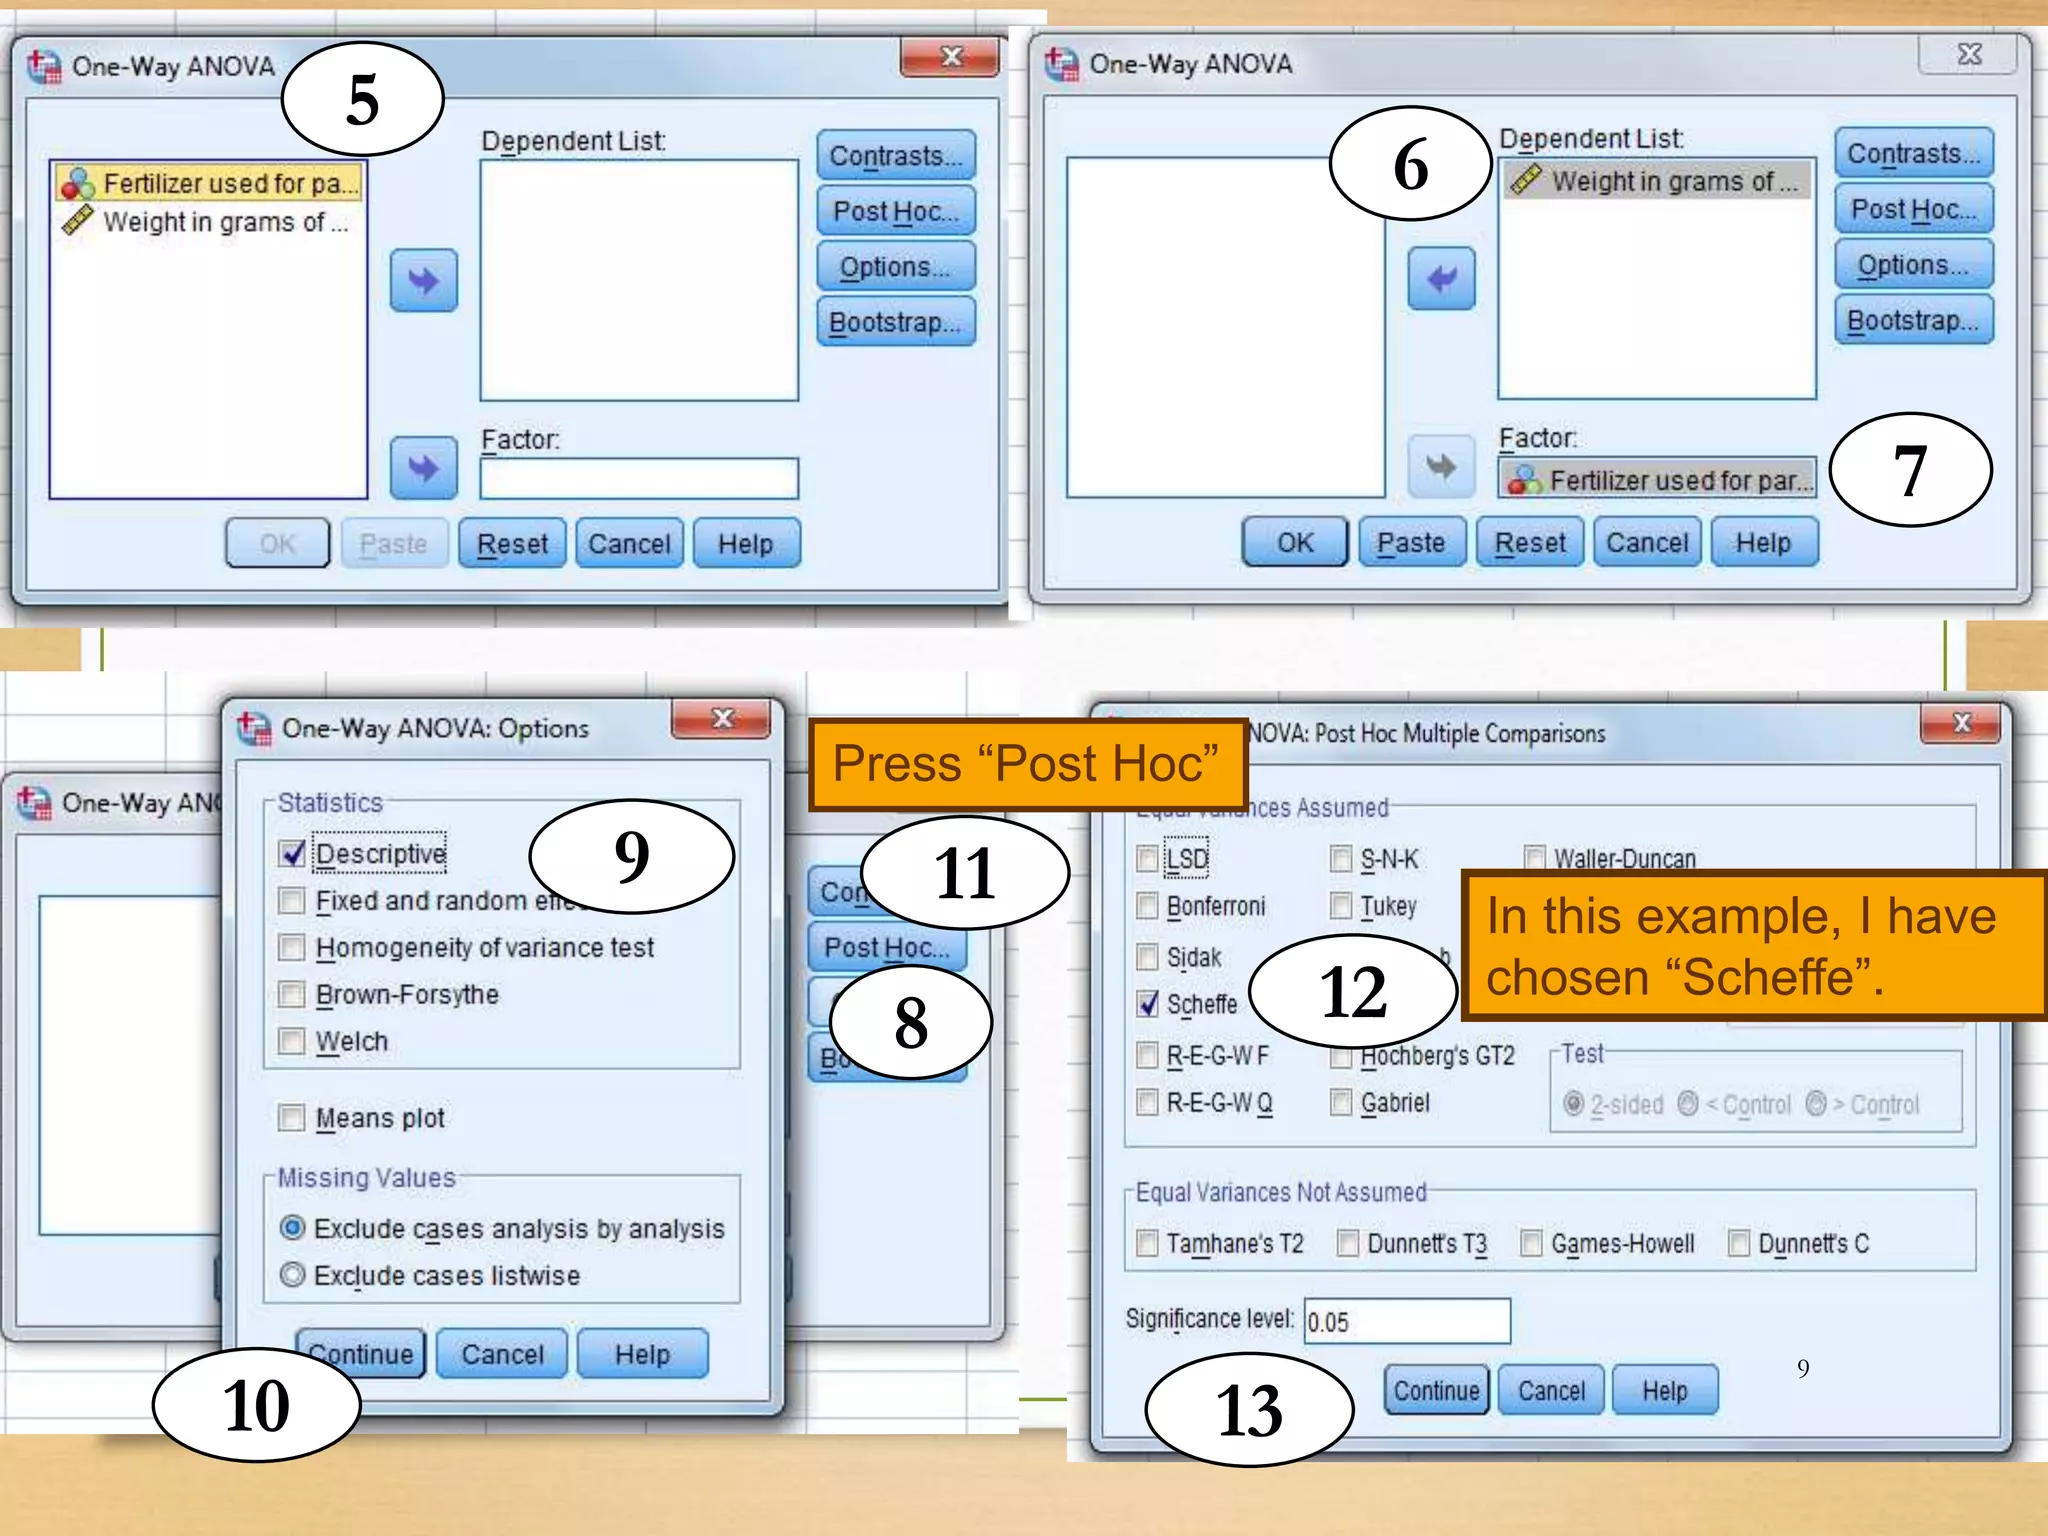
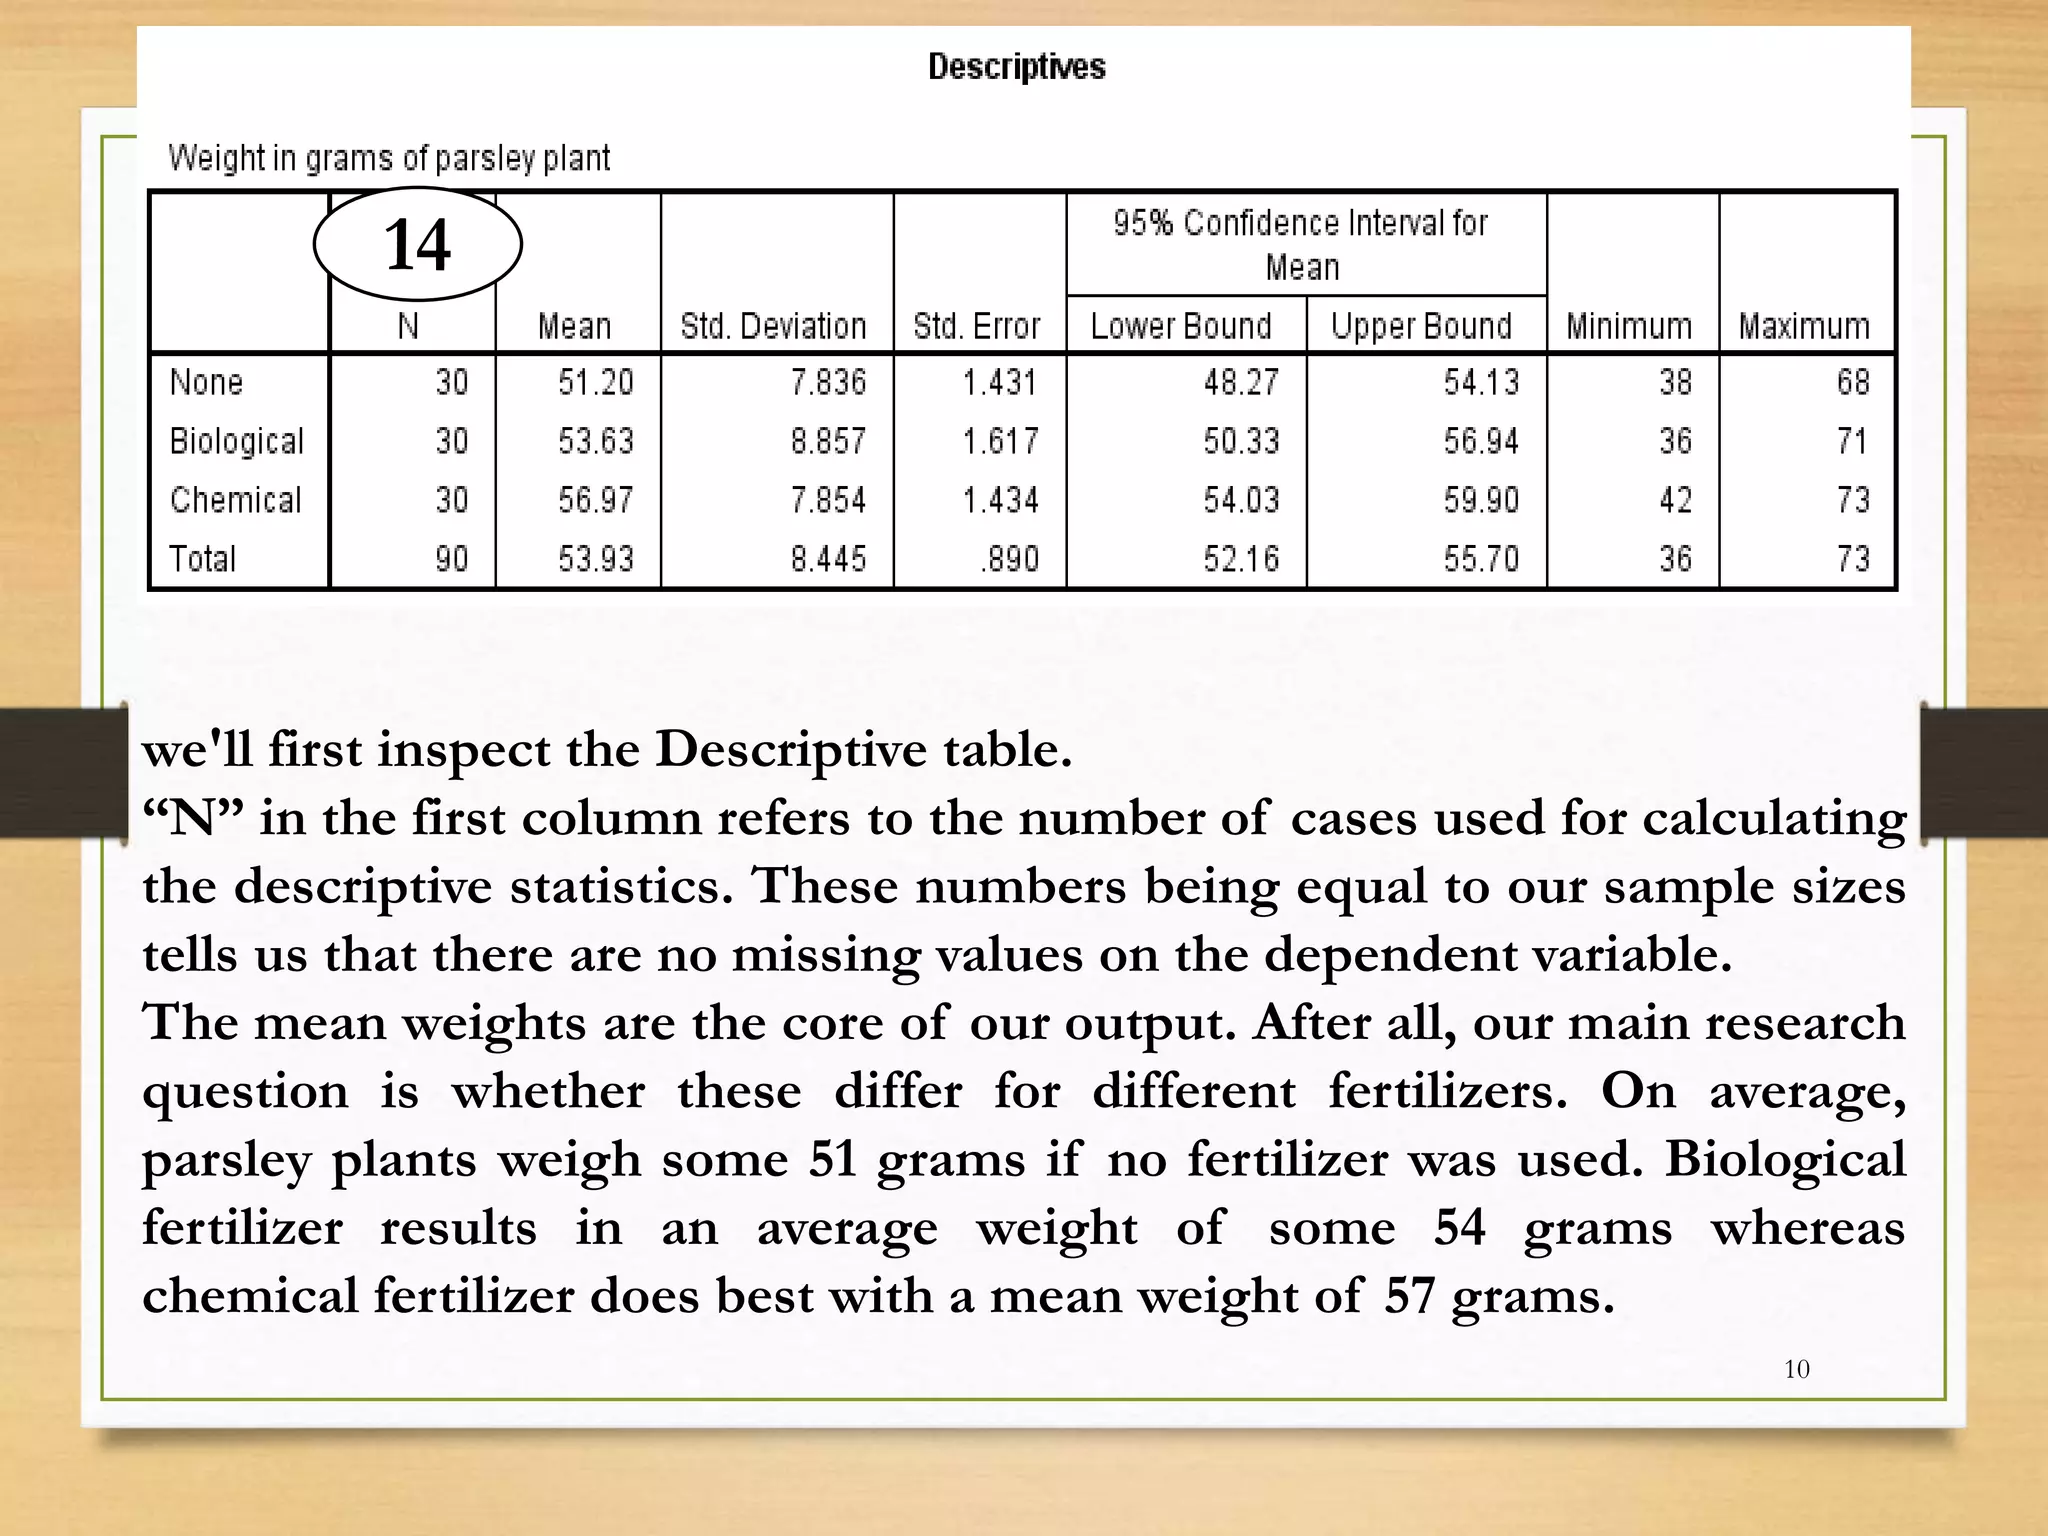
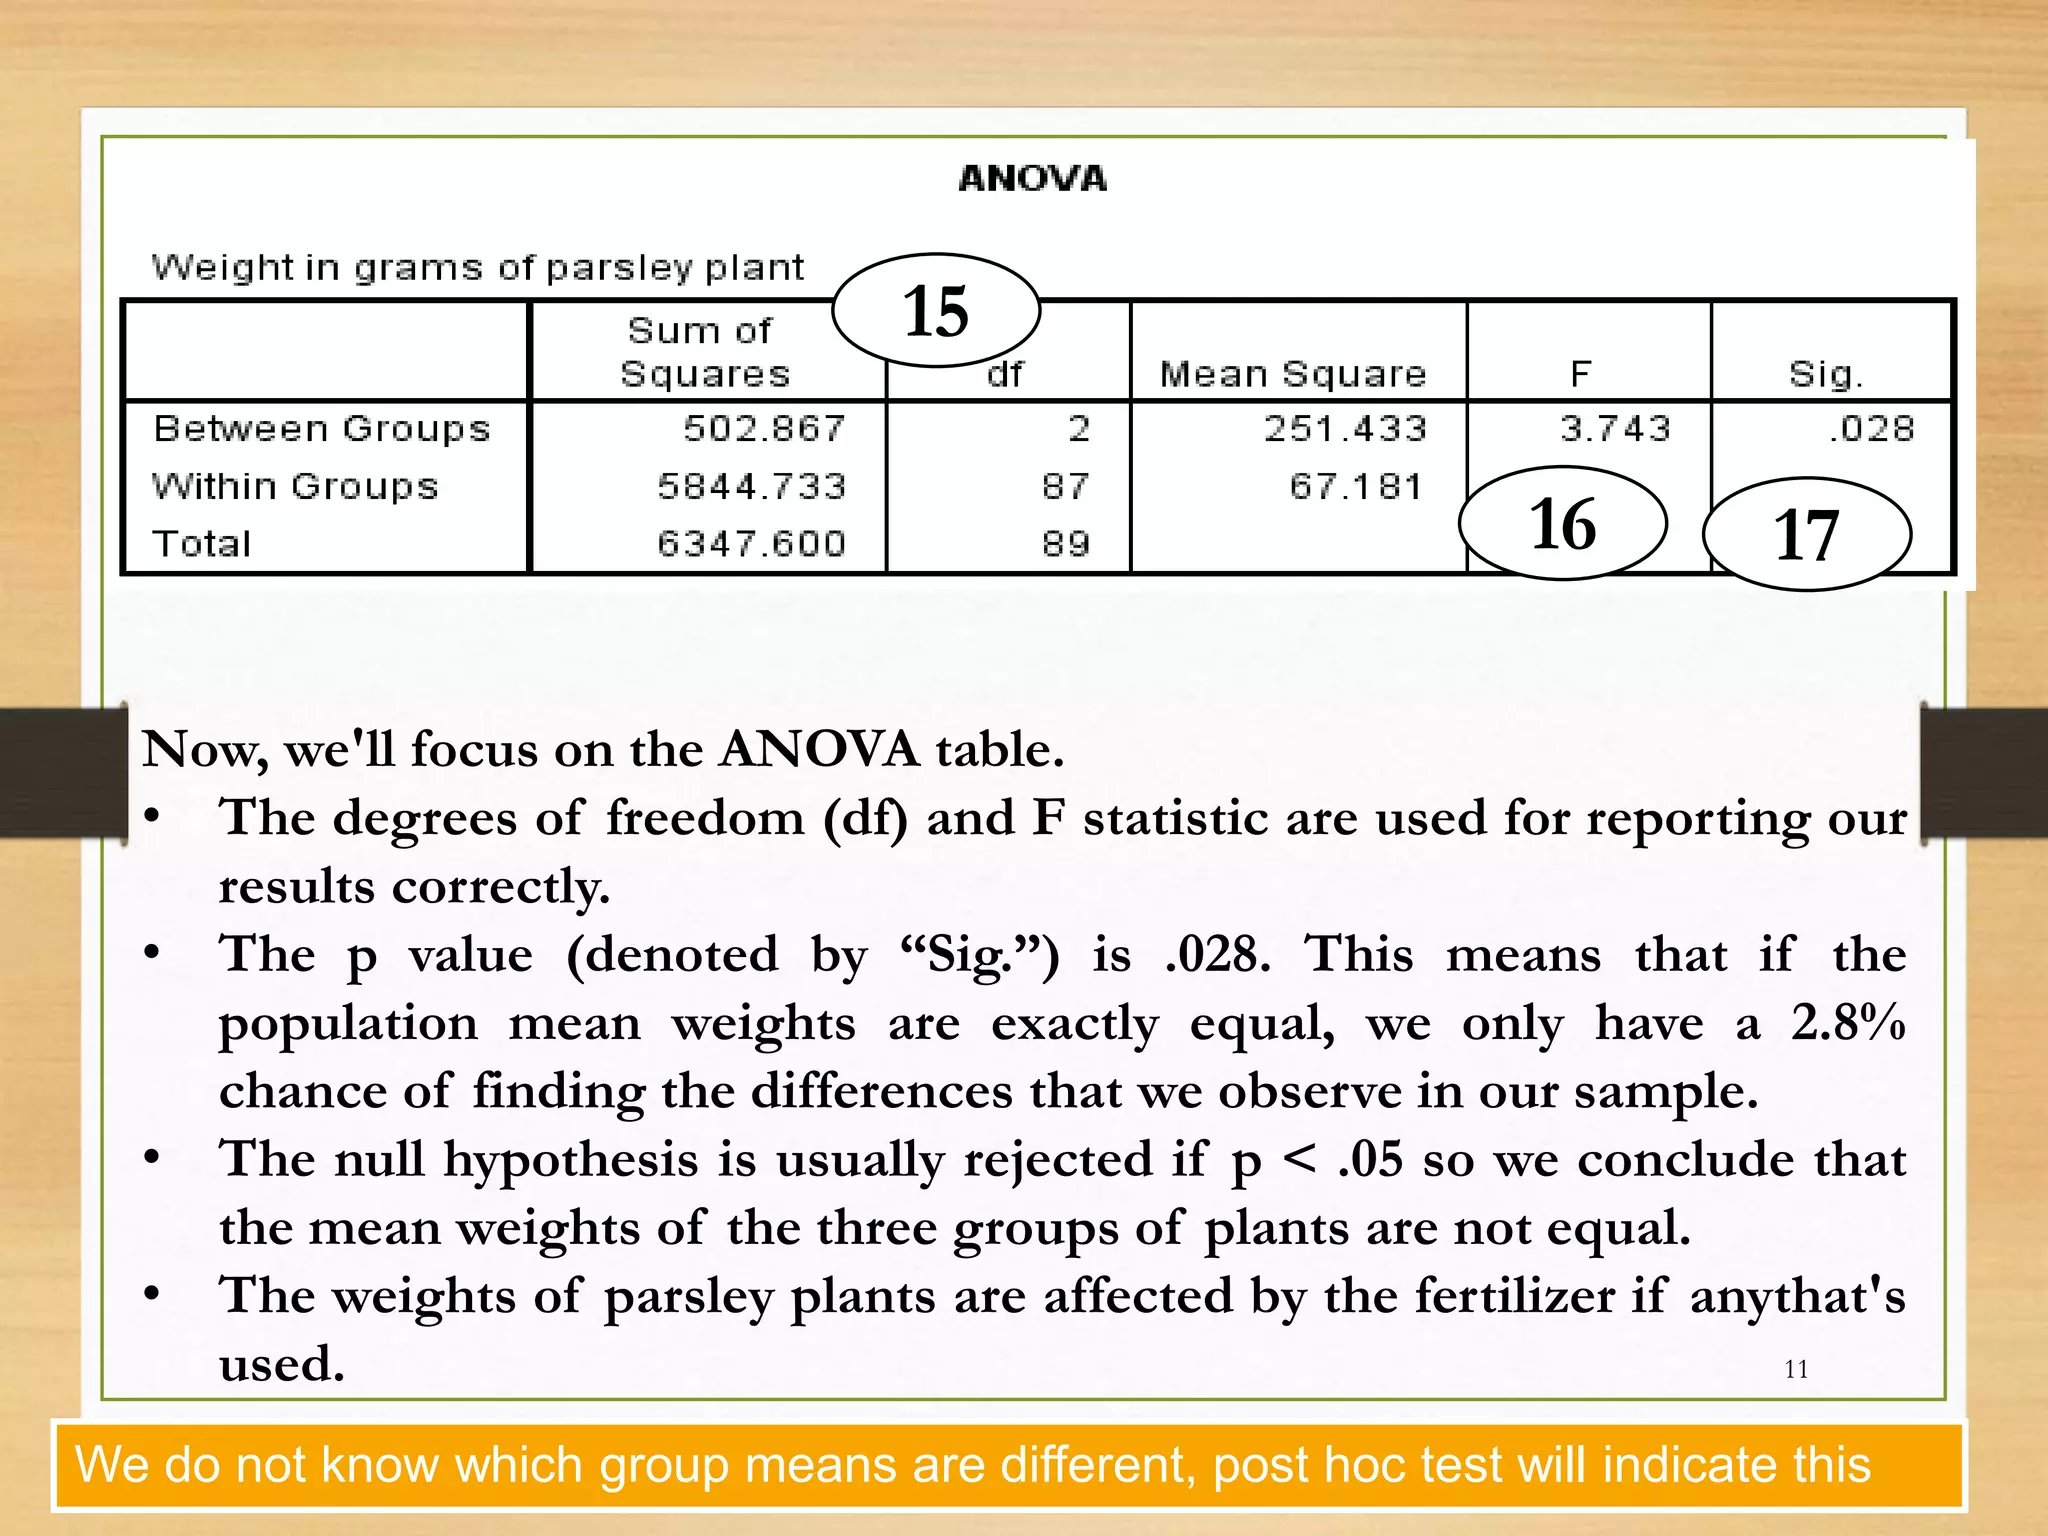
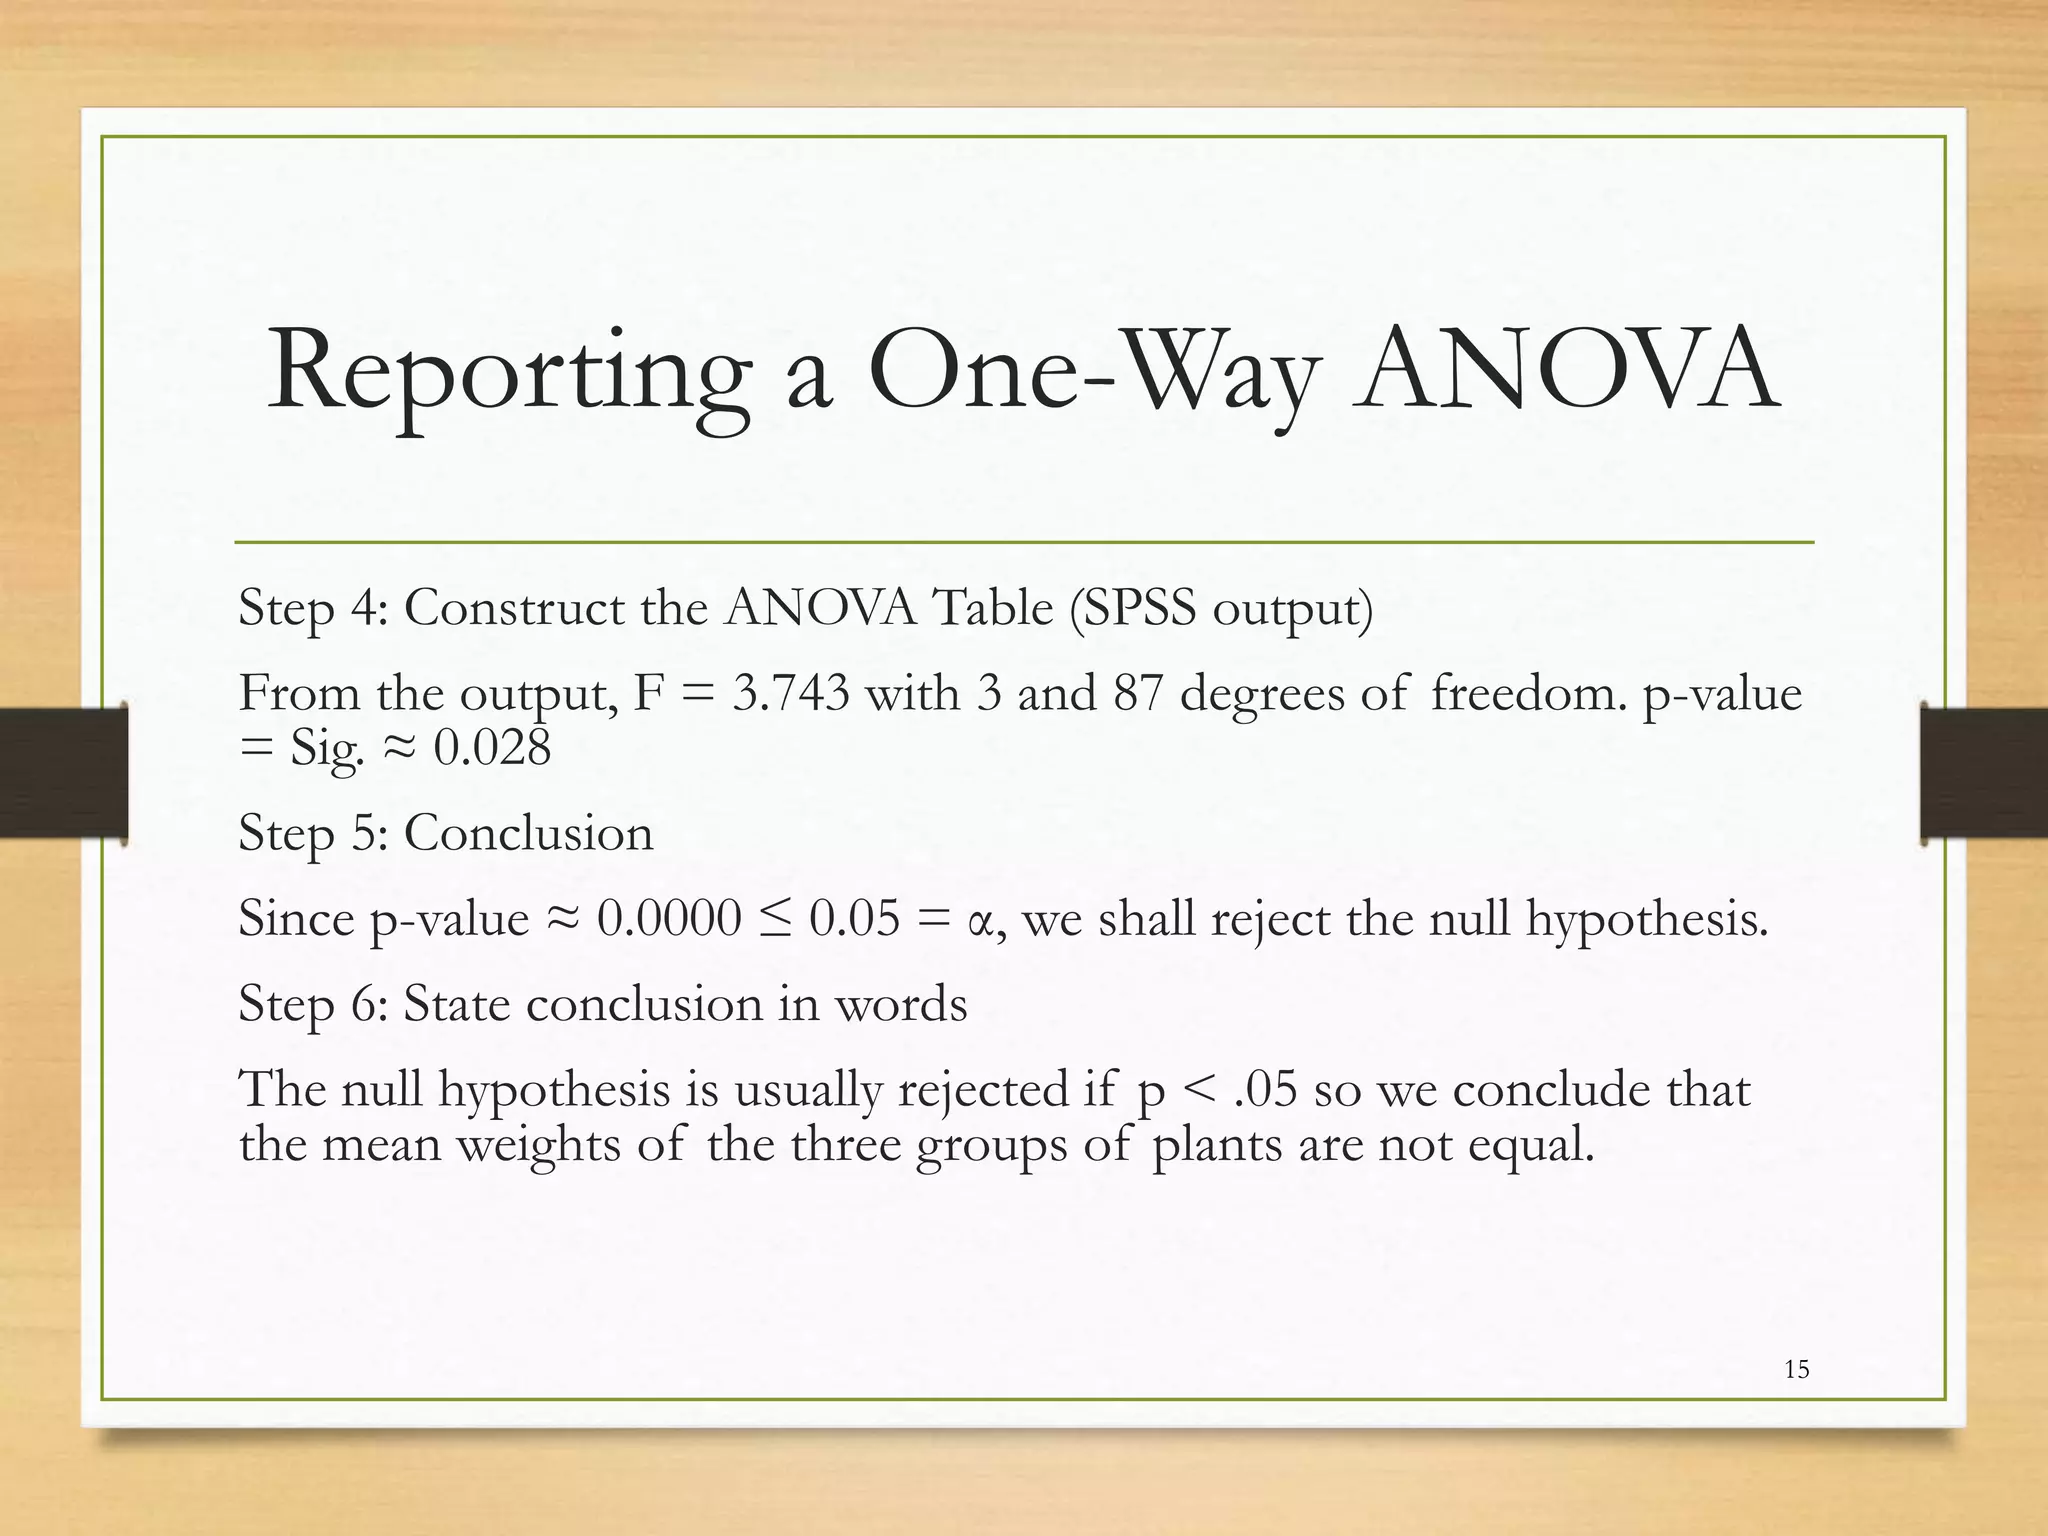
Steps on how to conduct One-Way ANOVA using SPSS; includes dependent and independent variables, ANOVA table, and interpretations.
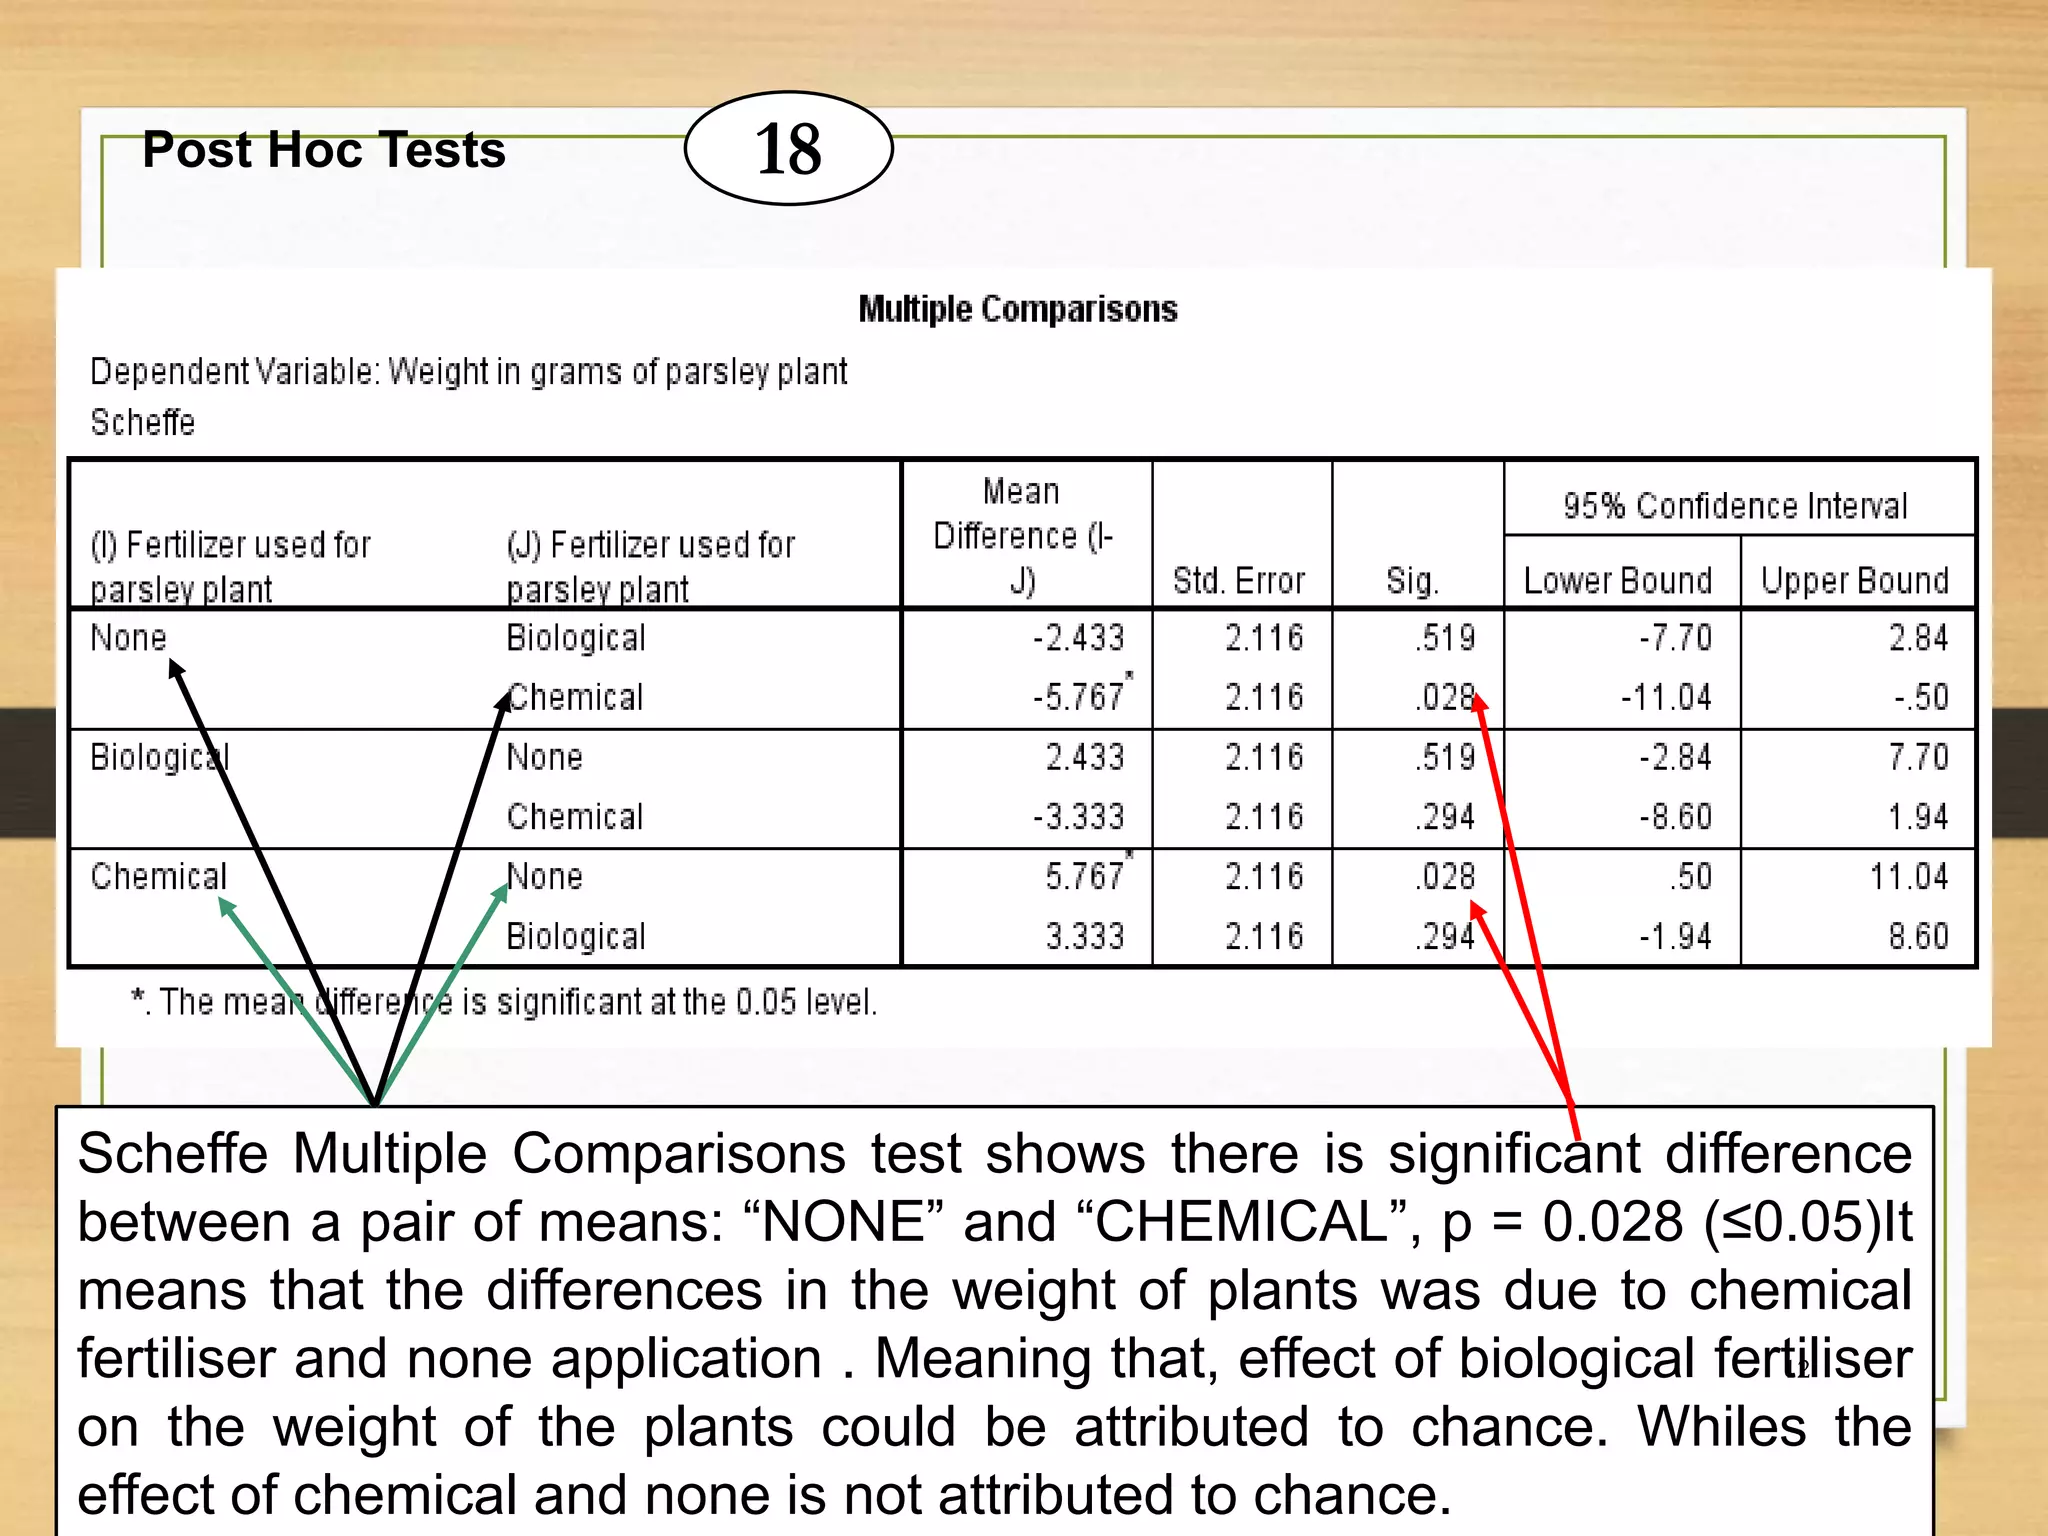
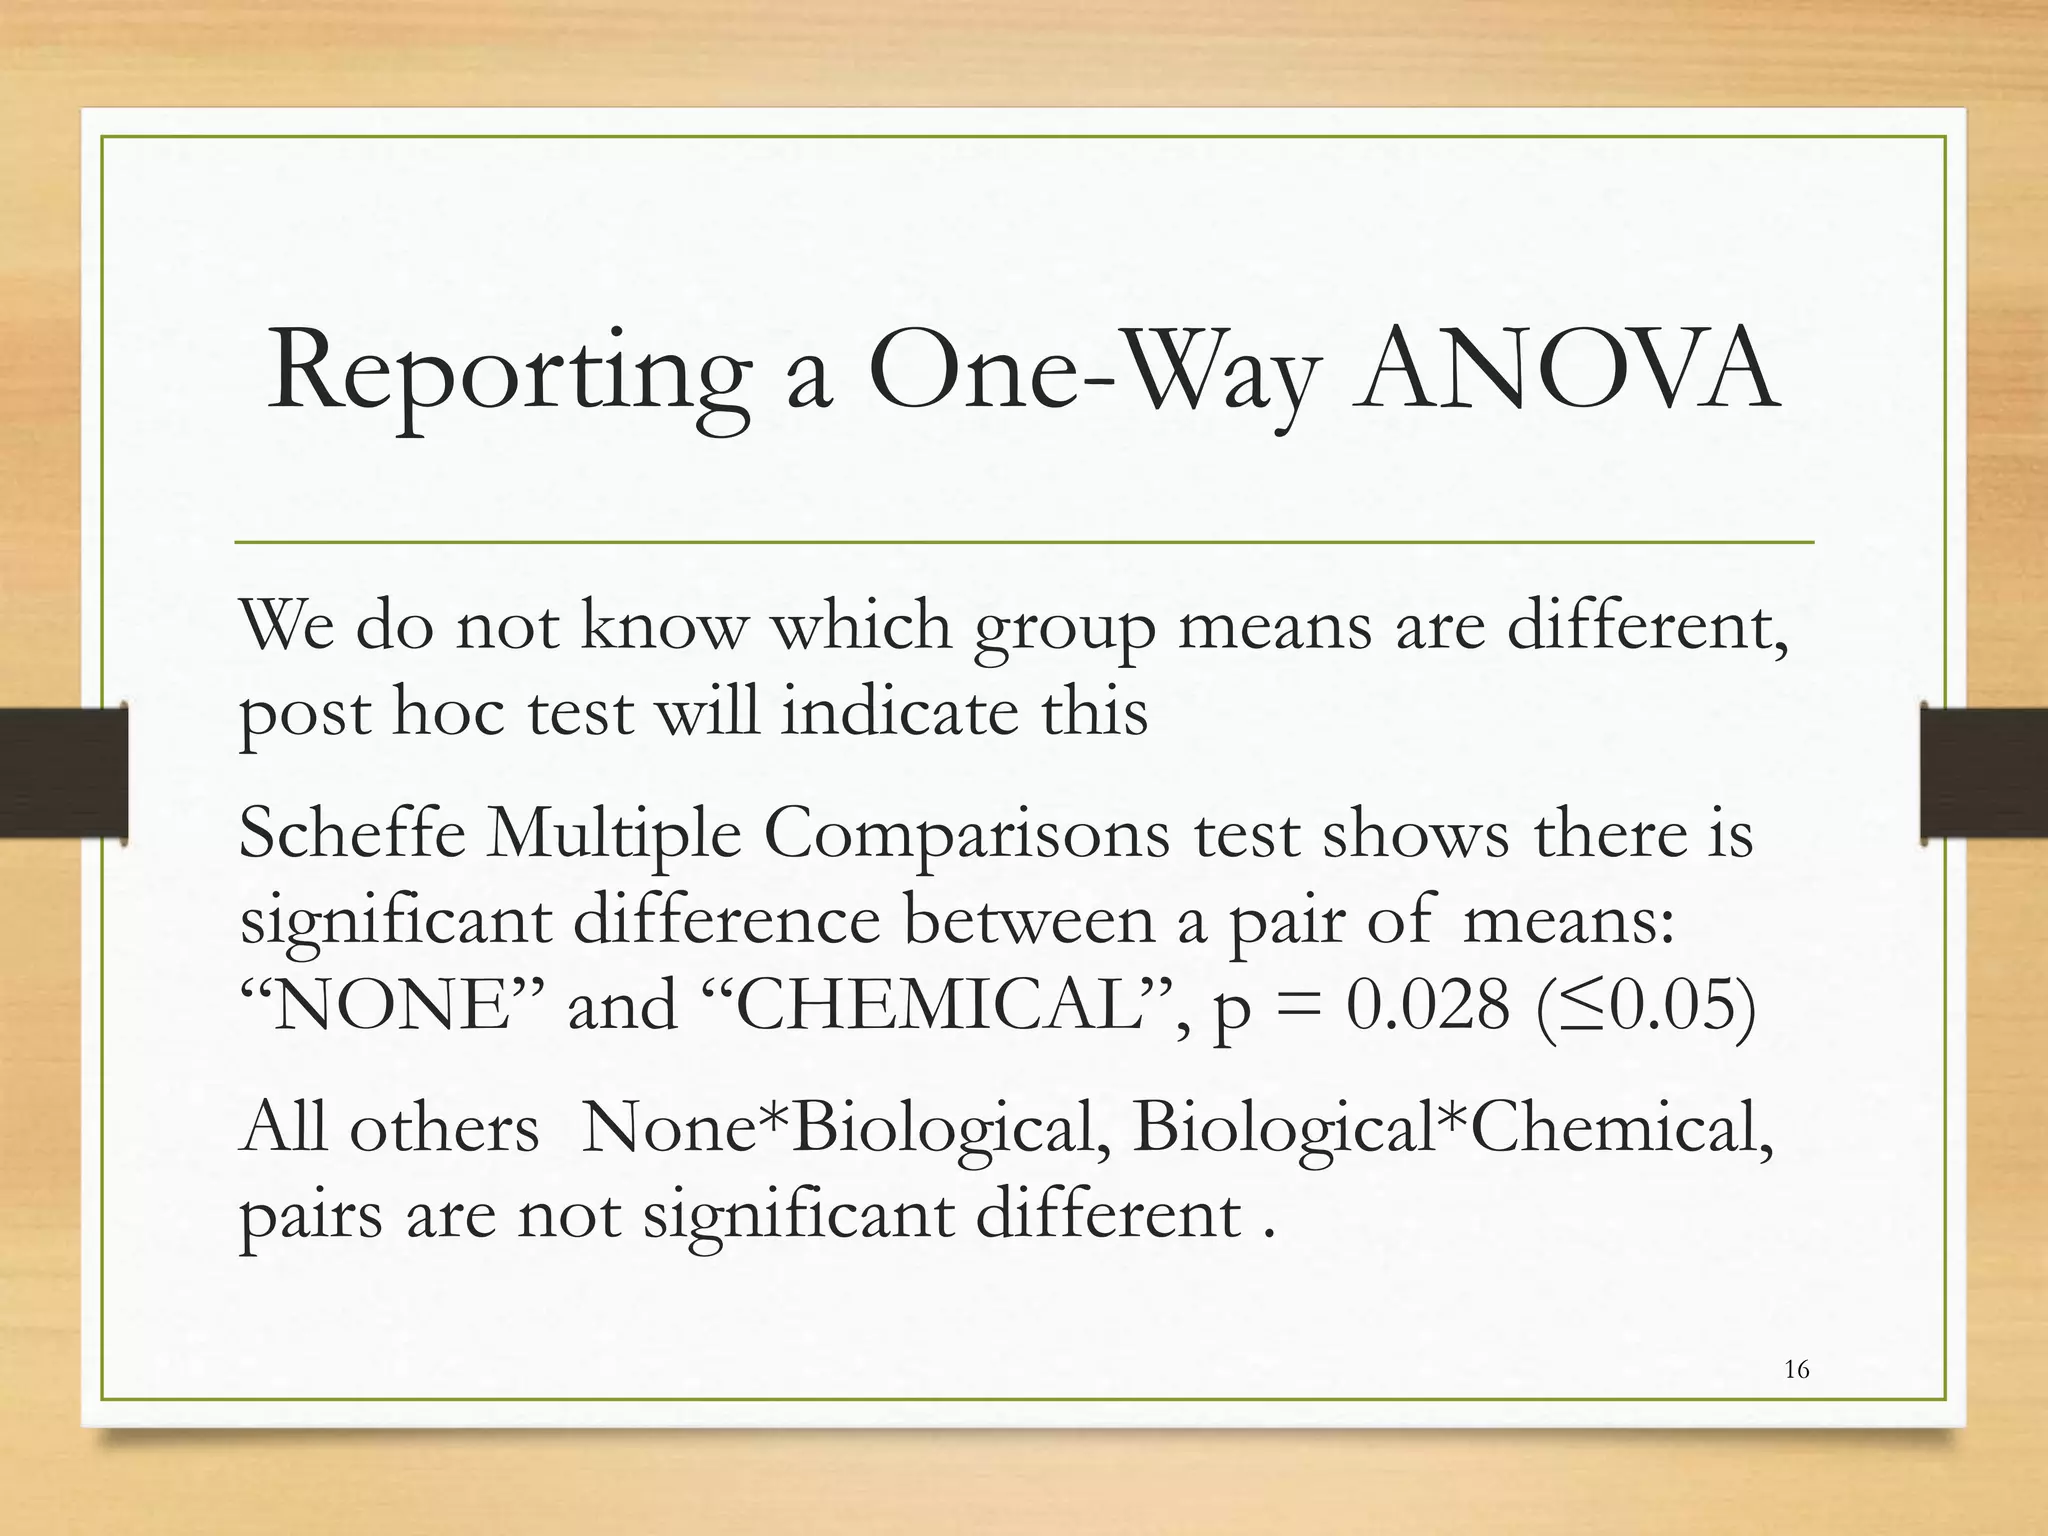
Explanation of Post Hoc tests after obtaining significant F-test results in ANOVA; discusses specific different means found.
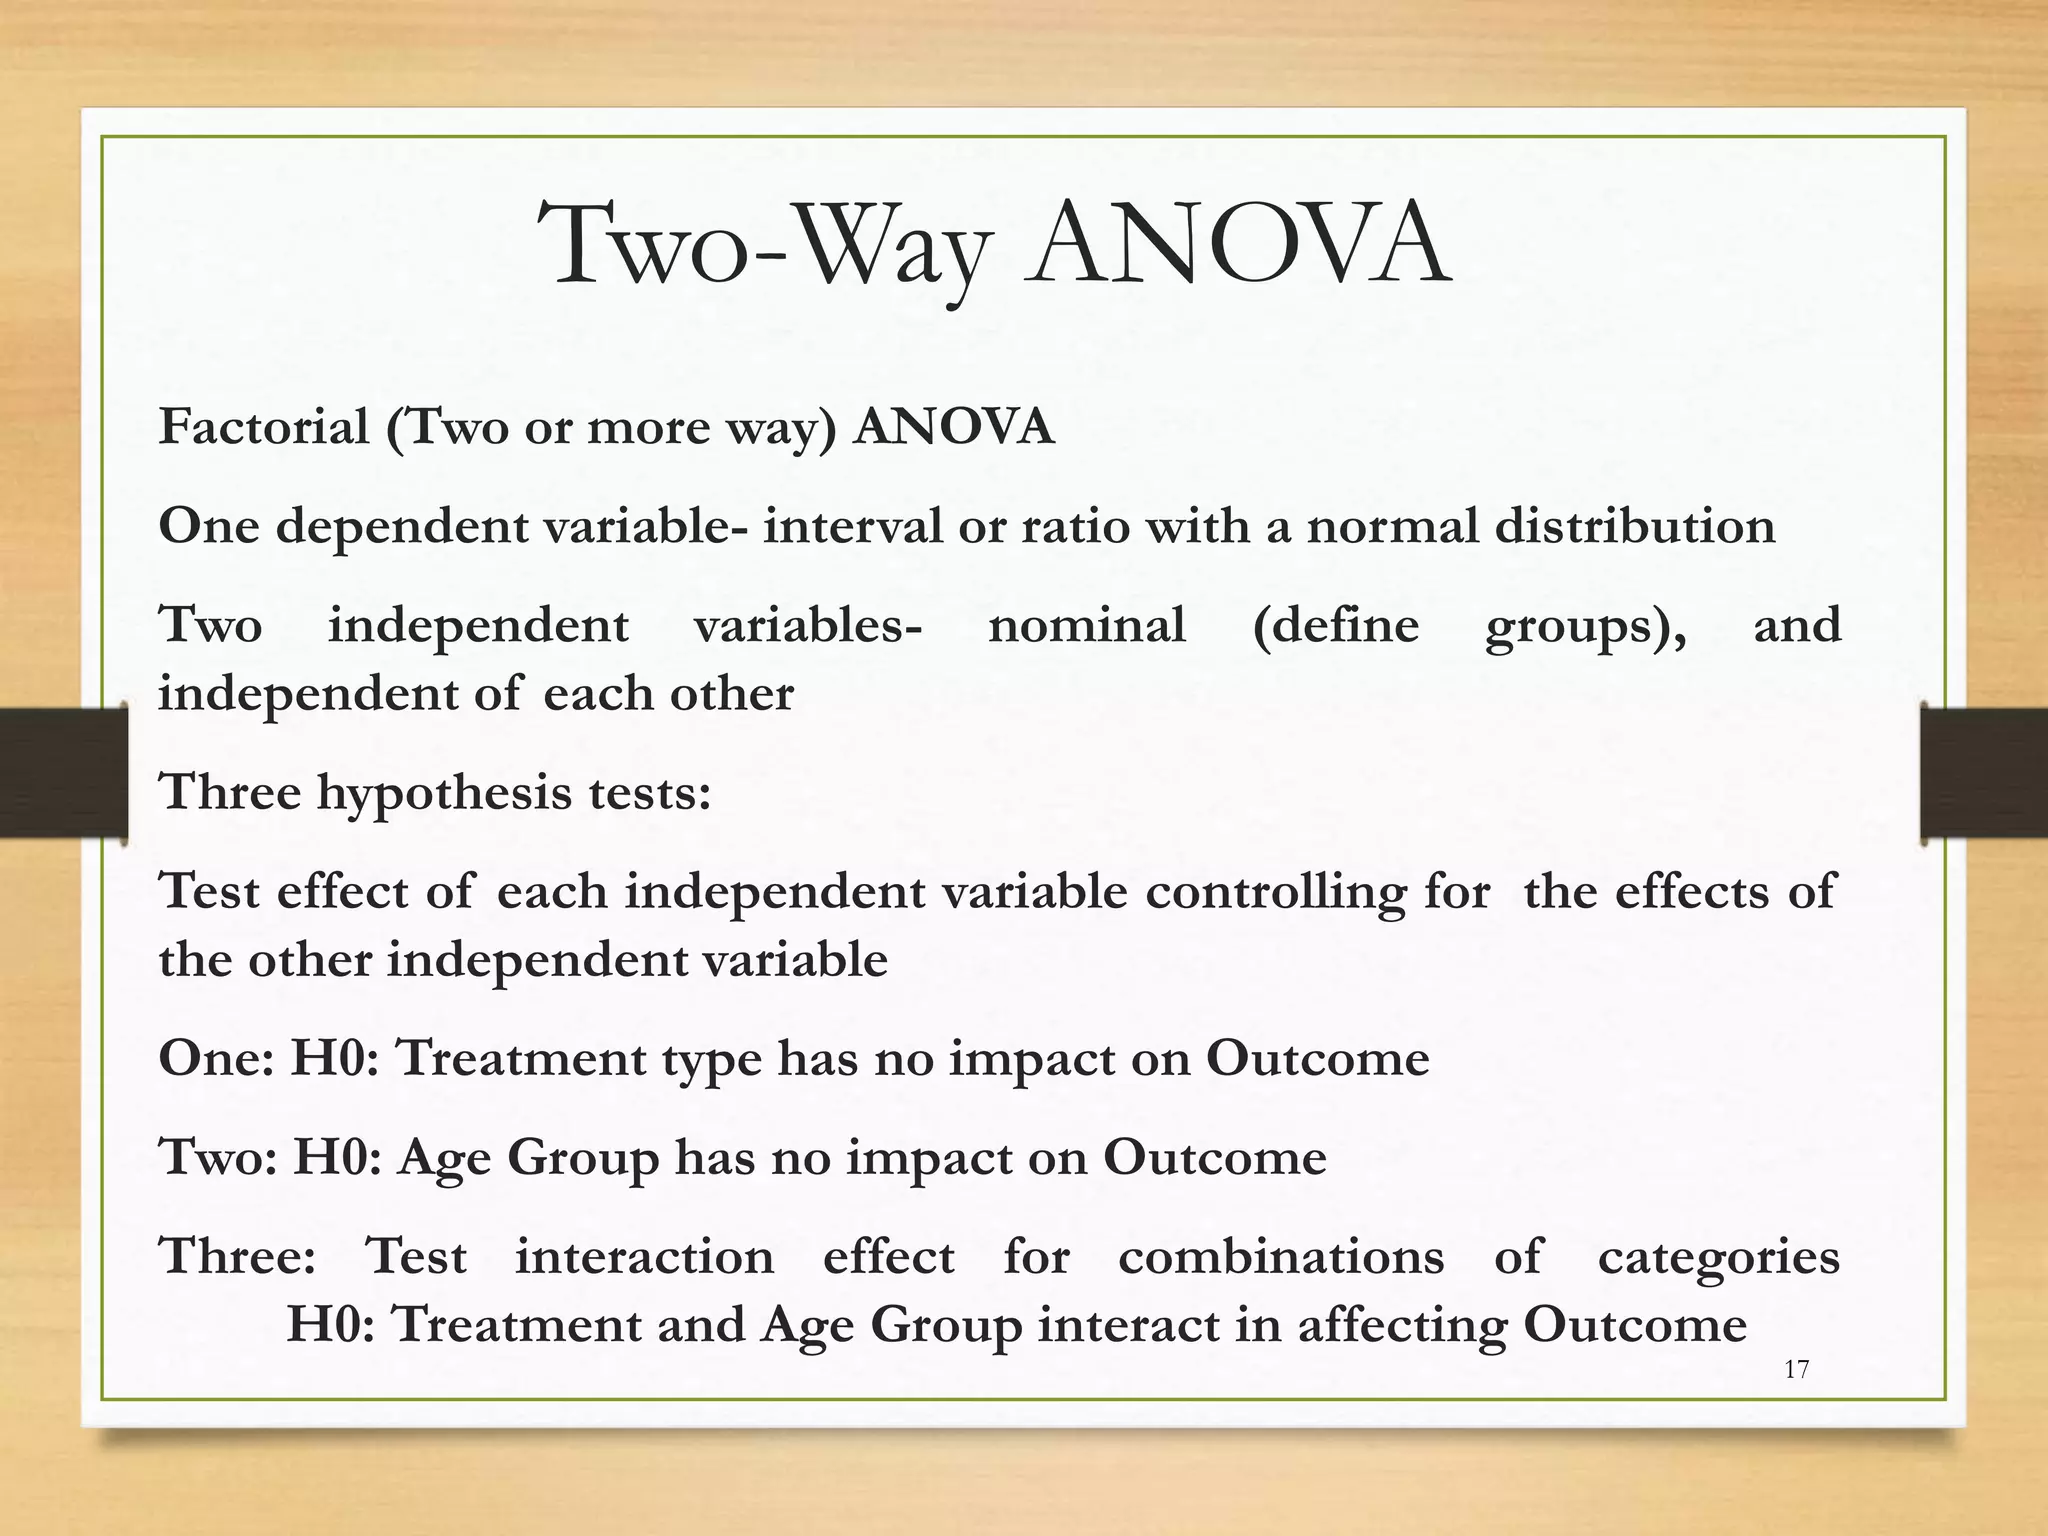
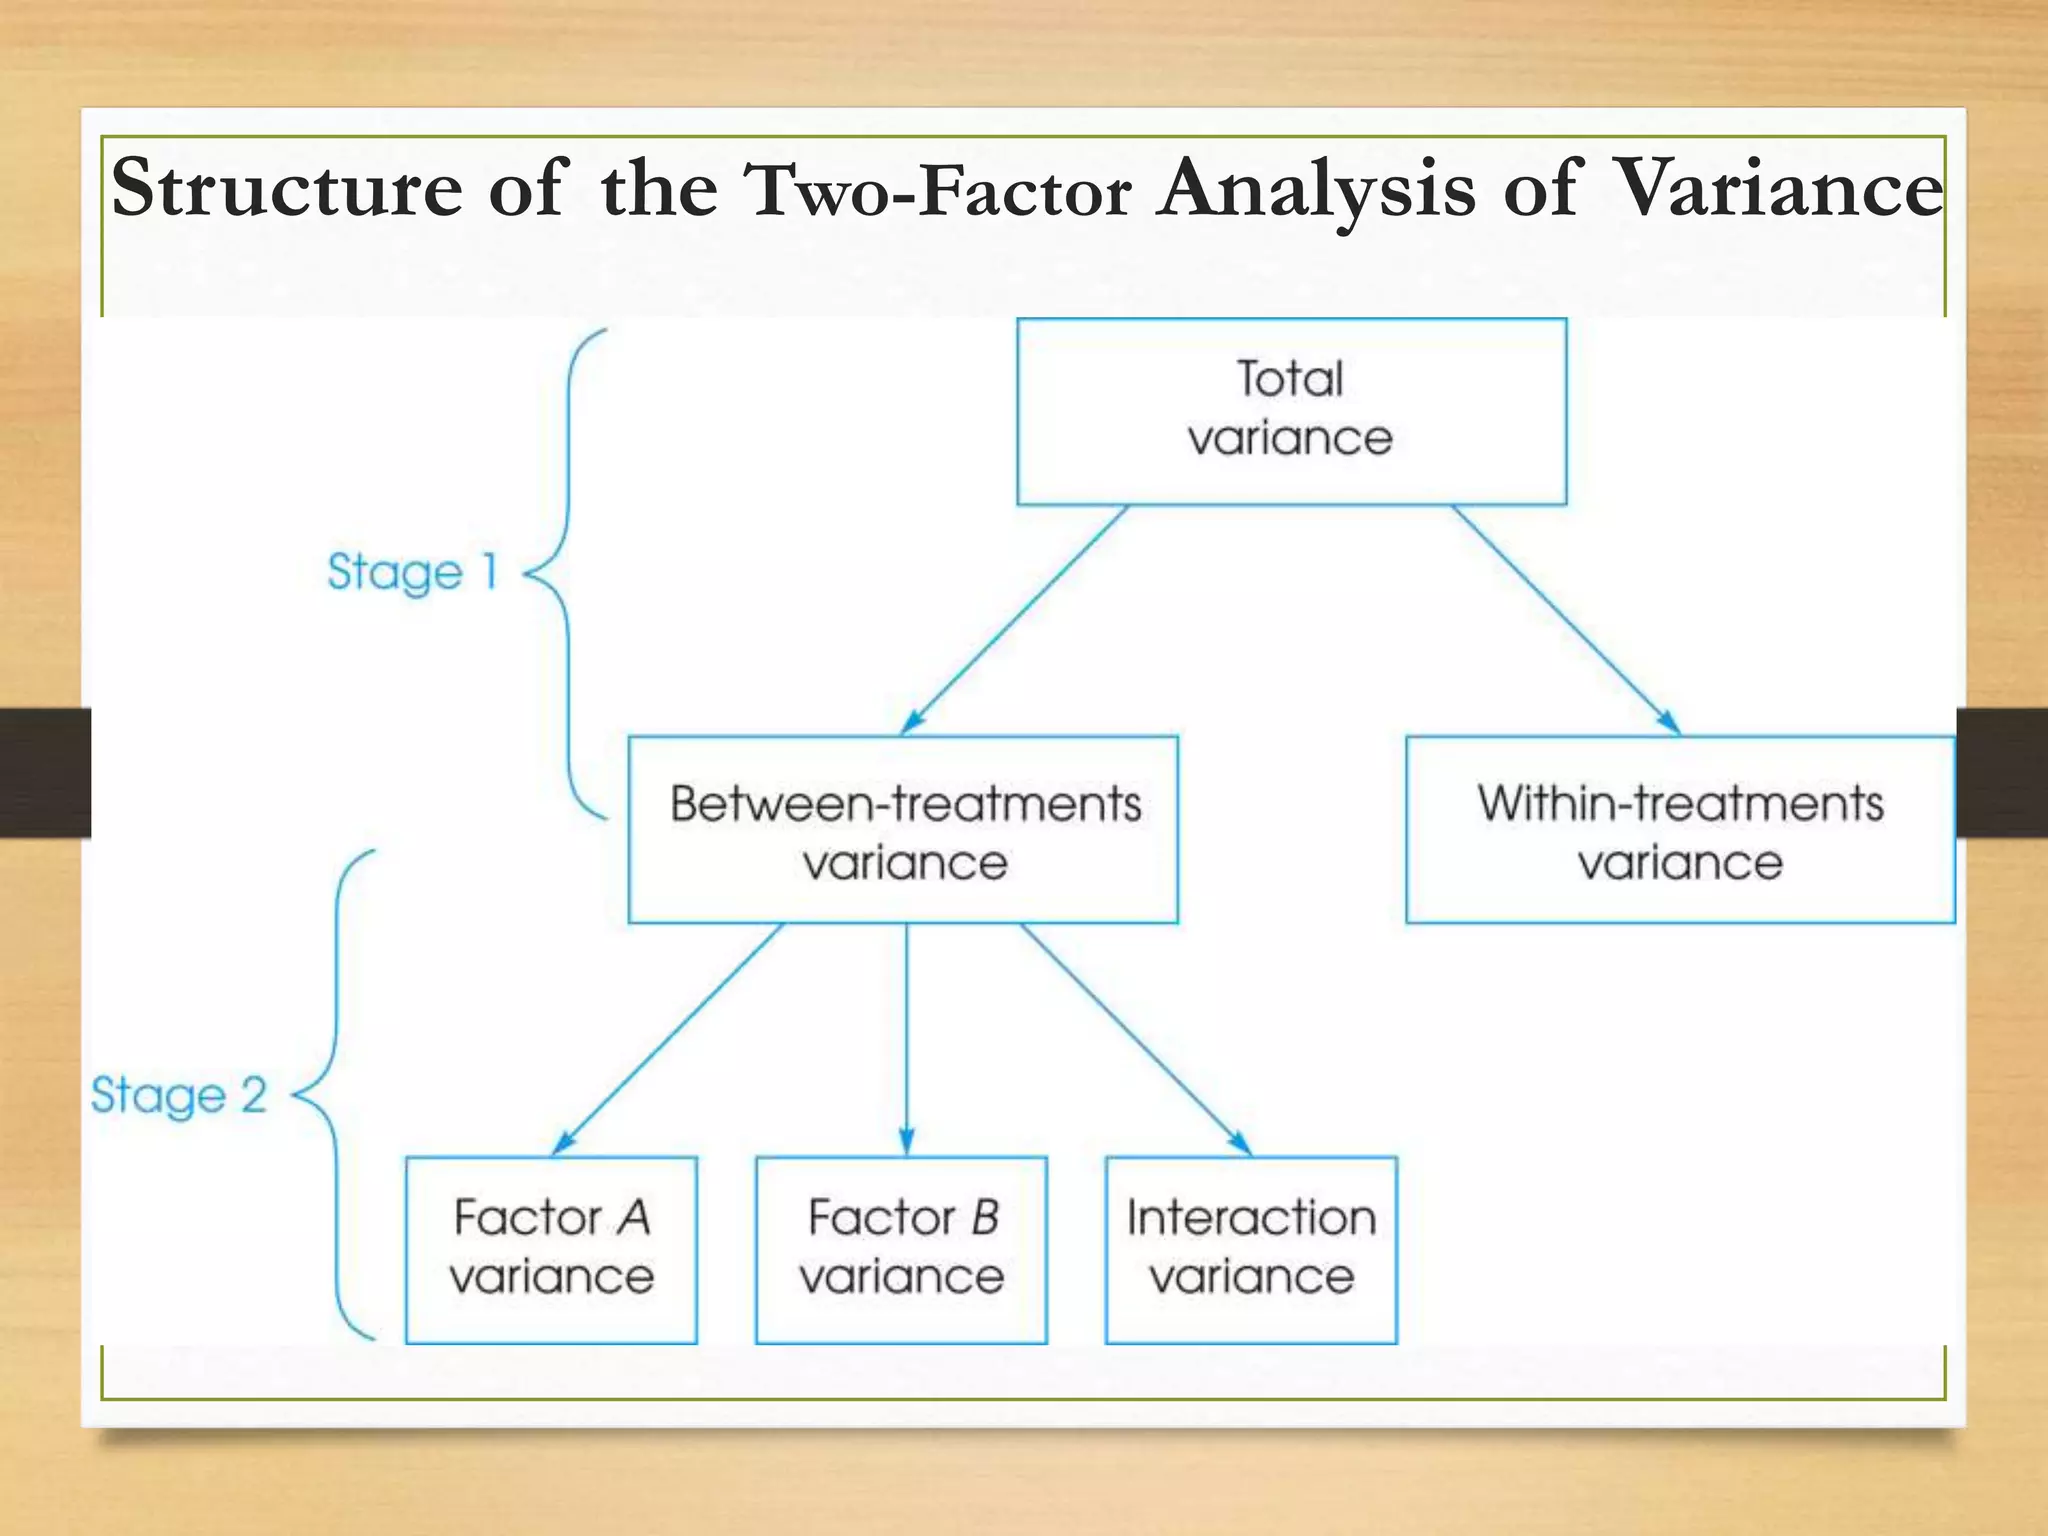
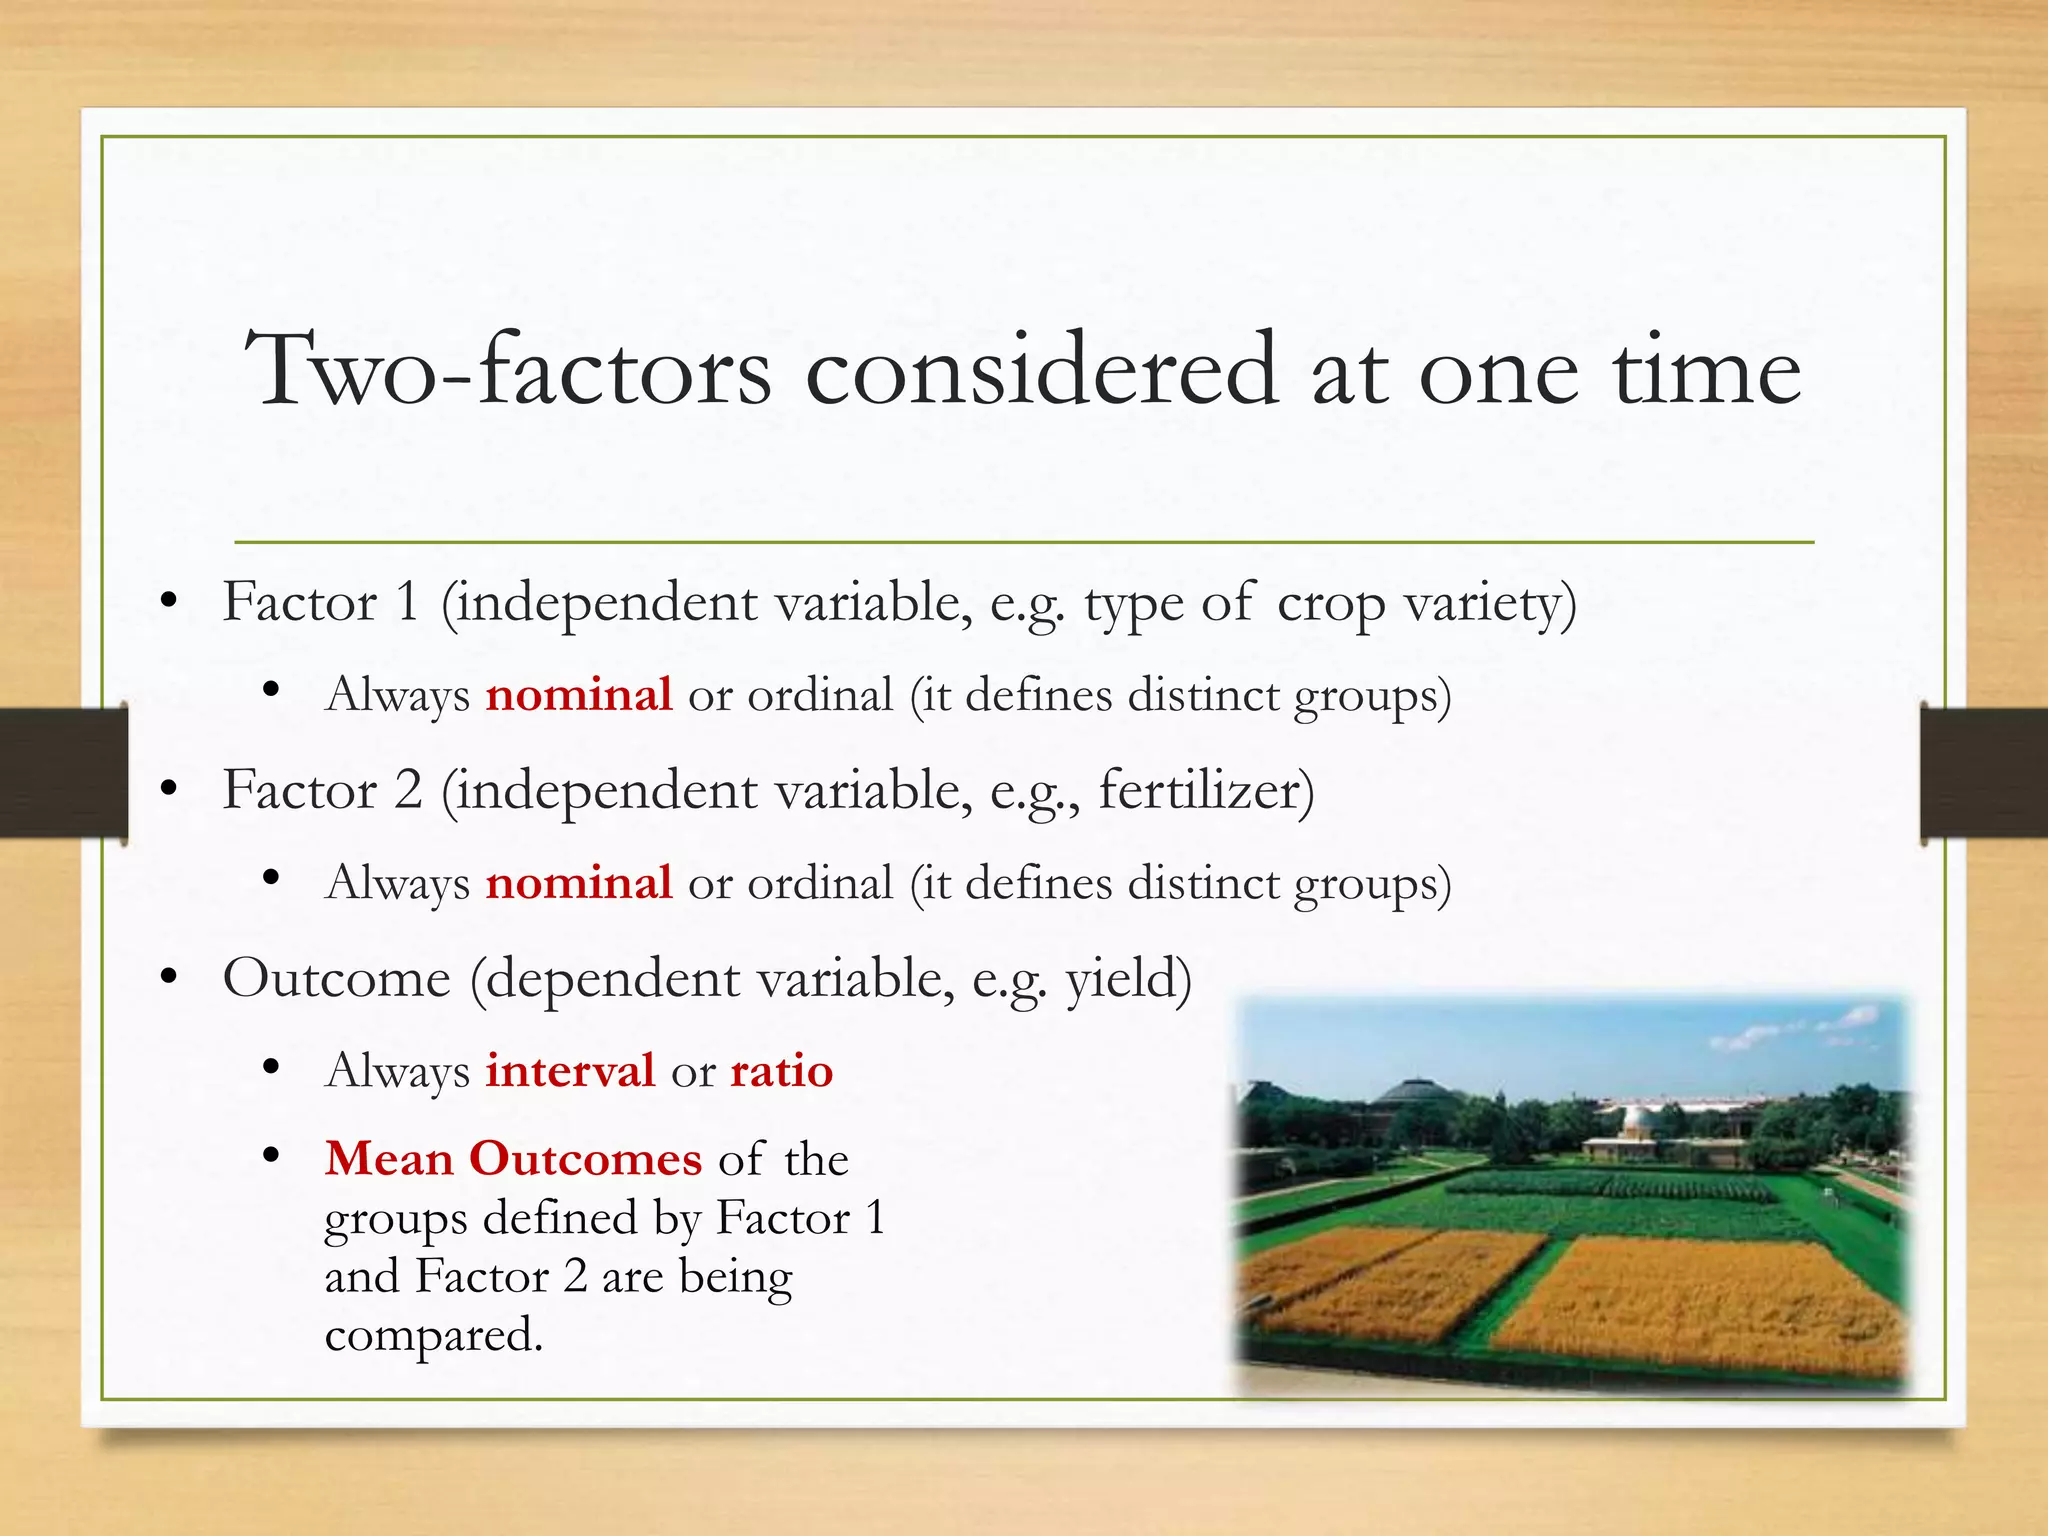
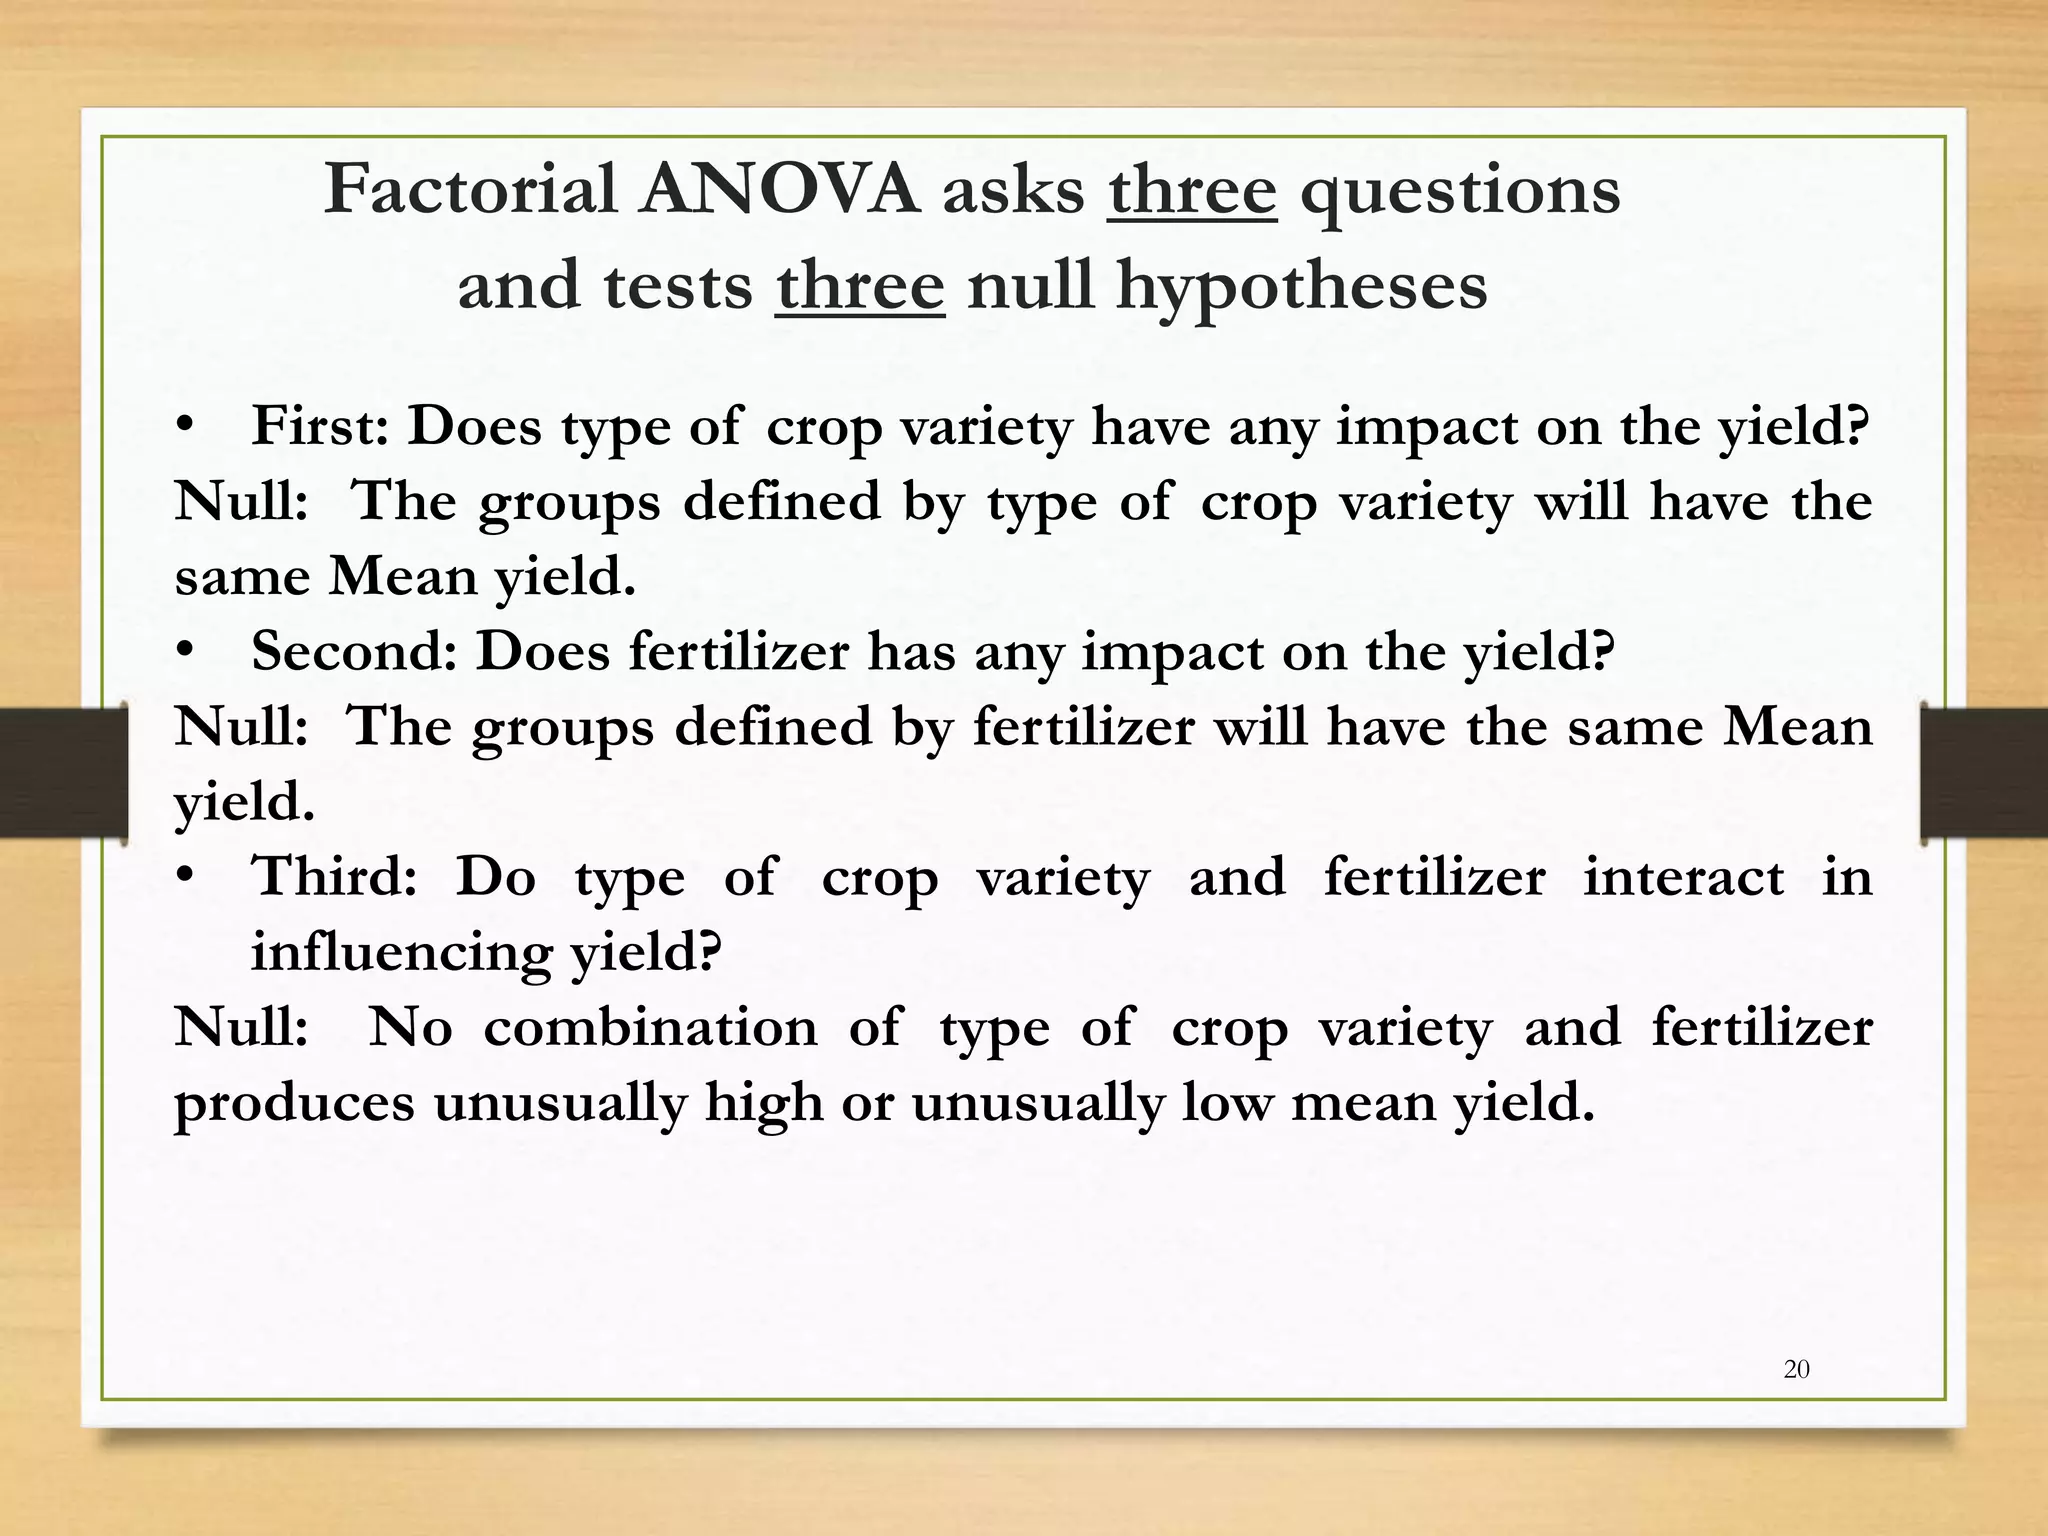
Introduction to Factorial ANOVA covering two independent variables and their impact on outcomes, including testing interactions.
Concluding remarks of the presentation.


