Reporting Statistics in Psychology
This document provides guidelines for reporting statistics in psychology research. It outlines how to round numbers and report means, standard deviations, p-values, effect sizes, and results from t-tests, ANOVAs, and other statistical analyses. Key recommendations include reporting exact p-values to two or three decimal places, using abbreviations like M and SD consistently, and noting any violations of statistical assumptions.

![Reporting Statistics in Psychology
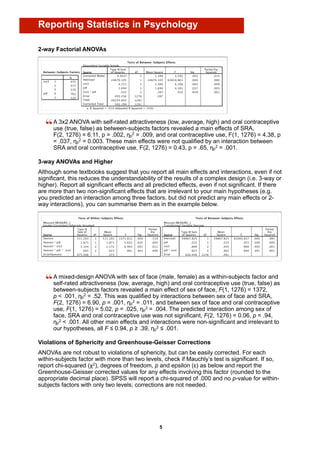
Data were analysed using a mixed-design ANOVA with a within-subjects factor of
subscale (pathogen, sexual, moral) and a between-subject factor of sex (male, female).
Mauchly’s test indicated that the assumption of sphericity had been violated
(χ2(2) = 16.8, p < .001), therefore degrees of freedom were corrected using
Greenhouse-Geisser estimates of sphericity (ε = 0.98). Main effects of subscale,
F(1.91, 1350.8) = 378, p < .001, ηp2 = .35, and sex, F(1, 709) = 78.8, p < .001, ηp2 = .
10, were qualified by an interaction between subscale and sex, F(1.91, 1351) = 30.4,
p < .001, ηp2 = .041.
ANCOVA
An ANCOVA [between-subjects factor: sex (male, female); covariate: age] revealed no
main effects of sex, F(1, 732) = 2.00, p = .16, ηp2 = .003, or age, F(1, 732) = 3.25,
p = .072, ηp2 = .004, and no interaction between sex and age, F(1, 732) = 0.016,
p = .90, ηp2 < .001.
The predicted main effect of sex was not significant, F(1, 732) = 2.00, p = .16,
ηp2 = .003, nor was the predicted main effect of age, F(1, 732) = 3.25, p = .072,
ηp2 = .004. The interaction between sex and age were also not significant,
F(1, 732) = 0.016, p = .90, ηp2 < .001.
6](https://image.slidesharecdn.com/reportingstatisticsinpsychology-120919161009-phpapp01/85/Reporting-statistics-in-psychology-6-320.jpg)