Downloaded 200 times


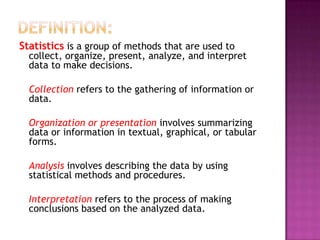
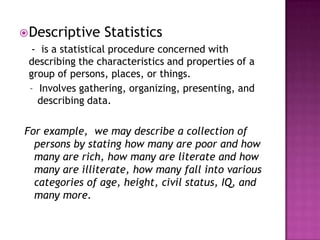
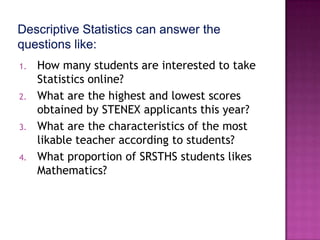

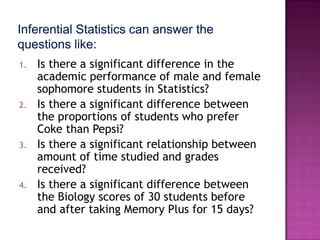
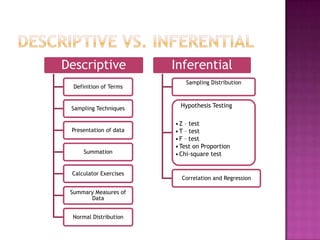


Statistics involves collecting, organizing, presenting, analyzing, and interpreting data to make decisions. Descriptive statistics describes characteristics and properties of a group through gathering, organizing, presenting, and describing data. Inferential statistics draws inferences about a large group based on a sample through inductive reasoning and hypothesis testing. The examples provided illustrate common uses of descriptive and inferential statistics.