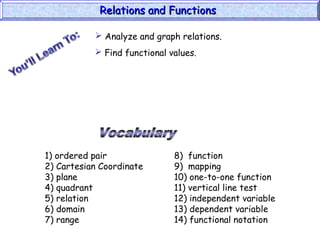
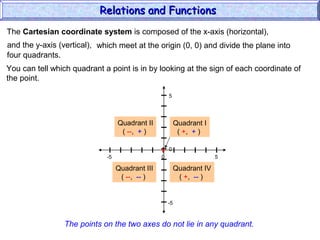
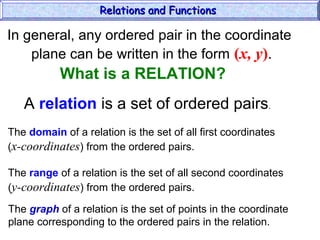
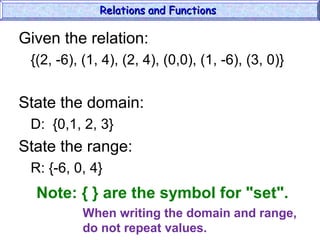
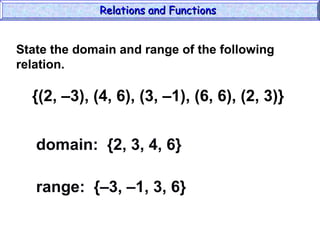
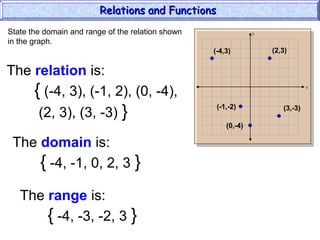
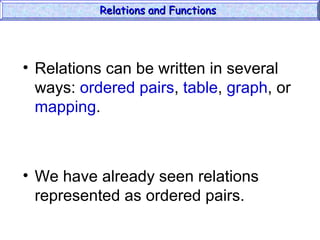
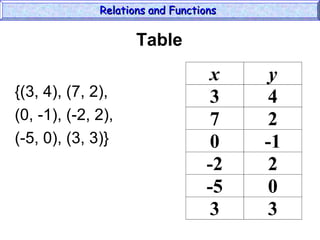
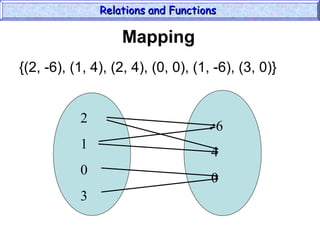
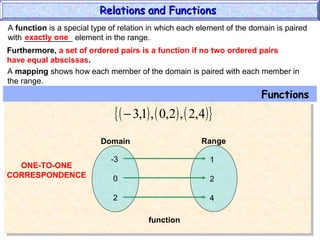
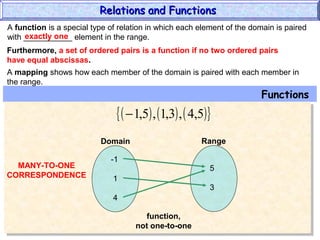
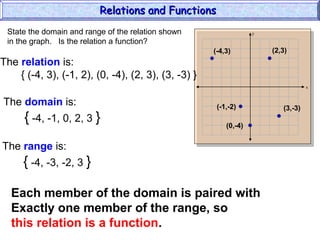
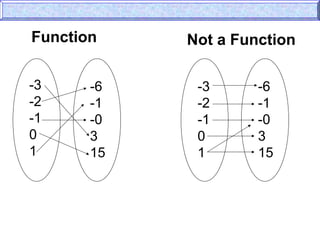
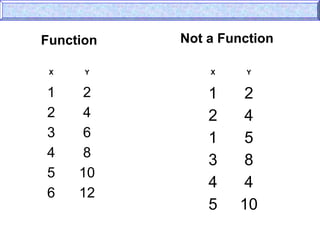
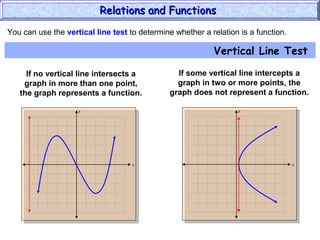
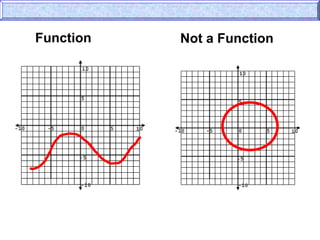
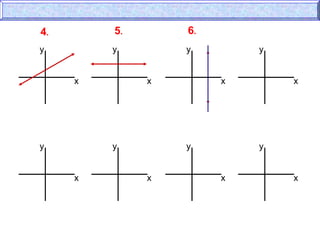
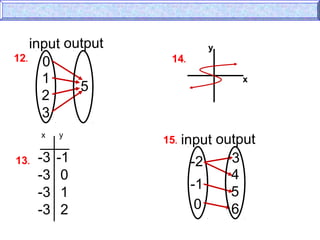
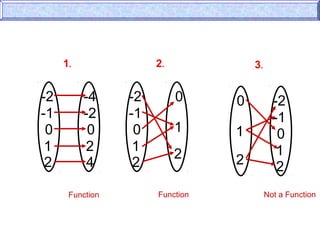
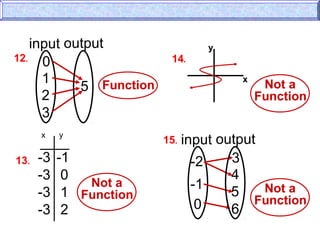
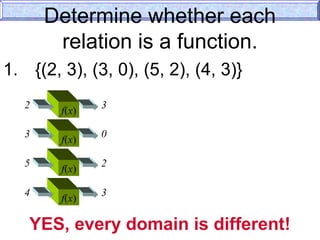
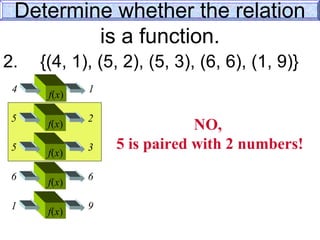
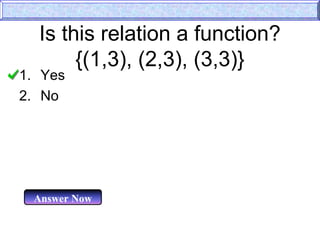
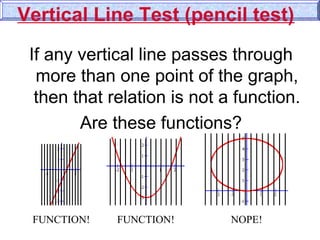
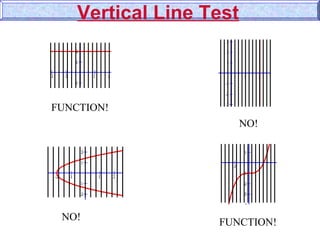
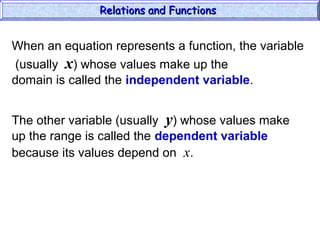
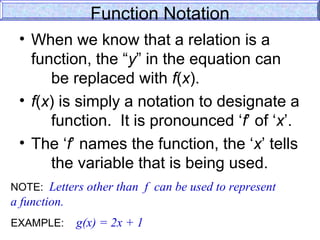
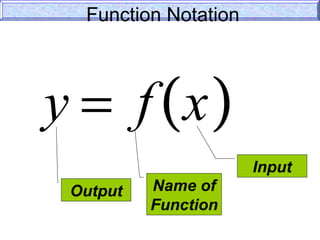
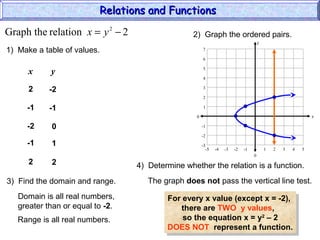
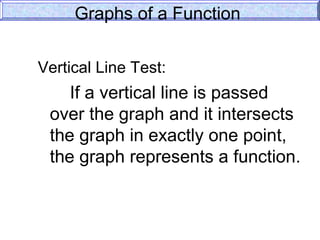
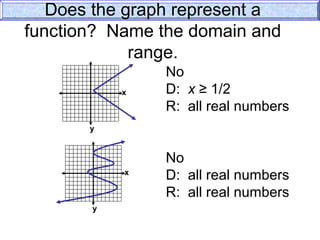
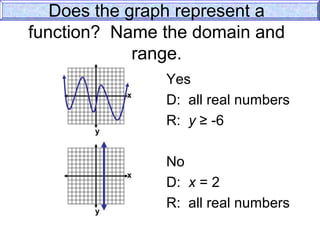
The document provides information about relations and functions:
- It defines key terms like relation, domain, range, ordered pair, and function.
- It explains how to represent relations using ordered pairs, tables, graphs, and mappings.
- It discusses how to determine if a relation is a function using the vertical line test or by checking if each domain value is mapped to only one range value.
- It distinguishes between independent and dependent variables in functional notation.
The document defines relations and functions. A relation is a set of ordered pairs, while a function is a special type of relation where each x-value is mapped to only one y-value. The domain is the set of x-values and the range is the set of y-values. Functions can be identified using the vertical line test or by mapping the relation to check if any x-values are mapped to multiple y-values. Evaluating functions involves substituting domain values into the function rule to find the corresponding range values.
This document discusses functions and relations. It defines a relation as a set of ordered pairs that associates each element of one set with an element of another set. A function is a special type of relation where each element of the first set is mapped to exactly one element of the second set. The document provides examples of relations and functions using sets, tables, graphs and equations. It describes key characteristics of functions, such as the vertical line test, and discusses classifying relations as functions or not functions. The learning objectives are for students to illustrate relations and functions, verify if a relation is a function, and determine dependent and independent variables.
This document discusses linear functions and how to represent them using equations, graphs, and tables of values. It defines a linear function as one that can be written in the form f(x) = mx + b, where m is the slope and b is the y-intercept. Examples are provided to illustrate determining the slope and y-intercept from an equation and representing a linear function using an equation, table of values, or graph. It is explained that a linear function will produce a straight line on a graph and have constant differences in x- and y-coordinates in its table of values.
Linear Equations and Inequalities in One Variablemisey_margarette
The document discusses linear equations and inequalities in one variable. It defines linear equations and inequalities, and describes methods for solving them including: guess-and-check, cover-up, and working backwards. It also covers properties of equality and inequality, and provides examples of solving linear equations and inequalities using these properties and graphical representations of solution sets on number lines.
Division of polynomials follows the same rules as division of real numbers. To divide a polynomial by a monomial, each term of the dividend is divided by the monomial divisor. To divide a polynomial by a polynomial, long division is used by repeatedly determining the quotient and remainder until the division is complete. The steps of long division are shown through an example of dividing a third degree polynomial by a linear polynomial divisor. The quotient and remainder are checked by multiplying the divisor and quotient together.
This document provides instructions on factoring polynomials of various forms:
1) It explains how to factor polynomials by finding the greatest common factor (GCF).
2) It describes how to factor trinomials of the form x2 + bx + c by finding two numbers whose sum is b and product is c.
3) It shows how to factor trinomials of the form ax2 + bx + c by finding factors of a, c whose products and sums satisfy the polynomial.
Polynomial functions have graphs that are smooth and continuous curves without sharp corners or breaks. Odd-degree polynomials have opposite behavior at their ends, while even-degree polynomials have the same behavior. The x-intercepts of a polynomial function are its zeros, which are found by setting the polynomial equal to 0. A polynomial function's graph can have at most n-1 turning points if the function is of degree n.
This document discusses arithmetic sequences and their properties. It defines an arithmetic sequence as a sequence where the difference between consecutive terms is constant. It provides the formula for the nth term of an arithmetic sequence as an = a1 + (n-1)d, where a1 is the first term, n is the term number, and d is the common difference. It gives examples of finding specific terms and summarizing sequences. It also discusses the arithmetic mean and arithmetic sum formulas.
The document defines and provides examples of polynomial functions. It discusses that a polynomial is a sum of monomials with whole number exponents. A polynomial function can be written in standard form as a polynomial equation with variables and coefficients. The degree of a polynomial is the highest exponent, and the leading coefficient is the coefficient of the term with the highest degree. Examples are provided of evaluating polynomial functions for different variable values.
The document discusses operations and composition of functions. It explains that to find the sum of two functions f and g, you add them together and combine like terms. To find the difference, you subtract the second function from the first and distribute negatives. To find the product, you multiply corresponding terms of f and g. For the quotient f/g, you divide the first function by the second. The domain of sums, differences and products is where x is in the domains of both f and g, while the domain of the quotient excludes values where the denominator would be 0. Composition means substituting one function into another, written as f(g) or g(f).
The document discusses exponential functions and exponential equations. Exponential functions have the form f(x) = bx, where b is the base and x is the exponent. These functions are important in modeling real-world phenomena like population growth. Exponential equations set the exponents of the same base equal to solve for the variable. They can be solved by rewriting all terms to have the same base, setting the exponents equal, and solving the resulting equation.
Rational Functions, Equations, and Inequalities.pptxJohnlery Guzman
This document discusses rational functions, equations, and inequalities. It defines rational expressions as ratios of polynomials and provides examples. Rational equations use equality symbols with rational expressions. Rational inequalities use inequality symbols. Rational functions are functions where both the numerator and denominator are polynomial functions, not including where the denominator is the zero function. The document provides additional examples comparing rational equations, inequalities, and functions.
This document provides an overview of trigonometric functions. It covers angles and their measurement in degrees and radians. It then discusses right triangle trigonometry, defining the six trigonometric functions and properties like fundamental identities. Special angle values are computed for 30, 45, and 60 degrees. Trig functions of general angles and the unit circle approach are introduced. Graphs of sine, cosine, tangent, cotangent, cosecant and secant functions are examined.
This will help you in factoring sum and difference of two cubes.
For more instructional resources, CLICK me here!
https://tinyurl.com/y9muob6q
LIKE and FOLLOW me here!
https://tinyurl.com/ycjp8r7u
https://tinyurl.com/ybo27k2u
Students learn to define and identify linear equations. They also learn the definition of Standard Form of a linear equation.
Students also learn to graph linear equations using x and y intercepts.
The document discusses quadratic functions and their graphs. It defines quadratic functions as functions of the form f(x)=ax^2+bx+c, where a is not equal to 0. The graph of a quadratic function is a parabola with certain characteristics: it is symmetrical about an axis of symmetry and has a vertex which is either a maximum or minimum point. The axis of symmetry is the line x=0 for functions of the form f(x)=ax^2 and the vertex is at (0,0). For functions of the form f(x)=ax^2+k, the graph is a translation of f(x)=ax^2, so the vertex is (0,k) and the
1. A function is a relation where each input is paired with exactly one output.
2. To determine if a relation is a function, use the vertical line test - if any vertical line intersects more than one point, it is not a function.
3. To find the value of a function, substitute the given value for x into the function equation and simplify.
The document discusses inverse functions and how an inverse function undoes the operations of the original function. It provides examples of finding the inverse of functions by switching the x and y values and solving for y. The inverse of a function will be a function itself only if the original function passes the horizontal line test.
This document discusses exponential functions. It defines exponential functions as functions where f(x) = ax + B, where a is a real constant and B is any expression. Examples of exponential functions given are f(x) = e-x - 1 and f(x) = 2x. The document also discusses evaluating exponential equations with like and different bases using logarithms. It provides examples of graphing exponential functions and discusses the key characteristics of functions of the form f(x) = bx, including their domains, ranges, and asymptotic behavior. The document concludes with an example of applying exponential functions to model compound interest.
1) One-sided limits describe the value a function approaches as the input gets closer to a number from the left or right.
2) The limit of a function exists if and only if the one-sided limits are equal as the input approaches the number.
3) Limits at infinity describe the value a function approaches as the input increases without bound toward positive or negative infinity.
The document defines logarithmic functions and provides examples of converting between logarithmic and exponential forms. It discusses the properties of logarithmic equality and solving logarithmic equations by rewriting them in exponential form. Key points include: logarithmic and exponential forms are inverses; the exponent becomes the logarithm; logarithmic functions have a domain of positive real numbers; and solving logarithms involves setting arguments equal when bases are the same.
This document contains a lesson on slope of a line from a mathematics course. It includes examples of calculating slope given two points on a line, identifying whether graphs represent constant or variable rates of change, and word problems applying slope to real-world contexts like cost of fruit and gas. The key points are that slope is defined as the ratio of rise over run, or change in y over change in x, and represents the constant rate of change for linear equations and functions.
The document summarizes key characteristics of polynomial functions:
1) Polynomial functions produce smooth, continuous curves on their domains which are the set of real numbers.
2) The graph's x-intercepts, turning points, and absolute/relative maxima and minima are defined.
3) As the degree of a polynomial increases, so do the possible number of x-intercepts and turning points, up to the degree value. The leading coefficient and degree determine whether the graph rises or falls.
This document provides information about rational algebraic expressions. It defines a rational algebraic expression as a ratio of two polynomials where the denominator is not equal to zero. It gives examples of rational expressions like 7x/2y and 10x-5/(x+3). It explains that rational expressions are defined for all real numbers except those that would make the denominator equal to zero. The document also discusses how to simplify rational expressions by factoring the numerator and denominator and cancelling common factors. It provides examples of when cancellation is and is not allowed.
The discriminant of a quadratic equation is represented by b^2 - 4ac. This value determines the nature of the roots. If b^2 - 4ac = 0, then the roots are real and equal. If b^2 - 4ac > 0, then the roots are real but unequal. If b^2 - 4ac < 0, then the roots are imaginary and unequal. The document provides examples of calculating the discriminant and determining the nature of roots for different quadratic equations.
Math functions, relations, domain & rangeRenee Scott
This document discusses math functions, relations, and their domains and ranges. It provides examples of relations and explains that the domain is the set of first numbers in ordered pairs, while the range is the set of second numbers. A function is defined as a relation where each x-value has only one corresponding y-value. It compares examples of relations that are and are not functions and describes how to evaluate functions by inserting values. Tests for identifying functions like the vertical line test are also outlined.
This document defines key concepts related to relations and functions including ordered pairs, coordinate planes, relations, functions, graphical representations, domain and range, and the vertical line test. It provides examples and explanations of these terms. Ordered pairs represent points on a graph and functions are defined as sets of ordered pairs where no x-value is repeated, while relations allow repeated x-values. The vertical line test can be used to determine if a relation qualifies as a function by checking if a vertical line passes through only one point for each x-value.
This document discusses different types of relations and functions. It defines equivalence relations, identity relations, empty relations, universal relations, one-to-one functions, onto functions, bijective functions, composition of functions, and invertible functions. It provides examples to illustrate these concepts.
11 X1 T02 06 relations and functions (2010)Nigel Simmons
The document discusses relations and functions. A relation is any set of ordered pairs, while a function assigns each input exactly one output. It also discusses domains and ranges of functions. The domain is the set of all possible inputs, and is found by determining values that would make the function undefined. Examples show how to determine domains based on fractions, roots, and inequality restrictions.
The document provides information about functions and relations. It defines a function as a relation where each x-value is paired with exactly one y-value. To determine if a relation is a function, it describes using the vertical line test, where a relation is a function if a vertical line can only intersect the graph at one point. It gives examples of applying the vertical line test to graphs and determining the domain and range of relations.
This document defines relations and functions in mathematics. A relation is a set of ordered pairs where the domain is the set of all x values and the range is the set of all y values. A function assigns each element in the domain (set of x values) to exactly one element in the range (set of y values). Functions are commonly represented by letters like f(x), where f denotes the name of the function and x is the variable. The left side of a function equation tells us the name and variable of the function, not that the function is being multiplied.
The document discusses Cartesian products, domains, ranges, and co-domains of relations and functions through examples and definitions. It explains that the Cartesian product of sets A and B, written as A×B, is the set of all ordered pairs (a,b) where a is an element of A and b is an element of B. It also defines what constitutes a relation between two sets and provides examples of relations and functions, discussing their domains and ranges. Arrow diagrams are presented to illustrate various functions along with questions and their solutions related to relations and functions.
The document discusses factorizing complex expressions. The main points are:
- If a polynomial's coefficients are real, its roots will appear in complex conjugate pairs.
- Any polynomial of degree n can be factorized into a mixture of quadratic and linear factors over real numbers, or into n linear factors over complex numbers.
- Odd degree polynomials must have at least one real root.
- Examples of factorizing polynomials over both real and complex numbers are provided.
This document defines relations and functions. Relations are rules that connect input and output numbers. A relation is a set of ordered pairs. A function is a special type of relation where each input has exactly one output. The document discusses types of relations like reflexive, symmetric, and transitive relations. It also discusses types of functions like one-to-one, onto, and bijective functions. Examples are provided to illustrate relations and functions.
The document discusses functions and relations. It defines a function as a set of ordered pairs where each x-value is paired with only one y-value. A relation is a function only if each x-value is paired with exactly one y-value; if an x-value is paired with more than one y-value, it is not a function. It then asks the reader to identify which of several relations presented are functions based on this definition. It also gives some examples of evaluating simple functions.
This document provides an overview of basic set theory concepts including defining and representing sets, the number of elements in a set, comparing sets, subsets, and operations on sets including union and intersection. Key points covered are defining a set as a collection of well-defined objects, representing sets using listing, defining properties, or Venn diagrams, defining the cardinal number of a set as the number of elements it contains, comparing sets as equal or equivalent based on elements, defining subsets as sets contained within other sets, and defining union as the set of elements in either set and intersection as the set of elements common to both sets.
The document defines and explains various types of relations and binary operations. It discusses void, universal, identity, reflexive, symmetric, anti-symmetric, transitive, equivalence and partial order relations. It also covers inverse relations, equivalence classes, relation composition, and important results on relations. Additionally, it defines closure property, associative, commutative, and distributive laws for binary operations as well as identity elements and invertible elements.
The document discusses functions and function notation. It provides examples of determining if relations and graphs represent functions, writing equations in function notation, evaluating functions, and using functions to model real world problems. Key points are that a relation is a function if each input is mapped to exactly one output, and a graph is a function if a vertical line intersects it at most once. Functions can be written as f(x) and evaluated by finding f(a) for some input a.
The document discusses various topics in three dimensional geometry, including:
1. Coordinate systems define three perpendicular coordinate axes dividing space into eight parts.
2. The distance between two points P and Q is calculated as the square root of the sum of the squares of the differences between their x, y, and z coordinates.
3. Section formulae give the coordinates of points dividing or projecting onto lines between two given points.
This document discusses functions and relations. It defines a relation as a mapping of inputs to outputs, and specifies that a relation is a function only if each input maps to exactly one output. It then provides examples of relations represented as ordered pairs, tables, graphs, and equations, and asks the reader to determine whether each example represents a function or not.
This document provides information about relations and functions:
- It defines key terms like relation, domain, range, ordered pair, and function.
- It shows examples of representing relations using ordered pairs, tables, graphs, and mappings.
- It explains how to determine if a relation is a function using the vertical line test or by checking if each element in the domain is paired with exactly one element in the range.
- It provides examples of identifying functions from relations represented as ordered pairs, tables, graphs, and mappings.
- It introduces function notation and shows examples of evaluating functions.
In summary, the document defines relations and functions and provides examples of representing, analyzing, and evaluating them
This document provides information about relations and functions. It defines relations as sets of ordered pairs and functions as special relations where each element of the domain is paired with exactly one element of the range. It discusses using ordered pairs, tables, graphs and mappings to represent relations. It explains how to determine if a relation is a function using the vertical line test. It also covers functional notation and evaluating functions.
Relations and Functions
The document discusses relations and functions. An ordered pair consists of two elements written as (α, β) where order matters. A relation is a set of ordered pairs with a domain (set of first elements) and range (set of second elements). A function is a special relation where each domain element maps to exactly one range element. Several examples demonstrate relations that are and are not functions based on the one-to-one correspondence between domain and range elements.
The document discusses relations, functions, domains, and ranges. It defines a relation as a set of ordered pairs and a function as a relation where each x-value is mapped to only one y-value. It explains how to identify the domain and range of a relation, and use the vertical line test and mappings to determine if a relation is a function. Examples of evaluating functions are also provided.
This document discusses relations and functions. It provides examples of how to classify relations as functions or not based on whether they satisfy the vertical line test and one-to-one correspondence. Students are asked to complete activities identifying domains and ranges of relations, graphing relations to apply the vertical line test, and determining if equations represent functions. The assignment is to copy equations on a sheet of paper and identify if they represent functions.
The document discusses functions, relations, domains, ranges and using vertical line tests, mappings, tables and graphs to represent and analyze functions. It provides examples of determining if a relation is a function, finding domains and ranges, modeling function rules with tables and graphs using given domains, and solving other function problems.
The document defines relations and functions. A relation is a set of ordered pairs where the domain is the set of first coordinates and the range is the set of second coordinates. A function is a special type of relation where each element in the domain corresponds to exactly one element in the range. Functions can be represented as tables of values, ordered pairs, mappings, graphs or equations. The vertical line test can be used to determine if a graph represents a function - if no vertical line intersects the graph at more than one point, it is a function. Examples are provided to illustrate these concepts.
This document defines key terms related to functions such as domain, range, and piecewise functions. It provides examples of representing functions using tables, ordered pairs, graphs, and equations. It also discusses how to determine if a relation represents a function and describes piecewise functions as using more than one formula with separate domains.
The document discusses relations, functions, domains, ranges, and evaluating functions. A relation is a set of ordered pairs, while a function is a relation where each input is mapped to only one output. To determine if a relation is a function, one can use the vertical line test or create a mapping diagram. The domain of a relation is the set of all inputs, while the range is the set of all outputs. Evaluating a function involves substituting inputs into the function rule to obtain the corresponding outputs.
The document summarizes key concepts about relations and functions including:
1) It defines relation, domain, range, and function.
2) It provides examples of relations that are and are not functions using ordered pairs, tables, and mappings.
3) It shows how to determine if a relation is a function using a vertical line test and mappings.
4) It gives examples of finding the domain and range of relations and determining if other relations are functions.
The document provides information about relations and functions. It defines domain as the x-coordinates of ordered pairs in a relation, and range as the y-coordinates. An example relation is given with domain {3, 1, -2} and range {2, 6, 0}. Relations can be represented as sets of ordered pairs, tables, mappings, and graphs. A mapping example is shown. Determining if a relation is a function involves checking if each x-value is paired with a single y-value using the vertical line test.
This document discusses functions and relations. It defines a relation as a set of ordered pairs and provides examples. It then defines a function as a special type of relation where each element of the domain corresponds to exactly one element of the range, meaning no two ordered pairs can have the same first element. The document discusses different types of relations including one-to-one, one-to-many, many-to-one, and many-to-many. It also discusses how functions can be presented using arrow diagrams, tables, graphs, and ordered pairs. Finally, it discusses function notation and evaluating functions by substituting values into the function.
This document provides an overview of graphing linear relations and functions. It defines key concepts like relations, functions, domain and range. It explains how to determine if a relation is a function, how to graph linear equations, and how to calculate and understand slope. It provides examples of representing relations as ordered pairs, tables, mappings and graphs. It discusses discrete and continuous functions and how to use the vertical line test to determine if a graph represents a function. It also introduces function notation and how to find the value of a function for a given input.
This document defines key concepts related to functions and relations including:
- Relations are sets of ordered pairs with a domain and range
- A function is a special type of relation where each element in the domain is mapped to only one element in the range (no repeated x-values)
- Relations can be represented as ordered pairs, tables, graphs, or mappings
- The document provides examples of determining if a relation represents a function based on whether the domain elements are repeated
Grade 11-Strand(Concept of functions).pptxAlwinCAsuncion
This document discusses functions and their properties including:
1. Defining functions and related terms like domain and range
2. Determining if a relation represents a function
3. Defining piecewise functions and representing real-life situations using functions and piecewise functions.
The document discusses relations and functions. It provides examples of relations that are and are not functions using ordered pairs. A relation is a function if each element in the domain is mapped to exactly one element in the range. This is determined using a mapping diagram or by applying the vertical line test to a graphical representation of the relation.
The document discusses identifying the domain and range of functions. The domain is the set of all x-coordinates in a relation, while the range is the set of all y-coordinates. A relation is a function if each element in the domain is mapped to only one element in the range - in other words, if each x-value has a single, unique y-value. The document provides examples of stating the domain and range of relations and determining whether they represent functions.
1. Addition of functions: Add the outputs of two functions with the same inputs.
2. Subtraction of functions: Subtract the outputs of two functions with the same inputs.
3. Multiplication of functions: Multiply the outputs of two functions with the same inputs.
4. Division of functions: Divide the output of one function by the output of another function with the same inputs.
5. Composition of functions: Replace the inputs of one function with the outputs of another function.
1. The document discusses relations and functions, including identifying their domain and range. It provides examples of plotting points on a Cartesian plane and using graphs to represent equations.
2. Functions are defined as relations where each input is mapped to only one output. Several examples are given to demonstrate determining if a relation qualifies as a function using techniques like the vertical line test.
3. The key concepts of domain, range, and using graphs are illustrated through multiple examples of sketching and analyzing relations and functions.
Strategies for Effective Upskilling is a presentation by Chinwendu Peace in a Your Skill Boost Masterclass organisation by the Excellence Foundation for South Sudan on 08th and 09th June 2024 from 1 PM to 3 PM on each day.
June 3, 2024 Anti-Semitism Letter Sent to MIT President Kornbluth and MIT Cor...Levi Shapiro
Letter from the Congress of the United States regarding Anti-Semitism sent June 3rd to MIT President Sally Kornbluth, MIT Corp Chair, Mark Gorenberg
Dear Dr. Kornbluth and Mr. Gorenberg,
The US House of Representatives is deeply concerned by ongoing and pervasive acts of antisemitic
harassment and intimidation at the Massachusetts Institute of Technology (MIT). Failing to act decisively to ensure a safe learning environment for all students would be a grave dereliction of your responsibilities as President of MIT and Chair of the MIT Corporation.
This Congress will not stand idly by and allow an environment hostile to Jewish students to persist. The House believes that your institution is in violation of Title VI of the Civil Rights Act, and the inability or
unwillingness to rectify this violation through action requires accountability.
Postsecondary education is a unique opportunity for students to learn and have their ideas and beliefs challenged. However, universities receiving hundreds of millions of federal funds annually have denied
students that opportunity and have been hijacked to become venues for the promotion of terrorism, antisemitic harassment and intimidation, unlawful encampments, and in some cases, assaults and riots.
The House of Representatives will not countenance the use of federal funds to indoctrinate students into hateful, antisemitic, anti-American supporters of terrorism. Investigations into campus antisemitism by the Committee on Education and the Workforce and the Committee on Ways and Means have been expanded into a Congress-wide probe across all relevant jurisdictions to address this national crisis. The undersigned Committees will conduct oversight into the use of federal funds at MIT and its learning environment under authorities granted to each Committee.
• The Committee on Education and the Workforce has been investigating your institution since December 7, 2023. The Committee has broad jurisdiction over postsecondary education, including its compliance with Title VI of the Civil Rights Act, campus safety concerns over disruptions to the learning environment, and the awarding of federal student aid under the Higher Education Act.
• The Committee on Oversight and Accountability is investigating the sources of funding and other support flowing to groups espousing pro-Hamas propaganda and engaged in antisemitic harassment and intimidation of students. The Committee on Oversight and Accountability is the principal oversight committee of the US House of Representatives and has broad authority to investigate “any matter” at “any time” under House Rule X.
• The Committee on Ways and Means has been investigating several universities since November 15, 2023, when the Committee held a hearing entitled From Ivory Towers to Dark Corners: Investigating the Nexus Between Antisemitism, Tax-Exempt Universities, and Terror Financing. The Committee followed the hearing with letters to those institutions on January 10, 202
বাংলাদেশের অর্থনৈতিক সমীক্ষা ২০২৪ [Bangladesh Economic Review 2024 Bangla.pdf] কম্পিউটার , ট্যাব ও স্মার্ট ফোন ভার্সন সহ সম্পূর্ণ বাংলা ই-বুক বা pdf বই " সুচিপত্র ...বুকমার্ক মেনু 🔖 ও হাইপার লিংক মেনু 📝👆 যুক্ত ..
আমাদের সবার জন্য খুব খুব গুরুত্বপূর্ণ একটি বই ..বিসিএস, ব্যাংক, ইউনিভার্সিটি ভর্তি ও যে কোন প্রতিযোগিতা মূলক পরীক্ষার জন্য এর খুব ইম্পরট্যান্ট একটি বিষয় ...তাছাড়া বাংলাদেশের সাম্প্রতিক যে কোন ডাটা বা তথ্য এই বইতে পাবেন ...
তাই একজন নাগরিক হিসাবে এই তথ্য গুলো আপনার জানা প্রয়োজন ...।
বিসিএস ও ব্যাংক এর লিখিত পরীক্ষা ...+এছাড়া মাধ্যমিক ও উচ্চমাধ্যমিকের স্টুডেন্টদের জন্য অনেক কাজে আসবে ...
This presentation includes basic of PCOS their pathology and treatment and also Ayurveda correlation of PCOS and Ayurvedic line of treatment mentioned in classics.
Introduction to AI for Nonprofits with Tapp NetworkTechSoup
Dive into the world of AI! Experts Jon Hill and Tareq Monaur will guide you through AI's role in enhancing nonprofit websites and basic marketing strategies, making it easy to understand and apply.
How to Add Chatter in the odoo 17 ERP ModuleCeline George
In Odoo, the chatter is like a chat tool that helps you work together on records. You can leave notes and track things, making it easier to talk with your team and partners. Inside chatter, all communication history, activity, and changes will be displayed.
MATATAG CURRICULUM: ASSESSING THE READINESS OF ELEM. PUBLIC SCHOOL TEACHERS I...NelTorrente
In this research, it concludes that while the readiness of teachers in Caloocan City to implement the MATATAG Curriculum is generally positive, targeted efforts in professional development, resource distribution, support networks, and comprehensive preparation can address the existing gaps and ensure successful curriculum implementation.
This presentation was provided by Steph Pollock of The American Psychological Association’s Journals Program, and Damita Snow, of The American Society of Civil Engineers (ASCE), for the initial session of NISO's 2024 Training Series "DEIA in the Scholarly Landscape." Session One: 'Setting Expectations: a DEIA Primer,' was held June 6, 2024.
2. Analyze and graph relations.
Find functional values.
1) ordered pair
2) Cartesian Coordinate
3) plane
4) quadrant
5) relation
6) domain
7) range
8) function
9) mapping
10) one-to-one function
11) vertical line test
12) independent variable
13) dependent variable
14) functional notation
Relations and FunctionsRelations and Functions
3. Animal
Average
Lifetime
(years)
Maximum
Lifetime
(years)
Cat 12 28
Cow 15 30
Deer 8 20
Dog 12 20
Horse 20 50
This table shows the average lifetime
and maximum lifetime for some animals.
The data can also be represented as
ordered pairs.
The ordered pairs for the data are:
(12, 28), (15, 30), (8, 20),
(12, 20), (20, 50)and
The first number in each ordered pair
is the average lifetime, and the second
number is the maximum lifetime.
(20, 50)
average
lifetime
maximum
lifetime
Relations and FunctionsRelations and Functions
4. Animal Lifetimes
y
x
3010 20 30
60
20
40
60
5 25
10
50
15
30
0
0
Average Lifetime
MaximumLifetime
(12, 28), (15, 30), (8, 20),
(12, 20), (20, 50)and
You can graph the ordered pairs below
on a coordinate system with two axes.
Remember, each point in the coordinate
plane can be named by exactly one
ordered pair and that every ordered pair
names exactly one point in the coordinate
plane.
The graph of this data (animal lifetimes)
lies in only one part of the Cartesian
coordinate plane – the part with all
positive numbers.
Relations and FunctionsRelations and Functions
5. The Cartesian coordinate system is composed of the x-axis (horizontal),
0 5-5
0
5
-5
Origin
(0, 0)
and the y-axis (vertical), which meet at the origin (0, 0) and divide the plane into
four quadrants.
You can tell which quadrant a point is in by looking at the sign of each coordinate of
the point.
Quadrant I
( +, + )
Quadrant II
( --, + )
Quadrant III
( --, -- )
Quadrant IV
( +, -- )
The points on the two axes do not lie in any quadrant.
Relations and FunctionsRelations and Functions
6. In general, any ordered pair in the coordinate
plane can be written in the form (x, y).
A relation is a set of ordered pairs.
The domain of a relation is the set of all first coordinates
(x-coordinates) from the ordered pairs.
The range of a relation is the set of all second coordinates
(y-coordinates) from the ordered pairs.
The graph of a relation is the set of points in the coordinate
plane corresponding to the ordered pairs in the relation.
Relations and FunctionsRelations and Functions
What is a RELATION?
7. Given the relation:
{(2, -6), (1, 4), (2, 4), (0,0), (1, -6), (3, 0)}
State the domain:
D: {0,1, 2, 3}
State the range:
R: {-6, 0, 4}
Relations and FunctionsRelations and Functions
Note: { } are the symbol for "set".
When writing the domain and range,
do not repeat values.
8. {(2, –3), (4, 6), (3, –1), (6, 6), (2, 3)}
domain: {2, 3, 4, 6}
range: {–3, –1, 3, 6}
State the domain and range of the following
relation.
Relations and FunctionsRelations and Functions
9. y
x
(-4,3) (2,3)
(-1,-2)
(0,-4)
(3,-3)
State the domain and range of the relation shown
in the graph.
The relation is:
{ (-4, 3), (-1, 2), (0, -4),
(2, 3), (3, -3) }
The domain is:
{ -4, -1, 0, 2, 3 }
The range is:
{ -4, -3, -2, 3 }
Relations and FunctionsRelations and Functions
10. ACTIVITY TIME! (20 points)
Form five (5 groups).
Assign group leaders per group.
Let them answer pages 142 – 143. Assign
problem to each group to answer.
Outputs will be written in a Manila Paper.
Assign members who will present the output.
Presentation of outputs will be done AFTER 15
minutes.
The last group to post their output will be the
first to present.
Relations and FunctionsRelations and Functions
11. • Relations can be written in several
ways: ordered pairs, table, graph, or
mapping.
• We have already seen relations
represented as ordered pairs.
Relations and FunctionsRelations and Functions
12. Table
{(3, 4), (7, 2),
(0, -1), (-2, 2),
(-5, 0), (3, 3)}
x y
3 4
7 2
0 -1
-2 2
-5 0
3 3
Relations and FunctionsRelations and Functions
13. Mapping
• Create two ovals with the domain on
the left and the range on the right.
• Elements are not repeated.
• Connect elements of the domain with
the corresponding elements in the
range by drawing an arrow.
Relations and FunctionsRelations and Functions
17. What is a FUNCTION?
Relations and FunctionsRelations and Functions
18. A function is a special type of relation in which each element of the domain is paired
with ___________ element in the range.exactly one
A mapping shows how each member of the domain is paired with each member in
the range.
Functions
( ) ( ) ( ){ }4,2,2,0,1,3−
Domain Range
-3
0
2
1
2
4
function
Relations and FunctionsRelations and Functions
ONE-TO-ONE
CORRESPONDENCE
Furthermore, a set of ordered pairs is a function if no two ordered pairs
have equal abscissas.
19. A function is a special type of relation in which each element of the domain is paired
with ___________ element in the range.exactly one
A mapping shows how each member of the domain is paired with each member in
the range.
Functions
( ) ( ) ( ){ }5,4,3,1,5,1−
Domain Range
-1
1
4
5
3
function,
not one-to-one
Relations and FunctionsRelations and Functions
MANY-TO-ONE
CORRESPONDENCE
Furthermore, a set of ordered pairs is a function if no two ordered pairs
have equal abscissas.
20. A function is a special type of relation in which each element of the domain is paired
with ___________ element in the range.exactly one
A mapping shows how each member of the domain is paired with each member in
the range.
Functions
( ) ( ) ( ) ( ){ }6,3,1,1,0,3,6,5 −−
Domain Range
5
-3
1
6
0
1
not a function
Relations and FunctionsRelations and Functions
ONE-TO-MANY
CORRESPONDENCE
Furthermore, a set of ordered pairs is a function if no two ordered pairs
have equal abscissas.
21. y
x
(-4,3) (2,3)
(-1,-2)
(0,-4)
(3,-3)
State the domain and range of the relation shown
in the graph. Is the relation a function?
The relation is:
{ (-4, 3), (-1, 2), (0, -4), (2, 3), (3, -3) }
The domain is:
{ -4, -1, 0, 2, 3 }
The range is:
{ -4, -3, -2, 3 }
Each member of the domain is paired with
Exactly one member of the range, so
this relation is a function.
Relations and FunctionsRelations and Functions
22. Function Not a Function
(4,12)
(5,15)
(6,18)
(7,21)
(8,24)
(4,12)
(4,15)
(5,18)
(5,21)
(6,24)
23. Function Not a Function
10
3
4
7
5
2
3
4
8
10
3
5
7
2
2
3
4
7
5
24. Function Not a Function
-3
-2
-1
0
1
-6
-1
-0
3
15
-3
-2
-1
0
1
-6
-1
-0
3
15
25. Function Not a Function
X Y
1 2
2 4
3 6
4 8
5 10
6 12
X Y
1 2
2 4
1 5
3 8
4 4
5 10
27. ANSWER EXERCISE 7,
IDENTIFY WHICH ONES
ARE FUNCTIONS.
1. FUNCTION
2. NOT FUNCTION
3. FUNCTION
4. FUNCTION
5. FUNCTION
Relations and FunctionsRelations and Functions
Let’s check!
NOW YOU TRY! (2 minutes)
28. You can use the vertical line test to determine whether a relation is a function.
Vertical Line Test
y
x
y
x
If no vertical line intersects a
graph in more than one point,
the graph represents a function.
If some vertical line intercepts a
graph in two or more points, the
graph does not represent a function.
Relations and FunctionsRelations and Functions
29. Year
Population
(millions)
1950 3.9
1960 4.7
1970 5.2
1980 5.5
1990 5.5
2000 6.1
The table shows the population of Indiana
over the last several decades.
We can graph this data to determine
if it represents a function.
7‘60
0
1
3
5
7
2
6
‘50
8
4
‘80‘70 ‘00
0
‘90
Population
(millions)
Year
Population of Indiana
Use the vertical
line test.
Notice that no vertical line can be drawn that
contains more than one of the data points.
Therefore, this relation is a function!Therefore, this relation is a function!
Relations and FunctionsRelations and Functions
45. Determine whether each
relation is a function.
1. {(2, 3), (3, 0), (5, 2), (4, 3)}
YES, every domain is different!
f(x)
2 3
f(x)
3 0
f(x)
5 2
f(x)
4 3
46. Determine whether the relation
is a function.
2. {(4, 1), (5, 2), (5, 3), (6, 6), (1, 9)}
f(x)
4 1
f(x)
5 2
f(x)
5 3
f(x)
6 6
f(x)
1 9
NO,
5 is paired with 2 numbers!
47. Is this relation a function?
{(1,3), (2,3), (3,3)}
1. Yes
2. No
Answer Now
48. Vertical Line Test (pencil test)
If any vertical line passes through
more than one point of the graph,
then that relation is not a function.
Are these functions?
FUNCTION! FUNCTION! NOPE!
50. Is this a graph of a function?
1. Yes
2. No
Answer Now
51. When an equation represents a function, the variable (usually x) whose values make
up the domain is called the independent variable.
Relations and FunctionsRelations and Functions
52. When an equation represents a function, the variable
(usually x) whose values make up the
domain is called the independent variable.
The other variable (usually y) whose values make
up the range is called the dependent variable
because its values depend on x.
Relations and FunctionsRelations and Functions
53. Function Notation
• When we know that a relation is a
function, the “y” in the equation can
be replaced with f(x).
• f(x) is simply a notation to designate a
function. It is pronounced ‘f’ of ‘x’.
• The ‘f’ names the function, the ‘x’ tells
the variable that is being used.
NOTE: Letters other than f can be used to represent
a function.
EXAMPLE: g(x) = 2x + 1
68. Given g(x) = x2
– 2, find g(4)
Answer Now
1. 2
2. 6
3. 14
4. 18
69. Given f(x) = 2x + 1, find f(-8)
Answer Now
1. -40
2. -15
3. -8
4. 4
70. Value of a Function
If g(s) = 2s + 3, find g(-2).
g(-2) = 2(-2) + 3
=-4 + 3
= -1
g(-2) = -1
71. Value of a Function
If h(x) = x2
- x + 7, find h(2c).
h(2c) = (2c)2
– (2c) + 7
= 4c2
- 2c + 7
72. Value of a Function
If f(k) = k2
- 3, find f(a - 1)
f(a - 1)=(a - 1)2
- 3
(Remember FOIL?!)
=(a-1)(a-1) - 3
= a2
- a - a + 1 - 3
= a2
- 2a - 2
73. 12relationGraph the += xy
x y
1) Make a table of values.
-1
0
1
2
-1
1
3
5
2) Graph the ordered pairs.
0
y
0 x
5-4 -2 1 3
-3-3
-1
2
4
6
-5 -1 4
-2
3
-5 2
1
-3
5
7
3) Find the domain and range.
Domain is all real numbers.
Range is all real numbers.
4) Determine whether the relation is a function.
The graph passes the vertical line test.
For every x value there is exactly one y value,
so the equation y = 2x + 1 represents a function.
For every x value there is exactly one y value,
so the equation y = 2x + 1 represents a function.
Relations and FunctionsRelations and Functions
74. 2relationGraph the 2
−= yx
x y
1) Make a table of values.
2
-1
-2
-2
-1
0
2) Graph the ordered pairs.
0
y
0 x
5-4 -2 1 3
-3-3
-1
2
4
6
-5 -1 4
-2
3
-5 2
1
-3
5
7
3) Find the domain and range.
Domain is all real numbers,
greater than or equal to -2.
Range is all real numbers.
4) Determine whether the relation is a function.
The graph does not pass the vertical line test.
For every x value (except x = -2),
there are TWO y values,
so the equation x = y2
– 2
DOES NOT represent a function.
For every x value (except x = -2),
there are TWO y values,
so the equation x = y2
– 2
DOES NOT represent a function.
-1 1
2 2
Relations and FunctionsRelations and Functions
75. Graphs of a Function
Vertical Line Test:
If a vertical line is passed
over the graph and it intersects
the graph in exactly one point,
the graph represents a function.
76. x
y
x
y
Does the graph represent a
function? Name the domain and
range.
Yes
D: all real numbers
R: all real numbers
Yes
D: all real numbers
R: y ≥ -6
77. x
y
x
y
Does the graph represent a
function? Name the domain and
range.
No
D: x ≥ 1/2
R: all real numbers
No
D: all real numbers
R: all real numbers
78. Does the graph represent a
function? Name the domain and
range.
Yes
D: all real numbers
R: y ≥ -6
No
D: x = 2
R: all real numbers
x
y
x
y