Download as PPSX, PPTX


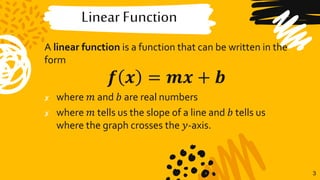
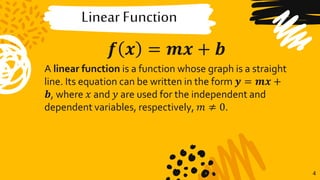
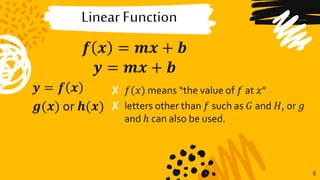
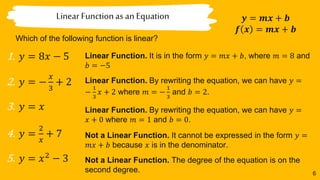
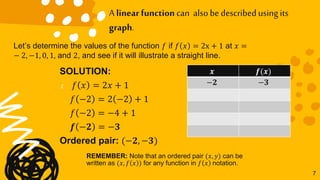
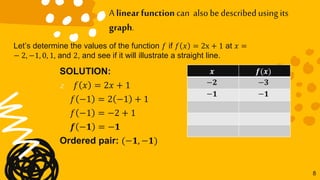


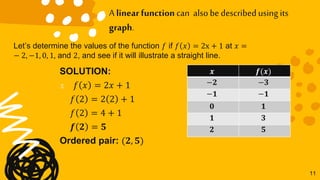
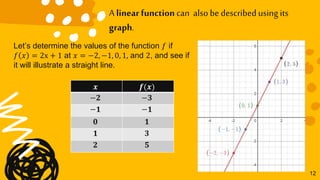
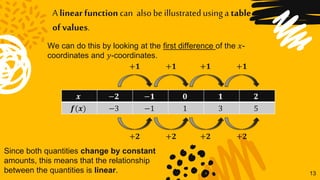

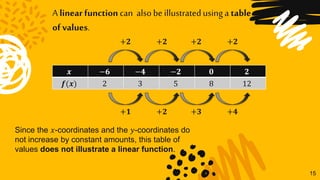
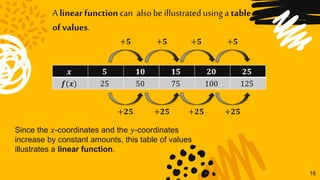


This document discusses linear functions and how to represent them using equations, graphs, and tables of values. It defines a linear function as one that can be written in the form f(x) = mx + b, where m is the slope and b is the y-intercept. Examples are provided to illustrate determining the slope and y-intercept from an equation and representing a linear function using an equation, table of values, or graph. It is explained that a linear function will produce a straight line on a graph and have constant differences in x- and y-coordinates in its table of values.


