Downloaded 4,325 times


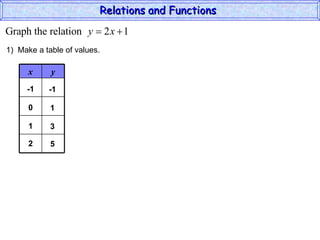


The document discusses the concepts of relations and functions, illustrating them through the average and maximum lifetimes of various animals. It presents data in table form and as ordered pairs, explaining key terms such as domain, range, and different types of functions including one-to-one functions. Additionally, it covers how to graph these relations on a Cartesian coordinate system and how to determine the quadrants based on ordered pairs.


