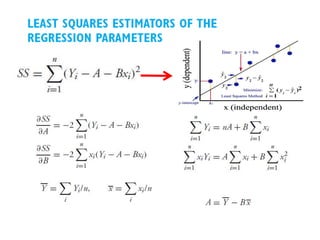
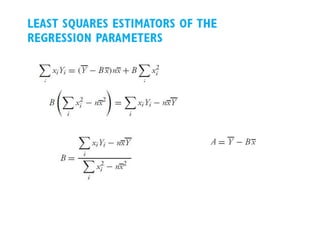
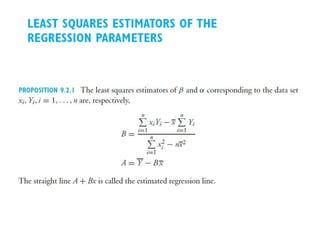
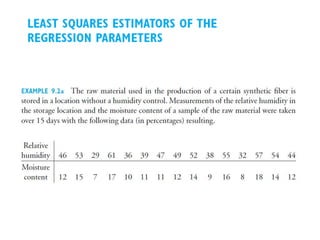
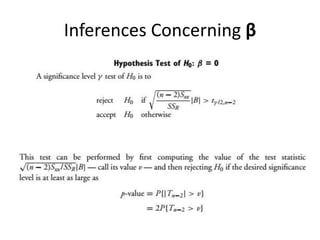
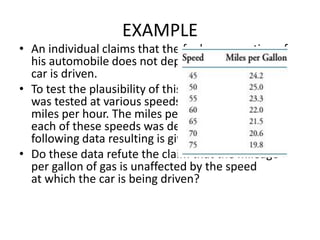
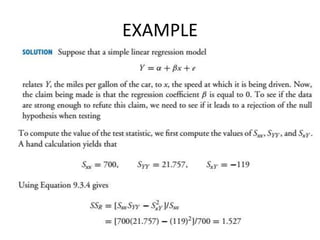
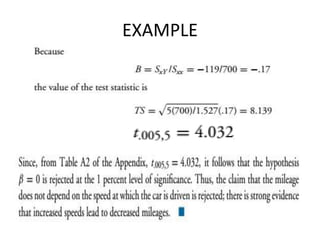
Downloaded 168 times

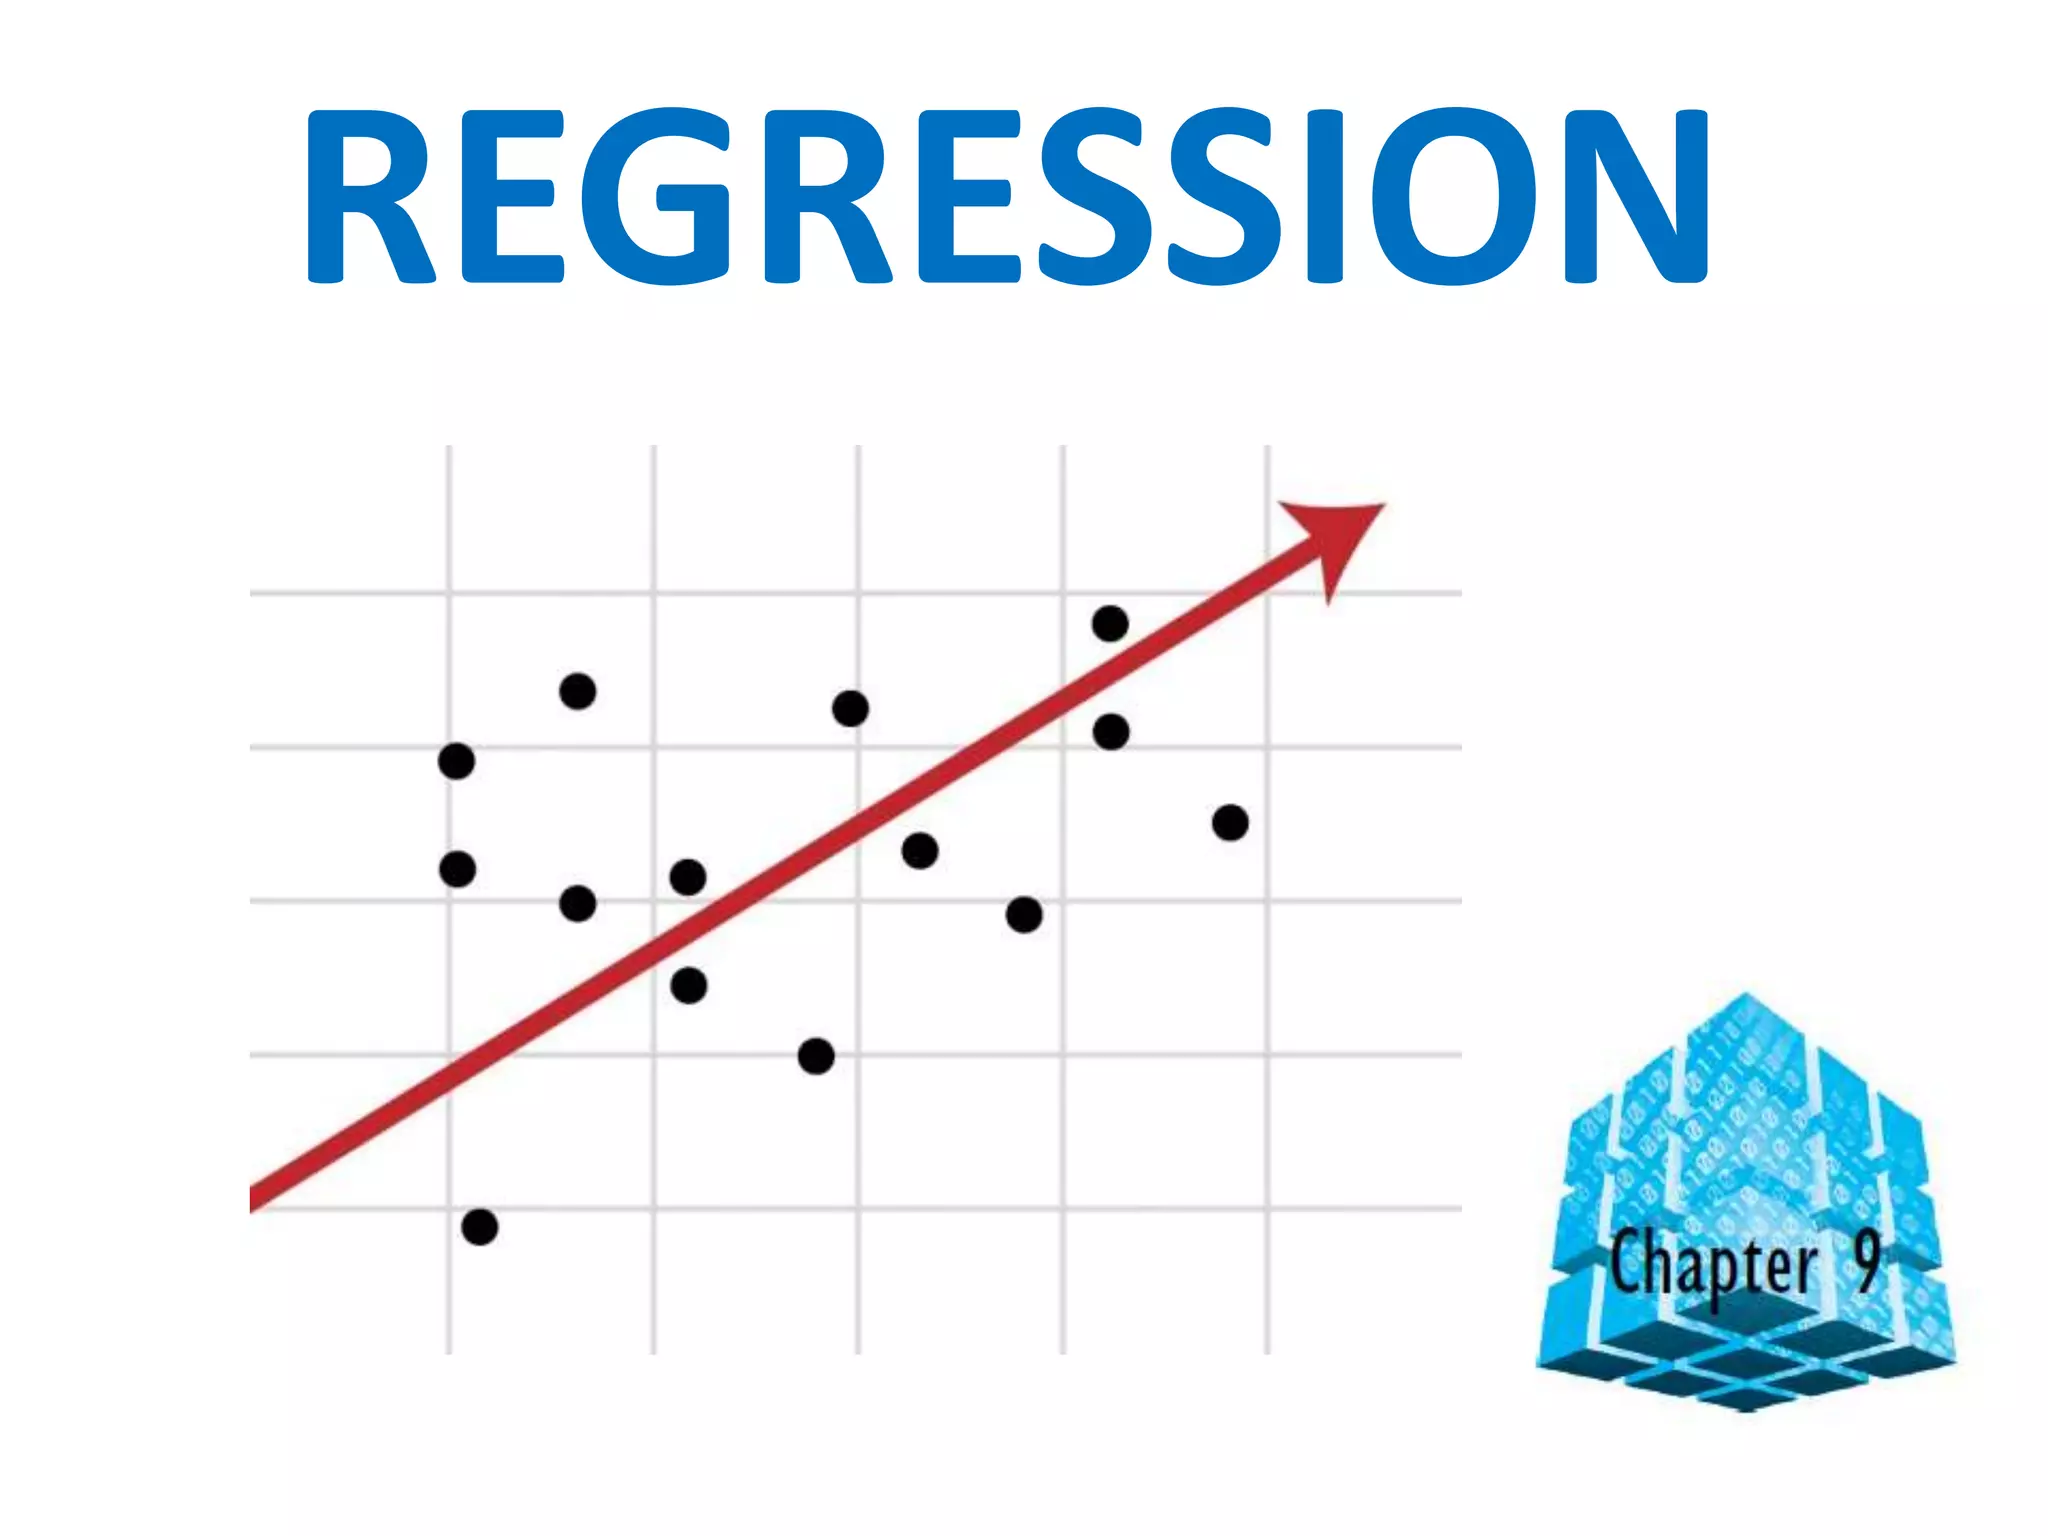
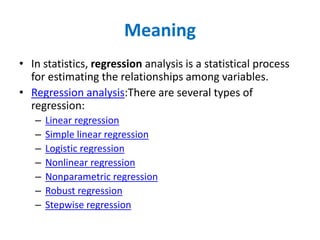
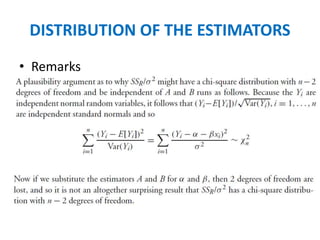
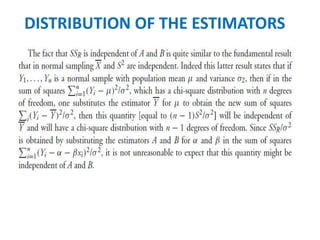
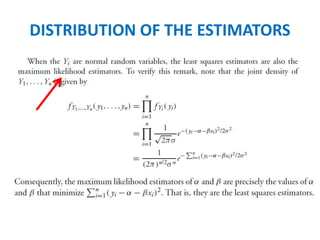
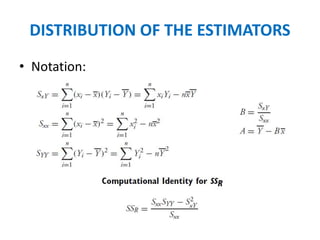
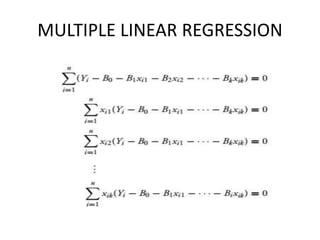
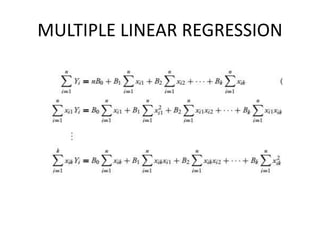
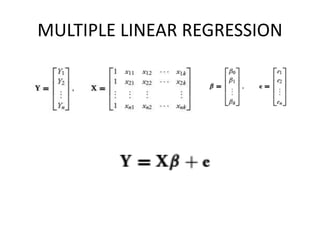
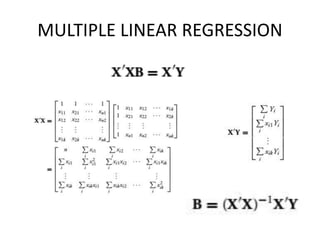


1. Regression analysis is a statistical process for estimating relationships between variables, including linear regression, logistic regression, and other types. 2. It allows predicting a dependent or response variable's values based on the values of independent or input variables. 3. Multiple linear regression allows modeling relationships between a scalar dependent variable and two or more explanatory variables.


![[Xin yan, xiao_gang_su]_linear_regression_analysis(book_fi.org)](https://cdn.slidesharecdn.com/ss_thumbnails/xinyanxiaogangsulinearregressionanalysisbookfi-140714092751-phpapp02-thumbnail.jpg?width=640&height=640&fit=bounds)