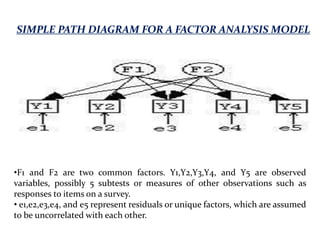
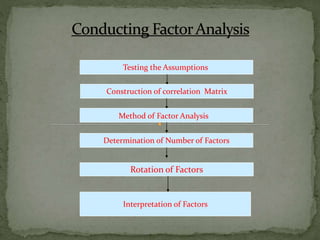
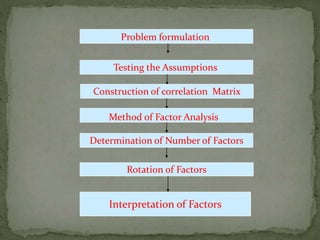
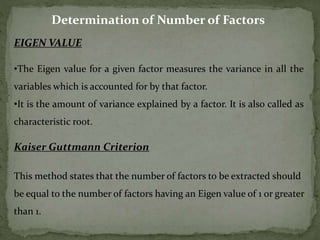
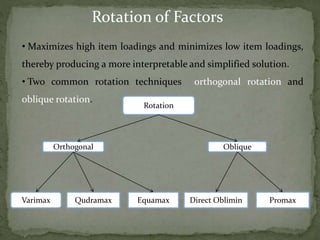
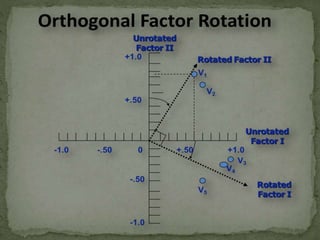
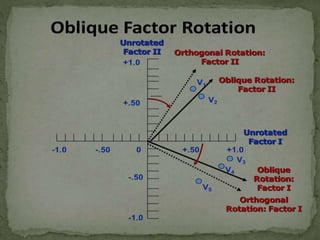
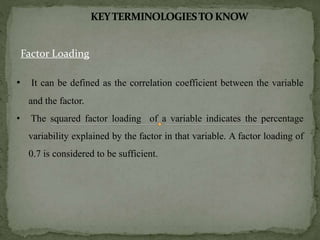
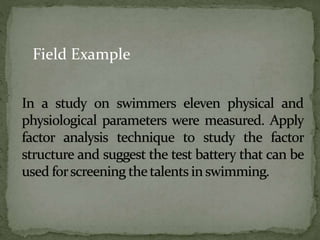
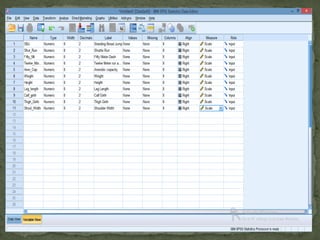
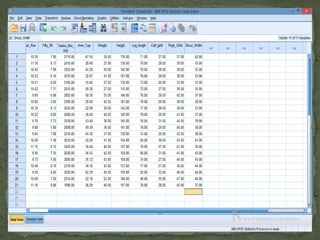
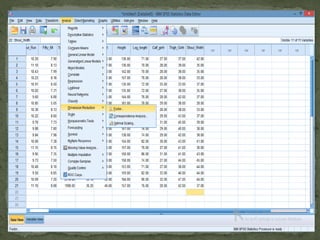
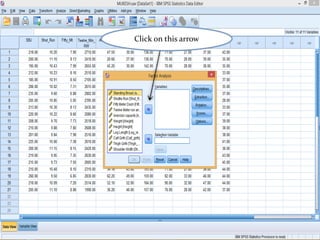
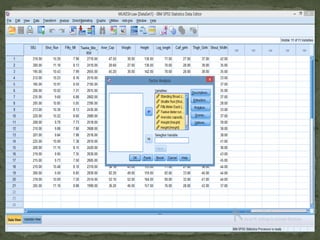
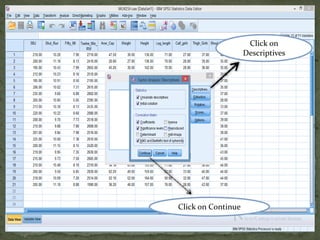
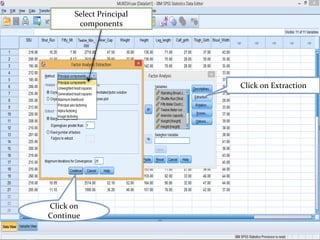
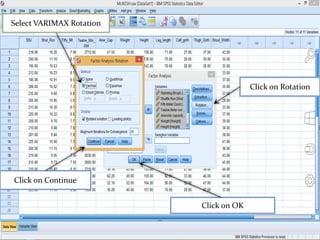
This document discusses exploratory factor analysis (EFA). EFA is used to identify underlying factors that explain the pattern of correlations within a set of observed variables. The document outlines the steps of EFA, including testing assumptions, constructing a correlation matrix, determining the number of factors, rotating factors, and interpreting the factor loadings. It provides an example of running EFA on a dataset with 11 physical performance and anthropometric variables from 21 participants. The analysis extracts 3 factors that explain over 80% of the total variance.
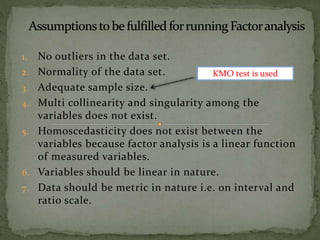


![Variables Component 1 Component 2 Component 3 Communality
Vividness Qu -.198 -.805 .061 69%
Control Qu .173 .751 .306 69%
Preference Qu .353 .577 -.549 76%
Generate Test -.444 .251 .543 55%
Inspect Test -.773 .051 -.051 60%
Maintain .734 -.003 .384 69%
Transform (P&P) Test .759 -.155 .188 64%
Transform (Comp)
Test
-.792 .179 .304 75%
Visual STM Test .792 -.102 .215 69%
Eigenvalues 3.36 1.677 1.018 /
% Variance 37.3% 18.6% 11.3% /
Communality of Variable 1 (Vividness Qu) = (-.198)2 + (-.805)2 + (.061)2 = . 69 or 69%
Eigenvalue of Comp 1 = ( [-.198]2 + [.173]2 + [.353]2 + [-.444]2 + [-.773]2 +[.734]2 + [.759]2 + [-
.792]2 + [.792]2 ) = 3.36
3.36 / 9 = 37.3%](https://image.slidesharecdn.com/factor-analysis-ppt-160212052121/85/An-Introduction-to-Factor-analysis-ppt-29-320.jpg)


![[DSC Europe 25] Slobodan Dolinic - Smart and Intelligent Green Region.pptx](https://cdn.slidesharecdn.com/ss_thumbnails/0bribinjsp6ghwtvsvor-2-sigre-slobodan-dolinic-260115093812-c9c10e90-thumbnail.jpg?width=640&height=640&fit=bounds)


![[DSC Europe 25] Andrzej Kowalczyk - AI - how to start small and grow in the f...](https://cdn.slidesharecdn.com/ss_thumbnails/oy1zmo94qv6vpcqjvno2-andrzej-kowalczyk-ai-how-to-start-small-and-grow-in-the-future-1-260119121559-cf093b23-thumbnail.jpg?width=640&height=640&fit=bounds)


