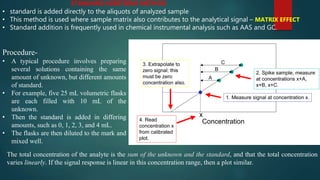
Downloaded 34 times


![(Bear in mind that the chemical species X and S are the same) Signal is directly proportional to analyte concentration, so
initial concentration of analyte [X]i gives a signal intensity IX
Then a known concentration of standard, S, is added to an aliquot of the sample
and a signal ISX
Let’s call the diluted concentration of analyte [X]f, where “f” stands for “final.”
We designate the concentration of standard in the final solution as [S]f.
Standard addition equation:
For an initial volume Vo of unknown and added volume VS of
standard with concentration [S]i, the total volume is V Vo VS and
the concentrations in Equation](https://image.slidesharecdn.com/standardizationandcalibration-dr-211214104709/85/Standardization-and-calibration-dr-mallik-16-320.jpg)
![If all standard additions are made to a constant final volume, plot the signal ISX versus the concentration of diluted
standard, [S]f . In this case, the x-intercept is the final concentration of unknown, [X]f, after dilution to the final sample
volume. The initial concentration of unknown, [X]i, is calculated from the dilution that was applied to make the final
sample](https://image.slidesharecdn.com/standardizationandcalibration-dr-211214104709/85/Standardization-and-calibration-dr-mallik-17-320.jpg)


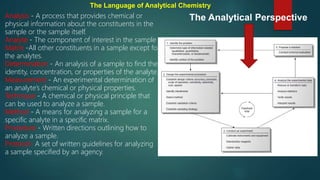
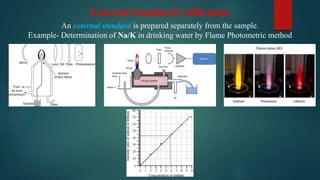
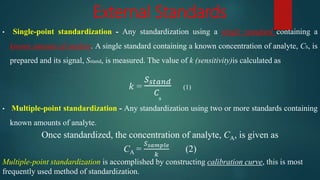
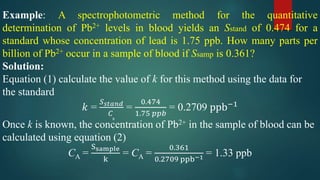
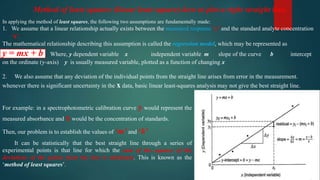
This document discusses standardization and calibration in analytical chemistry. It defines key terms like analyte, matrix, determination, and technique. It explains that calibration determines the relationship between analytical response and analyte concentration using chemical standards. Calibration is important to eliminate bias and ensure accuracy. Standardization uses primary standards of high purity to find the exact concentration of a solution. External standard calibration prepares standards separately from samples. The document also covers calibration curves, correlation coefficients, standard additions methods, and references for further information.


