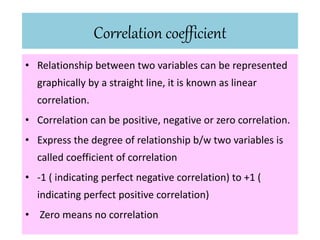
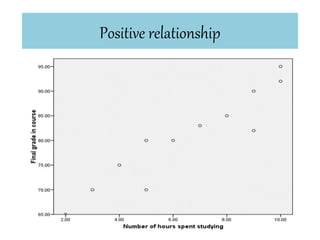
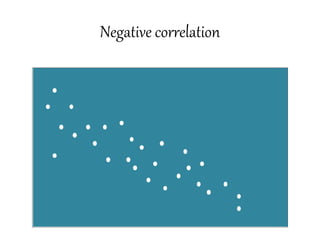
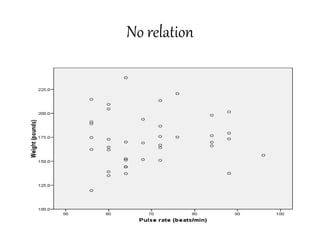
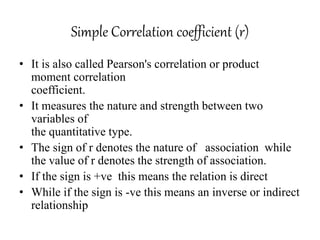
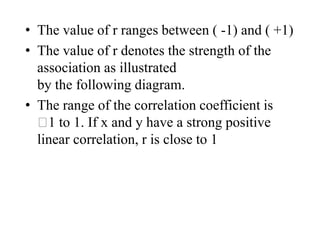
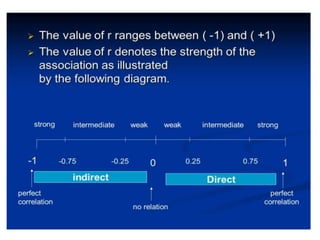
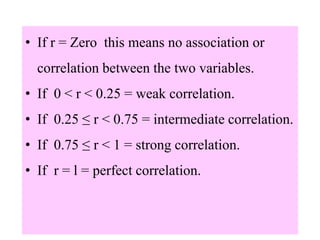
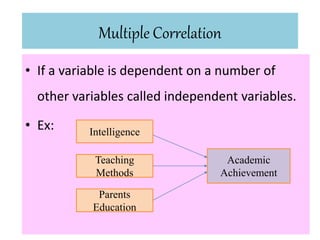
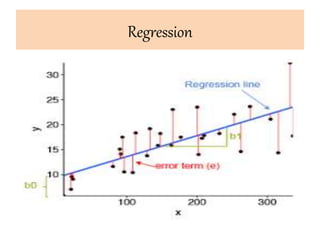
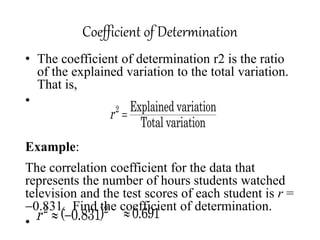
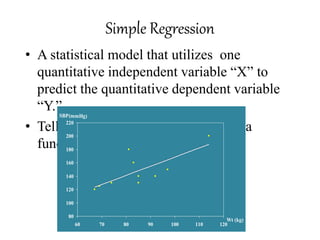
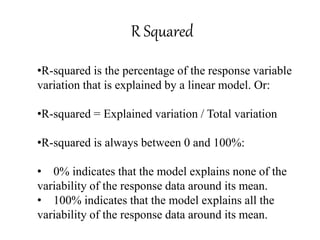
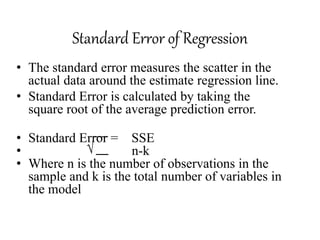
Correlation Coefficient
&
Regression Analysis
Correlation coefficient
• Relationship between two variables can be represented
graphically by a straight line, it is known as linear
correlation.
• Correlation can be positive, negative or zero correlation.
• Express the degree of relationship b/w two variables is
called coefficient of correlation
• -1 ( indicating perfect negative correlation) to +1 (
indicating perfect positive correlation)
• Zero means no correlation
Positive relationship
Negative correlation
No relation
Simple Correlation coefficient (r)
• It is also called Pearson's correlation or product
moment correlation
coefficient.
• It measures the nature and strength between two
variables of
the quantitative type.
• The sign of r denotes the nature of association while
the value of r denotes the strength of association.
• If the sign is +ve this means the relation is direct
• While if the sign is -ve this means an inverse or indirect
relationship
• The value of r ranges between ( -1) and ( +1)
• The value of r denotes the strength of the
association as illustrated
by the following diagram.
• The range of the correlation coefficient is
1 to 1. If x and y have a strong positive
linear correlation, r is close to 1
• If r = Zero this means no association or
correlation between the two variables.
• If 0 < r < 0.25 = weak correlation.
• If 0.25 ≤ r < 0.75 = intermediate correlation.
• If 0.75 ≤ r < 1 = strong correlation.
• If r = l = perfect correlation.
Multiple Correlation
• If a variable is dependent on a number of
other variables called independent variables.
• Ex:
Academic
Achievement
Intelligence
Teaching
Methods
Parents
Education
Regression
Regression
• The coefficient of correlation tells us the way in
which two variables are related to each others.
• Coefficient of correlation b/w two variables
cannot predict the change in one variable in
systematic way, with the change in the other
variable.
• Regression help in the task of prediction.
• The process of predicting variable Y using
variable X
• Tells you how values in y change as a function of
changes in values of x
Coefficient of Determination
• The coefficient of determination r2 is the ratio
of the explained variation to the total variation.
That is,
•
Example:
The correlation coefficient for the data that
represents the number of hours students watched
television and the test scores of each student is r =
0.831. Find the coefficient of determination.
•
2 Explained variation
Total variation
r 
2 2
( 0.831)
r   0.691

Uses of Regression Analysis
• Regression analysis helps in establishing a
functional relationship between two or more
variables.
• Since most of the problems of psychology
analysis are based on cause and effect
relationships, the regression analysis is a highly
valuable tool in education and psychology
research.
• Regression analysis predicts the values of
dependent variables from the values of
independent variables
Simple Regression
• A statistical model that utilizes one
quantitative independent variable “X” to
predict the quantitative dependent variable
“Y.”
• Tells you how values in y change as a
function of changes in values of x
80
100
120
140
160
180
200
220
60 70 80 90 100 110 120
Wt (kg)
SBP(mmHg)
Multiple Regression
• A statistical model that utilizes two or more
quantitative and qualitative explanatory
variables (x1,..., xp) to predict a quantitative
dependent variable Y.
• Multiple regression analysis is a
straightforward extension of simple regression
analysis which allows more than one
independent variable
R Squared
•R-squared is the percentage of the response variable
variation that is explained by a linear model. Or:
•R-squared = Explained variation / Total variation
•R-squared is always between 0 and 100%:
• 0% indicates that the model explains none of the
variability of the response data around its mean.
• 100% indicates that the model explains all the
variability of the response data around its mean.
• The standard error measures the scatter in the
actual data around the estimate regression line.
• Standard Error is calculated by taking the
square root of the average prediction error.
• Standard Error = SSE
• n-k
• Where n is the number of observations in the
sample and k is the total number of variables in
the model
Standard Error of Regression

Regression &amp; correlation coefficient

  • 1.
  • 2.
    Correlation coefficient • Relationshipbetween two variables can be represented graphically by a straight line, it is known as linear correlation. • Correlation can be positive, negative or zero correlation. • Express the degree of relationship b/w two variables is called coefficient of correlation • -1 ( indicating perfect negative correlation) to +1 ( indicating perfect positive correlation) • Zero means no correlation
  • 3.
  • 4.
  • 5.
  • 6.
    Simple Correlation coefficient(r) • It is also called Pearson's correlation or product moment correlation coefficient. • It measures the nature and strength between two variables of the quantitative type. • The sign of r denotes the nature of association while the value of r denotes the strength of association. • If the sign is +ve this means the relation is direct • While if the sign is -ve this means an inverse or indirect relationship
  • 7.
    • The valueof r ranges between ( -1) and ( +1) • The value of r denotes the strength of the association as illustrated by the following diagram. • The range of the correlation coefficient is 1 to 1. If x and y have a strong positive linear correlation, r is close to 1
  • 9.
    • If r= Zero this means no association or correlation between the two variables. • If 0 < r < 0.25 = weak correlation. • If 0.25 ≤ r < 0.75 = intermediate correlation. • If 0.75 ≤ r < 1 = strong correlation. • If r = l = perfect correlation.
  • 10.
    Multiple Correlation • Ifa variable is dependent on a number of other variables called independent variables. • Ex: Academic Achievement Intelligence Teaching Methods Parents Education
  • 11.
  • 12.
    Regression • The coefficientof correlation tells us the way in which two variables are related to each others. • Coefficient of correlation b/w two variables cannot predict the change in one variable in systematic way, with the change in the other variable. • Regression help in the task of prediction. • The process of predicting variable Y using variable X • Tells you how values in y change as a function of changes in values of x
  • 13.
    Coefficient of Determination •The coefficient of determination r2 is the ratio of the explained variation to the total variation. That is, • Example: The correlation coefficient for the data that represents the number of hours students watched television and the test scores of each student is r = 0.831. Find the coefficient of determination. • 2 Explained variation Total variation r  2 2 ( 0.831) r   0.691 
  • 14.
    Uses of RegressionAnalysis • Regression analysis helps in establishing a functional relationship between two or more variables. • Since most of the problems of psychology analysis are based on cause and effect relationships, the regression analysis is a highly valuable tool in education and psychology research. • Regression analysis predicts the values of dependent variables from the values of independent variables
  • 15.
    Simple Regression • Astatistical model that utilizes one quantitative independent variable “X” to predict the quantitative dependent variable “Y.” • Tells you how values in y change as a function of changes in values of x 80 100 120 140 160 180 200 220 60 70 80 90 100 110 120 Wt (kg) SBP(mmHg)
  • 16.
    Multiple Regression • Astatistical model that utilizes two or more quantitative and qualitative explanatory variables (x1,..., xp) to predict a quantitative dependent variable Y. • Multiple regression analysis is a straightforward extension of simple regression analysis which allows more than one independent variable
  • 17.
    R Squared •R-squared isthe percentage of the response variable variation that is explained by a linear model. Or: •R-squared = Explained variation / Total variation •R-squared is always between 0 and 100%: • 0% indicates that the model explains none of the variability of the response data around its mean. • 100% indicates that the model explains all the variability of the response data around its mean.
  • 18.
    • The standarderror measures the scatter in the actual data around the estimate regression line. • Standard Error is calculated by taking the square root of the average prediction error. • Standard Error = SSE • n-k • Where n is the number of observations in the sample and k is the total number of variables in the model Standard Error of Regression