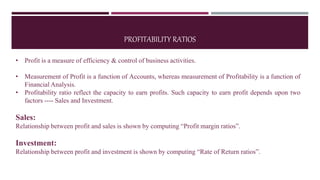
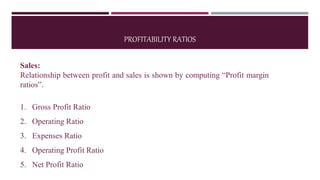
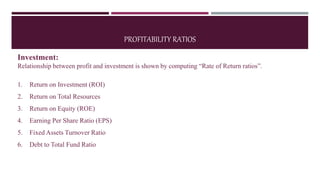
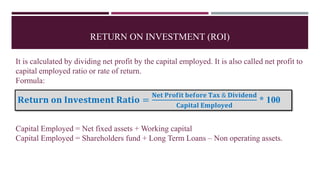
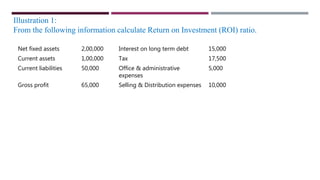
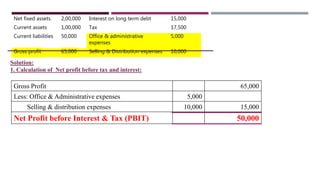
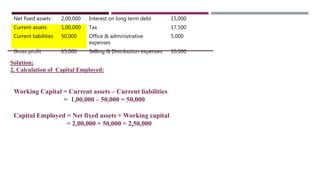
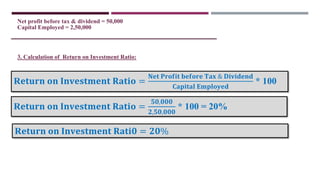
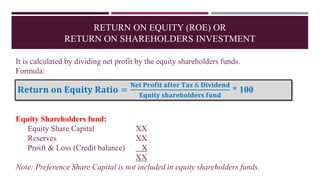
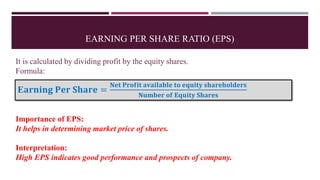
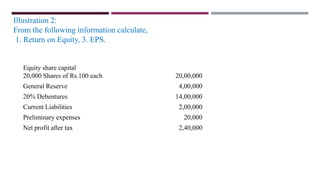
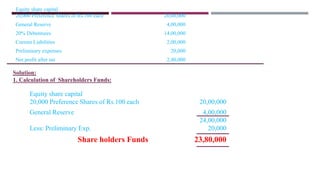
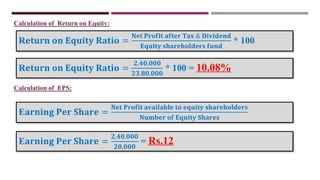
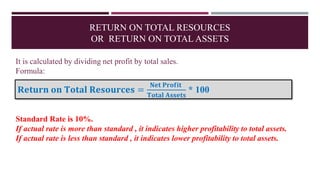
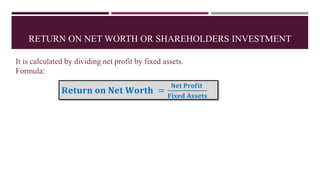
Investment:
Relationship between profit and investment is shown by computing “Rate of Return ratios”.
Return on Investment (ROI)
Return on Total Resources
Return on Equity (ROE)
Earning Per Share Ratio (EPS)
Fixed Assets Turnover Ratio
Debt to Total Fund Ratio
3. Classification of Accounting Ratio
Types of ratios are given below:
1. Liquidity Ratios
2. Leverage Ratio
3. Turnover Ratio
4. Profitability Ratio
4. PROFITABILITY RATIOS
• Profit is a measure of efficiency & control of business activities.
• Measurement of Profit is a function of Accounts, whereas measurement of Profitability is a function of
Financial Analysis.
• Profitability ratio reflect the capacity to earn profits. Such capacity to earn profit depends upon two
factors ---- Sales and Investment.
Sales:
Relationship between profit and sales is shown by computing “Profit margin ratios”.
Investment:
Relationship between profit and investment is shown by computing “Rate of Return ratios”.
5. PROFITABILITY RATIOS
Sales:
Relationship between profit and sales is shown by computing “Profit margin ratios”.
Investment:
Relationship between profit and investment is shown by computing “Rate of Return ratios”.
6. PROFITABILITY RATIOS
Sales:
Relationship between profit and sales is shown by computing “Profit margin
ratios”.
1. Gross Profit Ratio
2. Operating Ratio
3. Expenses Ratio
4. Operating Profit Ratio
5. Net Profit Ratio
7. PROFITABILITY RATIOS
Investment:
Relationship between profit and investment is shown by computing “Rate of Return ratios”.
1. Return on Investment (ROI)
2. Return on Total Resources
3. Return on Equity (ROE)
4. Earning Per Share Ratio (EPS)
5. Fixed Assets Turnover Ratio
6. Debt to Total Fund Ratio
8. RETURN ON INVESTMENT (ROI)
It is calculated by dividing net profit by the capital employed. It is also called net profit to
capital employed ratio or rate of return.
Formula:
Capital Employed = Net fixed assets + Working capital
Capital Employed = Shareholders fund + Long Term Loans – Non operating assets.
R𝐞𝐭𝐮𝐫𝐧 𝐨𝐧 𝐈𝐧𝐯𝐞𝐬𝐭𝐦𝐞𝐧𝐭 𝐑𝐚𝐭𝐢𝐨 =
𝐍𝐞𝐭 𝐏𝐫𝐨𝐟𝐢𝐭 𝐛𝐞𝐟𝐨𝐫𝐞 𝐓𝐚𝐱 & 𝐃𝐢𝐯𝐢𝐝𝐞𝐧𝐝
𝐂𝐚𝐩𝐢𝐭𝐚𝐥 𝐄𝐦𝐩𝐥𝐨𝐲𝐞𝐝
* 100
9. Illustration 1:
From the following information calculate Return on Investment (ROI) ratio.
Net fixed assets 2,00,000 Interest on long term debt 15,000
Current assets 1,00,000 Tax 17,500
Current liabilities 50,000 Office & administrative
expenses
5,000
Gross profit 65,000 Selling & Distribution expenses 10,000
10. Net fixed assets 2,00,000 Interest on long term debt 15,000
Current assets 1,00,000 Tax 17,500
Current liabilities 50,000 Office & administrative
expenses
5,000
Gross profit 65,000 Selling & Distribution expenses 10,000
Solution:
1. Calculation of Net profit before tax and interest:
Gross Profit 65,000
Less: Office & Administrative expenses 5,000
Selling & distribution expenses 10,000 15,000
Net Profit before Interest & Tax (PBIT) 50,000
11. Net fixed assets 2,00,000 Interest on long term debt 15,000
Current assets 1,00,000 Tax 17,500
Current liabilities 50,000 Office & administrative
expenses
5,000
Gross profit 65,000 Selling & Distribution expenses 10,000
Solution:
2. Calculation of Capital Employed:
Working Capital = Current assets – Current liabilities
= 1,00,000 – 50,000 = 50,000
Capital Employed = Net fixed assets + Working capital
= 2,00,000 + 50,000 = 2,50,000
13. RETURN ON EQUITY (ROE) OR
RETURN ON SHAREHOLDERS INVESTMENT
It is calculated by dividing net profit by the equity shareholders funds.
Formula:
Equity Shareholders fund:
Equity Share Capital XX
Reserves XX
Proift & Loss (Credit balance) X
XX
Note: Preference Share Capital is not included in equity shareholders funds.
R𝐞𝐭𝐮𝐫𝐧 𝐨𝐧 𝐄𝐪𝐮𝐢𝐭𝐲 𝐑𝐚𝐭𝐢𝐨 =
𝐍𝐞𝐭 𝐏𝐫𝐨𝐟𝐢𝐭 𝐚𝐟𝐭𝐞𝐫 𝐓𝐚𝐱 & 𝐃𝐢𝐯𝐢𝐝𝐞𝐧𝐝
𝐄𝐪𝐮𝐢𝐭𝐲 𝐬𝐡𝐚𝐫𝐞𝐡𝐨𝐥𝐝𝐞𝐫𝐬 𝐟𝐮𝐧𝐝
* 100
14. EARNING PER SHARE RATIO (EPS)
It is calculated by dividing profit by the equity shares.
Formula:
Importance of EPS:
It helps in determining market price of shares.
Interpretation:
High EPS indicates good performance and prospects of company.
E𝐚𝐫𝐧𝐢𝐧𝐠 𝐏𝐞𝐫 𝐒𝐡𝐚𝐫𝐞 =
𝐍𝐞𝐭 𝐏𝐫𝐨𝐟𝐢𝐭 𝐚𝐯𝐚𝐢𝐥𝐚𝐛𝐥𝐞 𝐭𝐨 𝐞𝐪𝐮𝐢𝐭𝐲 𝐬𝐡𝐚𝐫𝐞𝐡𝐨𝐥𝐝𝐞𝐫𝐬
𝐍𝐮𝐦𝐛𝐞𝐫 𝐨𝐟 𝐄𝐪𝐮𝐢𝐭𝐲 𝐒𝐡𝐚𝐫𝐞𝐬
15. Illustration 2:
From the following information calculate,
1. Return on Equity, 3. EPS.
Equity share capital
20,000 Shares of Rs.100 each 20,00,000
General Reserve 4,00,000
20% Debentures 14,00,000
Current Liabilities 2,00,000
Preliminary expenses 20,000
Net profit after tax 2,40,000
16. Equity share capital
20,000 Preference Shares of Rs.100 each 20,00,000
General Reserve 4,00,000
20% Debentures 14,00,000
Current Liabilities 2,00,000
Preliminary expenses 20,000
Net profit after tax 2,40,000
Solution:
1. Calculation of Shareholders Funds:
Equity share capital
20,000 Preference Shares of Rs.100 each 20,00,000
General Reserve
Less: Preliminary Exp.
4,00,000
24,00,000
20,000
Share holders Funds 23,80,000
18. Net fixed assets 2,00,000 Interest on long term debt 15,000
Current assets 1,00,000 Tax 17,500
Current liabilities 50,000 Office & administrative
expenses
5,000
Gross profit 65,000 Selling & Distribution expenses 10,000
Solution:
2. Calculation of Capital Employed:
Working Capital = Current assets – Current liabilities
= 1,00,000 – 50,000 = 50,000
Capital Employed = Net fixed assets + Working capital
= 2,00,000 + 50,000 = 2,50,000
20. RETURN ON TOTAL RESOURCES
OR RETURN ON TOTAL ASSETS
It is calculated by dividing net profit by total sales.
Formula:
Standard Rate is 10%.
If actual rate is more than standard , it indicates higher profitability to total assets.
If actual rate is less than standard , it indicates lower profitability to total assets.
R𝐞𝐭𝐮𝐫𝐧 𝐨𝐧 𝐓𝐨𝐭𝐚𝐥 𝐑𝐞𝐬𝐨𝐮𝐫𝐜𝐞𝐬 =
𝐍𝐞𝐭 𝐏𝐫𝐨𝐟𝐢𝐭
𝐓𝐨𝐭𝐚𝐥 𝐀𝐬𝐬𝐞𝐭𝐬
* 100
21. RETURN ON NET WORTH OR SHAREHOLDERS INVESTMENT
It is calculated by dividing net profit by fixed assets.
Formula:
R𝐞𝐭𝐮𝐫𝐧 𝐨𝐧 𝐍𝐞𝐭 𝐖𝐨𝐫𝐭𝐡 =
𝐍𝐞𝐭 𝐏𝐫𝐨𝐟𝐢𝐭
𝐅𝐢𝐱𝐞𝐝 𝐀𝐬𝐬𝐞𝐭𝐬