Downloaded 151 times


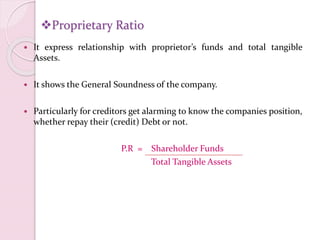
![II.DEBTORTURNOVERRATIO
It is also called, Receivable turnover Ratio or debtors velocity.
It measures the number of times the receivables are rotated in a year in
terms of sales.
It is relationship between total sales and closing balance of debtors.
D.T.R = Net Credit sales (total sales- [cash sales + sales
returns])
Avg. Debtors – avg. B/R (Trade Debtor)
Note: Bad debts & their provision are not deducted from total Debtors .
The higher ratio indicates that the debts are being collected
promptly.
AVERAGE COLLECTION PERIOD ( Avg. No of days for which a firm
has to wait before its receivables are collected into cash).
A.C.P= Months or days in a year
Debtors turnover Ratio](https://image.slidesharecdn.com/ratioanalysis-170201123300/85/Ratio-analysis-28-320.jpg)


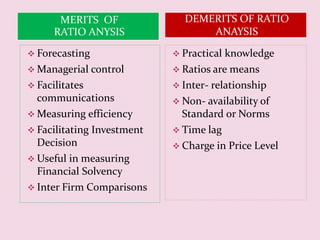
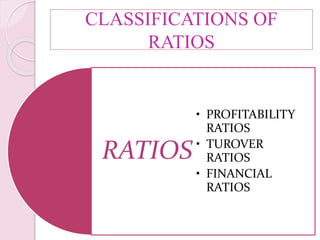
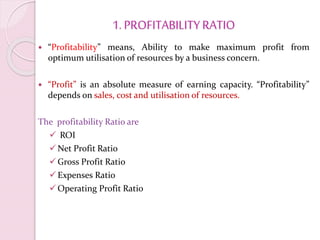
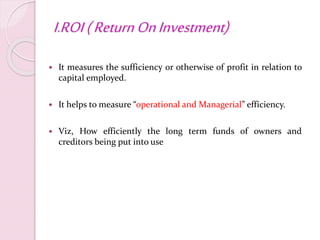
The document presents an overview of ratio analysis in management accounting, detailing the introduction, processes, and various types of ratios, including profitability, turnover, and solvency ratios. It provides formulas and explanations for key ratios such as return on investment, gross profit ratio, and current ratio, highlighting their significance in assessing financial performance. Additionally, it discusses the merits and demerits of ratio analysis, emphasizing its role in financial decision-making.