
Recommended
More Related Content
What's hot
What's hot (20)
Similar to fm_formula__ipcc-2.pdf
Similar to fm_formula__ipcc-2.pdf (20)
More from hitishaagrawal
Recently uploaded
Recently uploaded (20)
fm_formula__ipcc-2.pdf
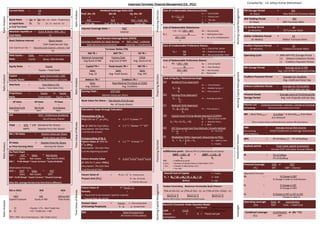
- 1. Compiled By: - CA. Aditya Kumar Maheshwari Ratio Analysis Ratio Analysis Ratio Analysis Ratio Analysis Working Capital Management Financing Decision Financing Decision Financing Decision Working Capital Management Working Capital Management Leverages Investment Decision Time Value of Money Time Value of Money Ratio Analysis Ratio Analysis Current Ratio = CA CL Quick Ratio = QA or QA (QA = CA – Stock – Prapaid Exp.) or Liquid Ratio QL CL (QL = CL – Bank OD - CC) or Acid Test Ratio Absolute Liquidity or = (Cash & Bank +Mkt. Sec.) Cash Ratio CL Basic Defense Interval = Quick Assets Cash Expenses per Day Cash Expense per day = (Operating Cash Expense + Interest + Tax) 365 Debt Equity = Debt (Debt = Long Term Funds & Debentures)) Ratio Equity (Equity = (ESC+PSC+R&S)) Capital = Long Term Funds + PSC Gearing Ratio Equity Shareholder’s Fund Proprietary = Equity or Equity Ratio Total Assets Equity + TOL OP Ratio NP Ratio PV Ratio = = = Operating Profit Net Profit Contribution Sales Sales Sales EPS = (PAT - Preference Dividend) No of Equity Shares Yield = DPS * 100 (Dividend Per Share) MPPS (Market Price Per Share) IRR = Base Rate(Min) + Δ in Rate * Δ Desired(Amt) from Base Δ in Amount (This is simple unitary method formula, practice IRR Calculation) Payback period = Total initial capital investment Annual CFAT and other Annual Inflows Tandon Committee: Maximum Permissible Bank Finance= 75% of (CA-CL) or (75% of CA) – CL or {75% of (CA- CCA)} – CL Method 1 Method 2 Method 3 Where, CCA is Core / Permanent Current Assets Cost of Irredeemable Debentures/Debt: K d = Cost of Debt Kd = I (1 – t) I = Interest amt NP t = Tax rate NP = Net proceeds/market price Cost of Redeemable Debentures: I (1 – t) + (RV – NP) NP = Net proceeds Kd = N ___ RV = Redemption Value (RV + NP) N = No. of Yrs of Redemption 2 Cost of Equity / Retained Earnings: (a) Dividend Price Approach: Ke = Cost of equity Ke = D1 D1 = Dividend of year 1 P0 P0 = Price of year 0 (b) Earning Price Approach: Ke = E1 E1 = Earnings of year 1 P0 (c) Realized Yield Approach: Ke = D1 + (P1-P0) P1 = Price of year 1 P0 (d) Capital Asset Pricing Model Approach (CAPM): Rm = Rate of return of Mkt Ke = Rf + b ( Rm – Rf) Rf = Risk free return b = Beta (e) DCF (Discounted Cash Flow Method) / Growth Method: Ke = D1 + G D1 = D0 (1+G) P0 (f) Modigillani Miller Approach (Assuming no PSC): Ke = Ko + D (Ko – Kd) D = Debt or Loan E E = Equity Overall Cost of Capital E = Equity Ko = (Kd * D) + (Kp* P) + (Ke * E) D = Debt D+P+E P = PSC Alternative Formula: OL = % Change in EBIT % Change in Sales or Contribution FL = % Change in EBT % Change in EBIT CL = % Change in EBT or PAT or EPS Change in Sales % Indifference point: (Where EPS of 2 Alternatives are Same) (EBIT – I1)(1 − t) = (EBIT − I 2) (1 − t) E1 E2 EBIT = Indifference point E1 & E2 = Number of Equity Shares in Alternative 1 & 2 I1 & I2 = Interest in Alternative 1 & 2 t = Tax-rate Du Pont Chart ROE = PAT * Sales * Net Assets Sales Net Assets Net Worth (NW) ROE = Profit Margin * Assets Turnover * Equity Multiplier Alternative Formula, ROE = EBIT * Sales * PAT Sales Net Assets EBIT ROE = Profit Margin * Assets Turnover * Financial Leverage Note: (Fin. Leverage Formula in Du Pont Chart is different.) NPV = PV of Inflow (-) PV of Outflow Baumol’s Economic Order Quantity Model Cash Deposit = Optimum cash balance Cash = 2 A O A = Annual cash disbursement Deposit C O = Fixed cost per transaction. C = Cost of Rs. 1 p.a. ROI or ROCE ROE ROA = = = PBIT * PAT PBIT or PAT Capital Employed Equity or NW Total Assets CE = Equity + LTL – Non Trade Invt. Or CE = FA + Trade Invt. + WC * PBIT = PBIT + Non Trade Expense – Non Trade Income Operating Leverage: Cont. or Contribution (OL) EBIT Cont. – Fixed Cost Financial Leverage: EBIT or EBIT (FL) EBT EBIT - Interest Combined Leverage: Contribution or (OL * FL) (CL) EBT MV / BV Ratio = Market Value per Share Book Value per Share Debt Ratio = Total Debt or TOL Equity + Total Debt (TOL) Equity Ratio = Equity Equity + Total Debt RM Storage Period = 365 (In Days) Raw Material Turnover Ratio WIP Holding Period = 365 (In Days) WIP Turnover Ratio FG Holding Period = 12 (In Months) FG Turnover Ratio Debtor Collection Period = 52 (In Weeks) Debtor Turnover Ratio Creditor Payment Period = 12 (In Months) CreditorsTurnover Ratio Operating Cycle = (RM+WIP+FG) Storage Period (+) Debtors Collection Period (-) Creditors Payment Period PI = PV of Inflow PV of Outflow Future Value of = P0 (1 + i) n P0 = Present Amt Present Amt (FVn) N = No. of Period I = Interest Rate per Period ARR = Average Annual Net Income (Accounting Initial Investment or Average Investment rate of Return) Turnover Ratios (TR) RM TR = WIP TR = FG TR = Material Consumed Avg Stock of RM Factory Cost Avg Cost of WIP COGS Avg. Stock of FG Capital TR = Fixed Assets TR = WC TR = Sales `Avg. CE Sales Avg. Fixed Assets Sales Avg. WC Debtors TR = Creditors TR = Sales Avg. Debtors Raw Material Purchase or COGS Avg. Creditors Future Value of = R * (1+i) n – 1 Annuity i R = Equal Amt to be received / paid for n period i = Interest Rate per period Present Value = Amount k = Discounting Rate of Growing Perpetuity k – g g = Growth Rate Cost of Irredeemable Preference Shares: K p = Cost of Pref. Shares Kp = PD PD = Preference Dividend NP NP = Net proceeds/Mkt. Price Cost of Redeemable Preference Shares: PD + (RV – NP) Kp = Cost of capital Ke = N PD = Pref. Dividend (RV + NP) NP = Net Proceeds 2 RV = Redn Value Dividend Coverage Ratio (CR) Pref. Div. CR Div CR Eq. Div. CR = = = ____PAT_______ PAT PAT – Pref. Div. Pref. Div Pref. Div & Eq. Div Equity Div. Debt Service Coverage Ratio (DSCR) Earnings Available for Debt Service or PAT + Dep n + Interest Debt Service Commitments (Interest + Installment) PE Ratio = Market Price Per Share or Price Earning Ratio Earning Per Share Earning Yield = EPS*100 Market Value per Share Book Value Per Share = Net Worth-Pref Sh.Cap No. of Equity Shares Calculation Steps through Calculator: Discounting of Rs. 1: PV@10% for 5 th yrs (PV5) → 1.1“÷” 5 times “=” AV @ 10% for 5 yrs (AV5) → 1.1 “÷” 5times “=” “GT” (Assumption: The Cash Flow is at the end of year) Compounding of Rs 1: Future Value @ 10% for → 1.1 “*” 4 times “=” 5 th yr (FV5) (Assumption: The Cash Flow is at the beginning of year) Future Annuity Value → 1.1+1*1.1+1*1.1+1*1.1+1 @ 10% for 5 years (FAV5) (Assumption: The Cash Flow is at the end of Year) RM storage Period = Average stock of RM Avg. cost of RM Consumption/day Creditors Payment Period = Average A/c Payables Avg. credit purchase/ day Debtors Collection Period = Average A/c Receivables Avg. Credit Sales per day Finished Goods = Average stock of Finished goods Storage Period Avg. cost of goods sold per day EMI = Total Principal Amt AV Factor of the period Important Formulae: Financial Management (CA - IPCC) Effective Cost = (Factoring Commission + Interest) – (Savings on Factoring) of Factoring Net amount Received from Factor Interest Coverage Ratio = PBIT Interest