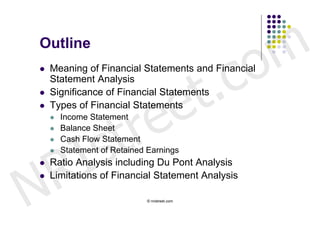
Financial Statement
                                 c o m
                   t .
               Analysis

                 e
             tr e
     Financial Policy and Planning


    R I s
N                                    © nristreet.com
Outline


                                               c o m
                             t .
   Meaning of Financial Statements and Financial


                           e
    Statement Analysis


                          e
   Significance of Financial Statements


                        r
    Types of Financial Statements


                       t



            s
       Income Statement


          I
       Balance Sheet
       Cash Flow Statement


        R
       Statement of Retained Earnings


N
   Ratio Analysis including Du Pont Analysis
   Limitations of Financial Statement Analysis

                             © nristreet.com
Focus


                                             c o m
                          t .
   The focus will be on financial statement analysis and


                        e
    its use in corporate finance.


                       e
   financial statement analysis from managerial


                    tr
    perspective and not from an investor and/or


         s
    creditor’s perspective.


       I
   How to use financial statement analysis to ensure


     R
    that shareholder wealth is maximized and the stock
    price continues to rise?


N                         © nristreet.com
Meaning of Financial
Statements


                                           c o m
                       t .
        Financial statements are summaries of the


                     e
         operating, financing, and investment activities


                    e
         of a firm.


                  r
        According to the Financial Accounting


                 t
         Standards Board (FASB), the financial


        s
         statements of a firm should provide sufficient


      I
         information that is useful to
          investors and


    R
          creditors


N
          in making their investment and credit
            decisions in an informed way.

                       © nristreet.com
c o m
                            t .
   The financial statements are expected to be prepared in


                          e
    accordance with a set of standards known as generally


                         e
    accepted accounting principles (GAAP).


                       r
   The financial statements of publicly traded firms must be


                      t
    audited at least annually by independent public


         s
    accountants.


       I
   The auditors are expected to attest to the fact that these


     R
    financial statements of a firm have been prepared in
    accordance with GAAP.


N                            © nristreet.com
m
        Significance of Financial


                                                       c o
        Statements

    


                          e t .
        Wall Street analysts and other sophisticated investors prefer
        such financial disclosure documents as 10-Ks, which contain


                         e
        more detailed information about the company


                       r
       Financial statements summarize and provide an overview of


                      t
        events relating to the functioning of a firm.


        s
       Financial statement analysis helps identify


      I
           a firm’s strengths and
           weaknesses


    R
           so that management can take advantage of a firm’s
            strengths and make plans to counter weaknesses of


N
            the firm.
       The strengths must be understood if they are to be used to
        proper advantage and weaknesses must be recognized if
        corrective action needs to be taken
                              © nristreet.com
c o m
                              t .
   For example, are inventories adequate to support the projected


                            e
    level of sales?
    Does the firm have too heavy an investment in account


                           e

    receivable?


                        tr
   Does large account receivable reflect a lax collection policy?


         s
   To ensure efficient operations of a firm’s manufacturing facility,
    does the firm have too much or too little invested in plant and


       I
    equipment?


     R
   Financial statement analysis provides answers to all of these
    questions.


N                               © nristreet.com
m
Types of Financial Statements and


                                      o
Reports




                   t .
    The Income Statement
                                    c
                 e
   The Balance Sheet


              r e
   The Statement of Retained


        s    t
    Earnings


      I
   The Statement of Cash Flows


N   R             © nristreet.com
The Income Statement


                                                 c o m
                        t .
     An income statement is a summary of the revenues and


                      e
      expenses of a business over a period of time, usually either


                     e
      one month, three months, or one year.


                   r
     Summarizes the results of the firm’s operating and financing


                  t
      decisions during that time.


        s
     Operating decisions of the company apply to production and


      I
      marketing such as sales/revenues, cost of goods sold,
      administrative and general expenses (advertising, office


    R
      salaries)
     Provides operating income/earnings before interest and


N
      taxes (EBIT)


                          © nristreet.com
c o m
                        t .
 Results of financing decisions are reflected in the


                      e
  remainder of the income statement.


                     e
 When interest expenses and taxes are subtracted


                   r
  from EBIT, the result is net income available to


                  t
  shareholders.


        s
 Net income does not necessarily equal actual cash


      I
  flow from operations and financing.


N   R                   © nristreet.com
m
The Balance Sheet


                                              .                                            c o
                                            t
   A summary of the assets, liabilities, and equity of a business at a particular point in time, usually at the
    end of the firm’s fiscal year.


                                          e
Assets                   =            Liabilities          +        Equity


                                         e
(Resources of the                     (Obligations of               (ownership left over


                                       r
business enterprise)                  the business)                 Residual)


                                      t
Fixed Assets                          Long-term                Common stock outstanding


          s
(Plant, Machinery, Equipment          (Notes, bonds, &         Additional paid-in capital
Buildings)                            Capital Lease            Retained Earnings


        I
Current Assets                        Obligation)
(Cash, Marketable Securities,         Current Liabilities


      R
Account Receivable, Inventories)      (Accounts Payable,
                                      Wages and salaries,
                                      Short-term loans


N
                                      Any portion of long-term
                                      Indebtedness due in one-year)


                                                  © nristreet.com
m
THE STATEMENT OF CASH


                                                                     o
FLOWS



                                   t .                             c
    The statement is designed to show how the firm’s operations have


                                 e
    affected its cash position and to help answer questions such as these:


                                e
       Is the firm generating the cash needed to purchase additional fixed assets


                              r
        for growth?


                             t
       Is the growth so rapid that external financing is required both to maintain


            s
        operations and for investment in new fixed assets?


          I
       Does the firm have excess cash flows that can be used to repay debt or to


        R
        invest in new products?


N                                     © nristreet.com
m
RATIO ANALYSIS


                             .                    c o
                           t
       Financial statements report both on a firm’s


                         e
        position at a point in time and on its operations


                        e
        over some past period.


                      r
       From management’s viewpoint, financial


                     t
        statement analysis is useful both as a way to


        s
           anticipate future conditions and


      I
           more important, as a starting point for planning


    R
            actions
           that will influence the future course of events or


N
           to show whether a firm’s position has been improving
            or deteriorating over time.


                            © nristreet.com
c o m
                               t .
   Ratio analysis begins


                             e
       with the calculation of a set of financial ratios


                            e
       designed to show the relative strengths and


                          r
       weaknesses of a company as compared to


                         t
         Other firms in the industry


            s
         Leadings firms in the industry


          I
         The previous year of the same firm


        R
   Ratio analysis helps to show whether the firm’s
    position has been improving or deteriorating


N
   Ratio analysis can also help plan for the future

                                 © nristreet.com
m
     Types of Ratios


                            .                      c o
                          t
        Liquidity Ratios


                        e
                Current Ratio
                Quick Ratio/Acid Test Ratio


                       e
        Asset Management Ratios


                     r
                Inventory Turnover Ratio
                Days Sales Outstanding


                    t
                Fixed Assets Turnover Ratio


        s
                Total Assets Turnover Ratio
        Debt Management Ratio


      I
                Total Debt to Total Assets Ratio
                Times Interest Covered Ratio


    R
        Profitability Ratios
                Profit Margin on Sales


N
                Return on Assets
                Return on Equity
                Basic Earning Power Ratio


                               © nristreet.com
Liquidity Ratio


                                                c o m
                            t .
   A liquid asset is one that can be easily


                          e
    converted into cash at a fair market value


                         e
   Liquidity question deals with this question


                      tr
       Will the firm be able to meet its current


        s
        obligations?


      I
   Two measures of liquidity


    R
       Current Ratio


N
       Quick/Acid Test Ratio


                             © nristreet.com
Asset Management Ratios


                                                 c o m
                              t .
   Asset management ratio measures how effectively


                            e
    the firm is managing/using its assets


                           e
   Do we have too much investment in assets or too


                        tr
    little investment in assets in view of current and


            s
    projected sales levels?


          I
   What happens if the firm has


        R
       Too much investment in assets


N
       Too little investment in assets


                               © nristreet.com
Asset Management Ratios


                                                      c o m
                              t .
   Inventory Turnover Ratio


                            e
       Measures the efficiency of Inventory Management


                           e
       A high ratio indicates that inventory does not remain in


                         r
        warehouses or on shelves, but rather turns over rapidly


                        t
        into sales


          I s
   Two cautions
        Market prices for sales and inventories at cost


        R
    

       Sales over the year and inventory at the end of the year


N                              © nristreet.com
Asset Management Ratio


                                                     c o m
                              t .
   Days Sales Outstanding (DSO)


                            e
       To appraise the quality of accounts receivables


                           e
       Average length of time that the firm must wait after making


                         r
        a sale before receiving cash from customers


                        t
       Measures effectiveness of a firm credit policy


            s
       Indicates the level of investment needed in receivables to


          I
        maintain firm’s sales level


        R
   What happens if this ratio is
       Too high, or


N
       Too low


                               © nristreet.com
Asset Management Ratios


                                            c o m
                          t .
   Fixed Assets Turnover Ratio


                        e
       Measures efficiency of long-term capital


                     r e
        investment


                    t
       How effectively a firm is using its plant and


        s
        machinery to generate sales?


      I
       How much fixed assets are needed to achieve a


    R
        particular level of sales?


N
   Cautions

                          © nristreet.com
Asset Management Ratio


                                              c o m
                           t .
   Total Asset Turnover Ratio


                         e
       Measure efficiency of total assets for the company


                      r e
        as a whole or for a division of the firm


                     t
       Core competency


    R I s
N                          © nristreet.com
Debt Management Ratio


                                                  c o m
                             t .
   Implications of use of borrowings


                           e
       Creditors look to Stockholders’ equity as a safety


                        r e
        margin


                       t
       Interest on borrowings is a legal liability of the firm


        s
        Interest is to be paid out of operating income


      I
    

       Debt magnifies return and risk to common


    R
        stockholders


N                            © nristreet.com
c o m
                           t .
   Total Debt to Total Assets Ratio


                         e
       Measures percentage of assets being financed


                      r e
        through borrowings


                     t
       Too high a number means increased risk of


        s
        bankruptcy


      I
   Leverage


    R
       What percentage of total assets are being


N
        financed through equity?


                           © nristreet.com
c o m
                            t .
   Times Earned Interest (TIE)


                          e
       Measure the extent to which operating income


                       r e
        can decline before the firm is unable to meet its


                      t
        annual interest costs


        s
       Failure to pay interest can result in legal action by


      I
        creditors with possible bankruptcy for the firm


N   R                        © nristreet.com
Profitability Ratios


                                         c o m
                        t .
   Net result of a number of policies and


                      e
    decisions


                   r e
   Show the combined effect of liquidity, asset


                  t
    management, and debt management on


      I s
    operating results


N   R                  © nristreet.com
c o m
                             t .
   Net Profit Margin on Sales


                           e
     Relates net income available to common stockholders to sales
   Basic Earning Power


                          e
     Relates EBIT to Total Assets


                        r
     Useful for comparing firms with different tax situations and


                       t
      different degrees of financial leverage


         s
   Return on Assets (ROA)


       I
     Relates net income available to common stockholders to total
      assets


     R
   Return on Common Equity (ROE)
     Relates net income available to common stockholders to


N
      common stockholders equity


                               © nristreet.com
m
    PROBLEMS IN FINANCIAL


                                         o
    STATEMENT ANALYSIS



                     t .               c
    Developing and Using Comparative Data


                   e
   Distortion of Comparative Data


                  e



                r
    Notes to Financial Statements


               t
   Interpretation of Results


        s



      I
    Differences in Accounting Treatment
   Window Dressing


    R
   Effects of Inflation


N                    © nristreet.com

Financial Statement Analysis

  • 1.
    Financial Statement c o m t . Analysis e tr e Financial Policy and Planning R I s N © nristreet.com
  • 2.
    Outline c o m t .  Meaning of Financial Statements and Financial e Statement Analysis e  Significance of Financial Statements r Types of Financial Statements t  s  Income Statement I  Balance Sheet  Cash Flow Statement R  Statement of Retained Earnings N  Ratio Analysis including Du Pont Analysis  Limitations of Financial Statement Analysis © nristreet.com
  • 3.
    Focus c o m t .  The focus will be on financial statement analysis and e its use in corporate finance. e  financial statement analysis from managerial tr perspective and not from an investor and/or s creditor’s perspective. I  How to use financial statement analysis to ensure R that shareholder wealth is maximized and the stock price continues to rise? N © nristreet.com
  • 4.
    Meaning of Financial Statements c o m t .  Financial statements are summaries of the e operating, financing, and investment activities e of a firm. r  According to the Financial Accounting t Standards Board (FASB), the financial s statements of a firm should provide sufficient I information that is useful to  investors and R  creditors N  in making their investment and credit decisions in an informed way. © nristreet.com
  • 5.
    c o m t .  The financial statements are expected to be prepared in e accordance with a set of standards known as generally e accepted accounting principles (GAAP). r  The financial statements of publicly traded firms must be t audited at least annually by independent public s accountants. I  The auditors are expected to attest to the fact that these R financial statements of a firm have been prepared in accordance with GAAP. N © nristreet.com
  • 6.
    m Significance of Financial c o Statements  e t . Wall Street analysts and other sophisticated investors prefer such financial disclosure documents as 10-Ks, which contain e more detailed information about the company r  Financial statements summarize and provide an overview of t events relating to the functioning of a firm. s  Financial statement analysis helps identify I  a firm’s strengths and  weaknesses R  so that management can take advantage of a firm’s strengths and make plans to counter weaknesses of N the firm.  The strengths must be understood if they are to be used to proper advantage and weaknesses must be recognized if corrective action needs to be taken © nristreet.com
  • 7.
    c o m t .  For example, are inventories adequate to support the projected e level of sales? Does the firm have too heavy an investment in account e  receivable? tr  Does large account receivable reflect a lax collection policy? s  To ensure efficient operations of a firm’s manufacturing facility, does the firm have too much or too little invested in plant and I equipment? R  Financial statement analysis provides answers to all of these questions. N © nristreet.com
  • 8.
    m Types of FinancialStatements and o Reports  t . The Income Statement c e  The Balance Sheet r e  The Statement of Retained s t Earnings I  The Statement of Cash Flows N R © nristreet.com
  • 9.
    The Income Statement c o m t .  An income statement is a summary of the revenues and e expenses of a business over a period of time, usually either e one month, three months, or one year. r  Summarizes the results of the firm’s operating and financing t decisions during that time. s  Operating decisions of the company apply to production and I marketing such as sales/revenues, cost of goods sold, administrative and general expenses (advertising, office R salaries)  Provides operating income/earnings before interest and N taxes (EBIT) © nristreet.com
  • 10.
    c o m t .  Results of financing decisions are reflected in the e remainder of the income statement. e  When interest expenses and taxes are subtracted r from EBIT, the result is net income available to t shareholders. s  Net income does not necessarily equal actual cash I flow from operations and financing. N R © nristreet.com
  • 11.
    m The Balance Sheet . c o t  A summary of the assets, liabilities, and equity of a business at a particular point in time, usually at the end of the firm’s fiscal year. e Assets = Liabilities + Equity e (Resources of the (Obligations of (ownership left over r business enterprise) the business) Residual) t Fixed Assets Long-term Common stock outstanding s (Plant, Machinery, Equipment (Notes, bonds, & Additional paid-in capital Buildings) Capital Lease Retained Earnings I Current Assets Obligation) (Cash, Marketable Securities, Current Liabilities R Account Receivable, Inventories) (Accounts Payable, Wages and salaries, Short-term loans N Any portion of long-term Indebtedness due in one-year) © nristreet.com
  • 12.
    m THE STATEMENT OFCASH o FLOWS  t . c The statement is designed to show how the firm’s operations have e affected its cash position and to help answer questions such as these: e  Is the firm generating the cash needed to purchase additional fixed assets r for growth? t  Is the growth so rapid that external financing is required both to maintain s operations and for investment in new fixed assets? I  Does the firm have excess cash flows that can be used to repay debt or to R invest in new products? N © nristreet.com
  • 13.
    m RATIO ANALYSIS . c o t  Financial statements report both on a firm’s e position at a point in time and on its operations e over some past period. r  From management’s viewpoint, financial t statement analysis is useful both as a way to s  anticipate future conditions and I  more important, as a starting point for planning R actions  that will influence the future course of events or N  to show whether a firm’s position has been improving or deteriorating over time. © nristreet.com
  • 14.
    c o m t .  Ratio analysis begins e  with the calculation of a set of financial ratios e  designed to show the relative strengths and r  weaknesses of a company as compared to t  Other firms in the industry s  Leadings firms in the industry I  The previous year of the same firm R  Ratio analysis helps to show whether the firm’s position has been improving or deteriorating N  Ratio analysis can also help plan for the future © nristreet.com
  • 15.
    m Types of Ratios . c o t  Liquidity Ratios e Current Ratio Quick Ratio/Acid Test Ratio e  Asset Management Ratios r Inventory Turnover Ratio Days Sales Outstanding t Fixed Assets Turnover Ratio s Total Assets Turnover Ratio  Debt Management Ratio I Total Debt to Total Assets Ratio Times Interest Covered Ratio R  Profitability Ratios Profit Margin on Sales N Return on Assets Return on Equity Basic Earning Power Ratio © nristreet.com
  • 16.
    Liquidity Ratio c o m t .  A liquid asset is one that can be easily e converted into cash at a fair market value e  Liquidity question deals with this question tr  Will the firm be able to meet its current s obligations? I  Two measures of liquidity R  Current Ratio N  Quick/Acid Test Ratio © nristreet.com
  • 17.
    Asset Management Ratios c o m t .  Asset management ratio measures how effectively e the firm is managing/using its assets e  Do we have too much investment in assets or too tr little investment in assets in view of current and s projected sales levels? I  What happens if the firm has R  Too much investment in assets N  Too little investment in assets © nristreet.com
  • 18.
    Asset Management Ratios c o m t .  Inventory Turnover Ratio e  Measures the efficiency of Inventory Management e  A high ratio indicates that inventory does not remain in r warehouses or on shelves, but rather turns over rapidly t into sales I s  Two cautions Market prices for sales and inventories at cost R   Sales over the year and inventory at the end of the year N © nristreet.com
  • 19.
    Asset Management Ratio c o m t .  Days Sales Outstanding (DSO) e  To appraise the quality of accounts receivables e  Average length of time that the firm must wait after making r a sale before receiving cash from customers t  Measures effectiveness of a firm credit policy s  Indicates the level of investment needed in receivables to I maintain firm’s sales level R  What happens if this ratio is  Too high, or N  Too low © nristreet.com
  • 20.
    Asset Management Ratios c o m t .  Fixed Assets Turnover Ratio e  Measures efficiency of long-term capital r e investment t  How effectively a firm is using its plant and s machinery to generate sales? I  How much fixed assets are needed to achieve a R particular level of sales? N  Cautions © nristreet.com
  • 21.
    Asset Management Ratio c o m t .  Total Asset Turnover Ratio e  Measure efficiency of total assets for the company r e as a whole or for a division of the firm t  Core competency R I s N © nristreet.com
  • 22.
    Debt Management Ratio c o m t .  Implications of use of borrowings e  Creditors look to Stockholders’ equity as a safety r e margin t  Interest on borrowings is a legal liability of the firm s Interest is to be paid out of operating income I   Debt magnifies return and risk to common R stockholders N © nristreet.com
  • 23.
    c o m t .  Total Debt to Total Assets Ratio e  Measures percentage of assets being financed r e through borrowings t  Too high a number means increased risk of s bankruptcy I  Leverage R  What percentage of total assets are being N financed through equity? © nristreet.com
  • 24.
    c o m t .  Times Earned Interest (TIE) e  Measure the extent to which operating income r e can decline before the firm is unable to meet its t annual interest costs s  Failure to pay interest can result in legal action by I creditors with possible bankruptcy for the firm N R © nristreet.com
  • 25.
    Profitability Ratios c o m t .  Net result of a number of policies and e decisions r e  Show the combined effect of liquidity, asset t management, and debt management on I s operating results N R © nristreet.com
  • 26.
    c o m t .  Net Profit Margin on Sales e  Relates net income available to common stockholders to sales  Basic Earning Power e  Relates EBIT to Total Assets r  Useful for comparing firms with different tax situations and t different degrees of financial leverage s  Return on Assets (ROA) I  Relates net income available to common stockholders to total assets R  Return on Common Equity (ROE)  Relates net income available to common stockholders to N common stockholders equity © nristreet.com
  • 27.
    m PROBLEMS IN FINANCIAL o STATEMENT ANALYSIS  t . c Developing and Using Comparative Data e  Distortion of Comparative Data e  r Notes to Financial Statements t  Interpretation of Results s  I Differences in Accounting Treatment  Window Dressing R  Effects of Inflation N © nristreet.com