![Matlab Code for PWM:
%%pwm code
close all
clear all
clc
%%initialisation
f=200;
t=0:0.000025:0.005*2;
fclk=2000;
fs=1/0.000025
fcut=1500;
m=1+0.75*sin(2*pi*f.*t);
saw=1+sawtooth(2*pi*fclk.*t)
o=zeros(1,length(m));
for i=1:length(m)
if m(i)>saw(i)
o(i)=1;
end
end
[b,a]=butter(10,fcut/fs);
mf=filter(b,a,o);
num=b
den=a
bode(tf(num,den))
figure
plot(t,mf,t,m)
title('demodulation, and the original signal')
xlabel('time'); ylabel('amplitude')
figure
plot(t,o)
title('PWM signal')
xlabel('time'); ylabel('amplitude')
figure
plot(t,o,'r',t,m,'black',t,saw,'blue')
title('all signals')
xlabel('time'); ylabel('amplitude')
figure
plot(t,m)
title('msg signal')
xlabel('time'); ylabel('amplitude')](https://image.slidesharecdn.com/ppmpwm-130818054612-phpapp02/85/EEP306-pulse-width-modulation-3-320.jpg)
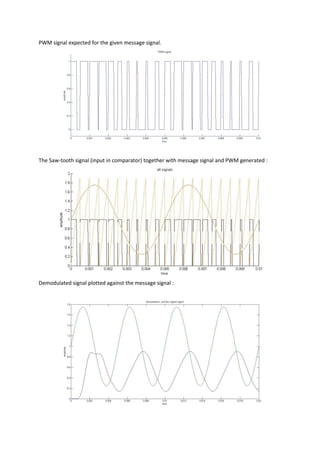

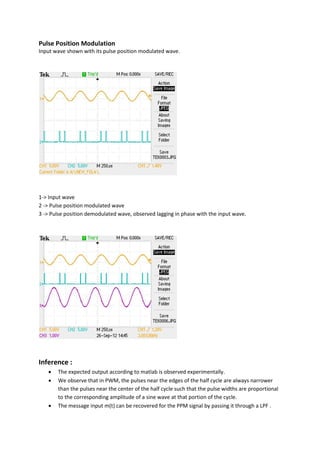

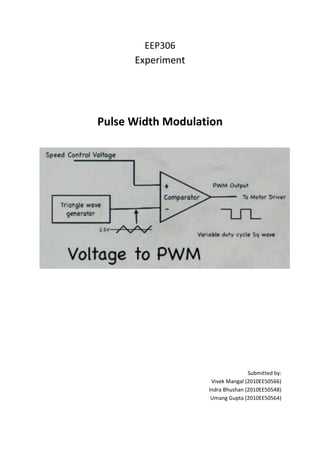
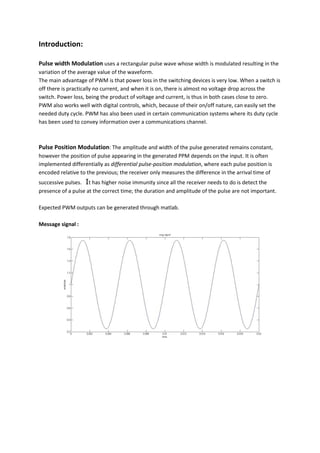
1. The document describes an experiment on pulse width modulation and pulse position modulation. It includes the introduction, expected PWM output generated through Matlab code, observation and inference. 2. The Matlab code generates a PWM signal for a given message signal by comparing it with a sawtooth carrier signal. The demodulated signal is obtained by filtering the PWM signal. 3. For PPM, the position of the pulse changes according to the input signal while its amplitude and width remain constant. The message signal can be recovered by passing the PPM signal through a low-pass filter.