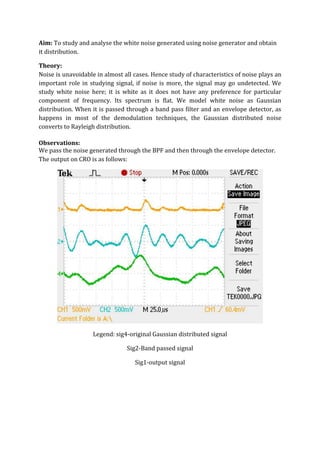
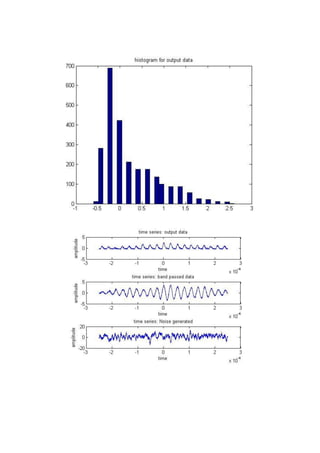
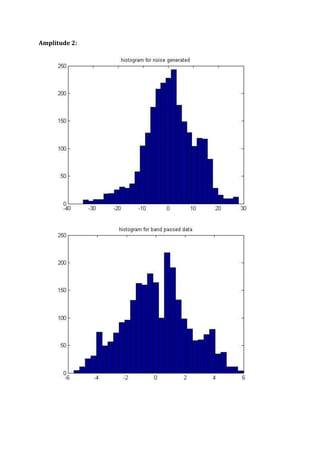
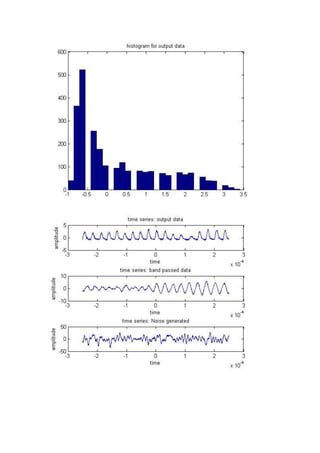
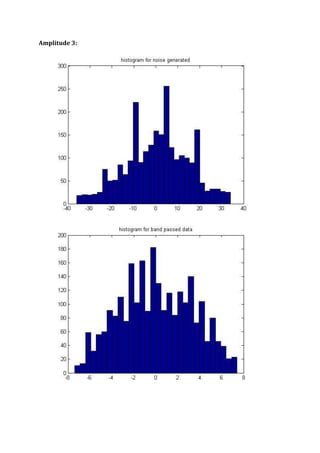
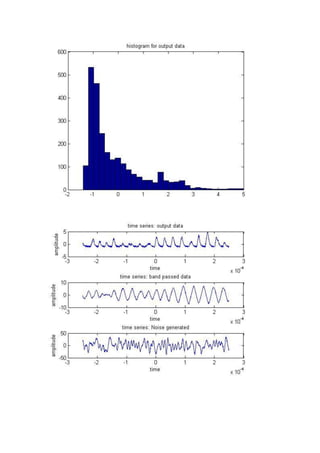
EEP316 Laboratory
Noise Generation Histogram
13/2/13
Indra Bhushan 2010EE50548
Umang Gupta 2010EE50564
Vivek Mangal 2010EE50566
Aim: To study and analyse the white noise generated using noise generator and obtain
it distribution.
Theory:
Noise is unavoidable in almost all cases. Hence study of characteristics of noise plays an
important role in studying signal, if noise is more, the signal may go undetected. We
study white noise here; it is white as it does not have any preference for particular
component of frequency. Its spectrum is flat. We model white noise as Gaussian
distribution. When it is passed through a band pass filter and an envelope detector, as
happens in most of the demodulation techniques, the Gaussian distributed noise
converts to Rayleigh distribution.
Observations:
We pass the noise generated through the BPF and then through the envelope detector.
The output on CRO is as follows:
Legend: sig4-original Gaussian distributed signal
Sig2-Band passed signal
Sig1-output signal
Histograms:
We recorded the data for three different noise amplitudes (levels) and histogram
outputs are as follows:
Amplitude1:
Amplitude 2:
Amplitude 3:
Results and conclusions:
Histogram plots of generated noise resemble that of Gaussian. Hence it is verified that the
noise is Gaussian. Also the histogram plots of band pass filtered output show that the noise
is still Gaussian, however it is amplified and the shape is changed that is due to the fact that
bandpass filtered is tapered at the sides and it is not an ideal band-pass filter. Hence the
variance will change.
The output signal i.e. the output of the envelope detector when plotted resembles the
Rayleigh distribution. Hence, envelope detector transforms the Gaussian noise to Rayleigh
noise.

EEL316: Noise generation histogram

  • 1.
    EEP316 Laboratory Noise GenerationHistogram 13/2/13 Indra Bhushan 2010EE50548 Umang Gupta 2010EE50564 Vivek Mangal 2010EE50566
  • 2.
    Aim: To studyand analyse the white noise generated using noise generator and obtain it distribution. Theory: Noise is unavoidable in almost all cases. Hence study of characteristics of noise plays an important role in studying signal, if noise is more, the signal may go undetected. We study white noise here; it is white as it does not have any preference for particular component of frequency. Its spectrum is flat. We model white noise as Gaussian distribution. When it is passed through a band pass filter and an envelope detector, as happens in most of the demodulation techniques, the Gaussian distributed noise converts to Rayleigh distribution. Observations: We pass the noise generated through the BPF and then through the envelope detector. The output on CRO is as follows: Legend: sig4-original Gaussian distributed signal Sig2-Band passed signal Sig1-output signal
  • 3.
    Histograms: We recorded thedata for three different noise amplitudes (levels) and histogram outputs are as follows: Amplitude1:
  • 5.
  • 7.
  • 9.
    Results and conclusions: Histogramplots of generated noise resemble that of Gaussian. Hence it is verified that the noise is Gaussian. Also the histogram plots of band pass filtered output show that the noise is still Gaussian, however it is amplified and the shape is changed that is due to the fact that bandpass filtered is tapered at the sides and it is not an ideal band-pass filter. Hence the variance will change. The output signal i.e. the output of the envelope detector when plotted resembles the Rayleigh distribution. Hence, envelope detector transforms the Gaussian noise to Rayleigh noise.