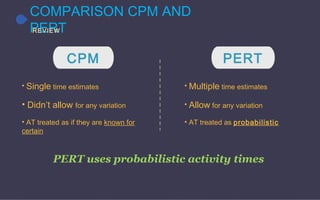
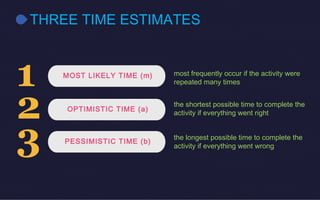
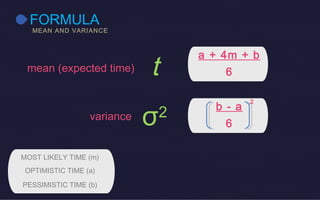
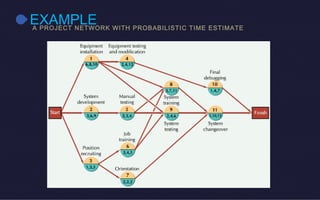
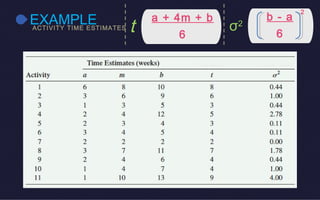
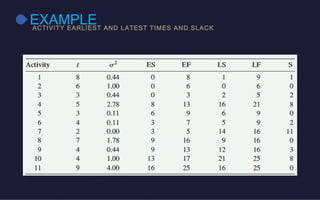
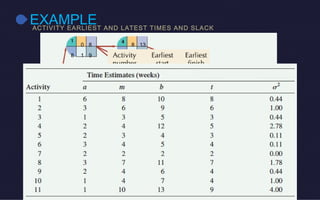
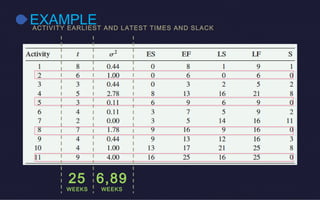
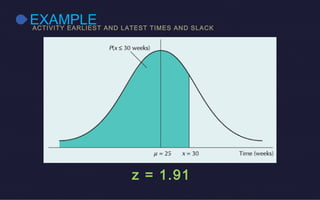
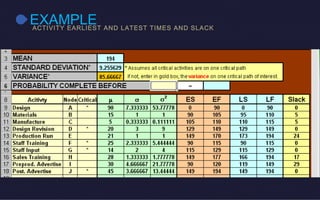
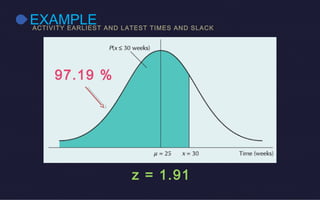
Probabilistic Activity Times
Probabilistic Time Estimates
Carrine Kezia Aulia :: 102183022
• Single time estimates
• Didn’t allow for any variation
• AT treated as if they are known for
certain
COMPARISON CPM AND
PERTREVIEW
• Multiple time estimates
• Allow for any variation
• AT treated as probabilistic
PERT uses probabilistic activity times
CPM PERT
Approach to estimating activity times
WHAT IS PROBABILISTIC ACTIVITY
TIMES?What’s it all about?
• Completion time estimates can be estimated using the
Three Time EstimateThree Time Estimate approachapproach
• In this approach, three time estimates are required for each activity
MOST LIKELY TIME (m)
THREE TIME ESTIMATES
OPTIMISTIC TIME (a)
PESSIMISTIC TIME (b)
1
2
3
most frequently occur if the activity were
repeated many times
the shortest possible time to complete the
activity if everything went right
the longest possible time to complete the
activity if everything went wrong
with THREE TIME estimates, the activity completion
time
can be approximated by a BETA DISTRIBUTION
BETA DISTRIBUTION
BETA DISTRIBUTIONS CAN COME IN A VARIETY OF SHAPES :
FORMULA
MEAN AND VARIANCE
a + 4m + b
6
b - a
6
2
mean (expected time)
variance σ2
t
MOST LIKELY TIME (m)
OPTIMISTIC TIME (a)
PESSIMISTIC TIME (b)
EXAMPLEA PROJECT NETWORK WITH PROBABILISTIC TIME ESTIMATE
EXAMPLEACTIVITY TIME ESTIMATES
a + 4m + b
6
b - a
6
2
t σ2
EXAMPLEACTIVITY EARLIEST AND LATEST TIMES AND SLACK
0
8
8 8
5
13
0
6
6
3
0 3
3
6 9
4
3 7
2
3 5
7
9 16
4
9 13
4
13 17
9
16 25
2516
2521
2116
169
1612
1614
95
52
9660
91
EXPECTED TIME : 25
CRITICAL PATH :
2-5-8-11
EXAMPLEACTIVITY EARLIEST AND LATEST TIMES AND SLACK
25
WEEKS
6,89
WEEKS
EXAMPLEPROBABILISTIC ANALYSIS OF THE PROJECT NETWORK
ADD ALL THE σ2
OFF THE CRITICAL
PATH
S
D
what does this formula means?
what does these numbers mean?
EXAMPLEPROBABILISTIC ANALYSIS OF THE PROJECT NETWORK
25
WEEKS
6,89
WEEKS
2,62
WEEKS
EXPECTED TIME
μ
σ2
σ
EXAMPLEPROBABILISTIC ANALYSIS OF THE PROJECT NETWORK
25
WEEKS
EXPECTED TIME
μ
30
WEEKS
PROPOSED PROJECT TIME
X WHAT IS THE
PROBABILITY THAT
THE SYSTEM WILL BE
READY BY THAT
TIME?
WHAT IS THE
PROBABILITY THAT
THE SYSTEM WILL BE
READY BY THAT
TIME?
EXAMPLEPROBABILISTIC ANALYSIS OF THE PROJECT NETWORK
Z =
X – μ
σ
30
WEEKS
25
WEEKS
2.62
-
= 1.911.91
EXAMPLEACTIVITY EARLIEST AND LATEST TIMES AND SLACK
z = 1.91
EXAMPLEACTIVITY EARLIEST AND LATEST TIMES AND SLACK
0.9719
probability of completing
the project in 30 days
0.9719
probability of completing
the project in 30 days
EXAMPLEACTIVITY EARLIEST AND LATEST TIMES AND SLACK
www.measuringusability.com
EXAMPLEACTIVITY EARLIEST AND LATEST TIMES AND SLACK
z = 1.91
97.19 %
Probabilistic Activity Time

Probabilistic Activity Time

  • 1.
    Probabilistic Activity Times ProbabilisticTime Estimates Carrine Kezia Aulia :: 102183022
  • 2.
    • Single timeestimates • Didn’t allow for any variation • AT treated as if they are known for certain COMPARISON CPM AND PERTREVIEW • Multiple time estimates • Allow for any variation • AT treated as probabilistic PERT uses probabilistic activity times CPM PERT
  • 3.
    Approach to estimatingactivity times WHAT IS PROBABILISTIC ACTIVITY TIMES?What’s it all about? • Completion time estimates can be estimated using the Three Time EstimateThree Time Estimate approachapproach • In this approach, three time estimates are required for each activity
  • 4.
    MOST LIKELY TIME(m) THREE TIME ESTIMATES OPTIMISTIC TIME (a) PESSIMISTIC TIME (b) 1 2 3 most frequently occur if the activity were repeated many times the shortest possible time to complete the activity if everything went right the longest possible time to complete the activity if everything went wrong
  • 5.
    with THREE TIMEestimates, the activity completion time can be approximated by a BETA DISTRIBUTION BETA DISTRIBUTION BETA DISTRIBUTIONS CAN COME IN A VARIETY OF SHAPES :
  • 6.
    FORMULA MEAN AND VARIANCE a+ 4m + b 6 b - a 6 2 mean (expected time) variance σ2 t MOST LIKELY TIME (m) OPTIMISTIC TIME (a) PESSIMISTIC TIME (b)
  • 7.
    EXAMPLEA PROJECT NETWORKWITH PROBABILISTIC TIME ESTIMATE
  • 8.
    EXAMPLEACTIVITY TIME ESTIMATES a+ 4m + b 6 b - a 6 2 t σ2
  • 9.
    EXAMPLEACTIVITY EARLIEST ANDLATEST TIMES AND SLACK
  • 10.
    EXAMPLEACTIVITY EARLIEST ANDLATEST TIMES AND SLACK 0 8 8 8 5 13 0 6 6 3 0 3 3 6 9 4 3 7 2 3 5 7 9 16 4 9 13 4 13 17 9 16 25 2516 2521 2116 169 1612 1614 95 52 9660 91 EXPECTED TIME : 25 CRITICAL PATH : 2-5-8-11
  • 11.
    EXAMPLEACTIVITY EARLIEST ANDLATEST TIMES AND SLACK 25 WEEKS 6,89 WEEKS
  • 12.
    EXAMPLEPROBABILISTIC ANALYSIS OFTHE PROJECT NETWORK ADD ALL THE σ2 OFF THE CRITICAL PATH S D what does this formula means? what does these numbers mean?
  • 13.
    EXAMPLEPROBABILISTIC ANALYSIS OFTHE PROJECT NETWORK 25 WEEKS 6,89 WEEKS 2,62 WEEKS EXPECTED TIME μ σ2 σ
  • 14.
    EXAMPLEPROBABILISTIC ANALYSIS OFTHE PROJECT NETWORK 25 WEEKS EXPECTED TIME μ 30 WEEKS PROPOSED PROJECT TIME X WHAT IS THE PROBABILITY THAT THE SYSTEM WILL BE READY BY THAT TIME? WHAT IS THE PROBABILITY THAT THE SYSTEM WILL BE READY BY THAT TIME?
  • 15.
    EXAMPLEPROBABILISTIC ANALYSIS OFTHE PROJECT NETWORK Z = X – μ σ 30 WEEKS 25 WEEKS 2.62 - = 1.911.91
  • 16.
    EXAMPLEACTIVITY EARLIEST ANDLATEST TIMES AND SLACK z = 1.91
  • 17.
    EXAMPLEACTIVITY EARLIEST ANDLATEST TIMES AND SLACK
  • 18.
    EXAMPLEACTIVITY EARLIEST ANDLATEST TIMES AND SLACK 0.9719 probability of completing the project in 30 days 0.9719 probability of completing the project in 30 days
  • 19.
    EXAMPLEACTIVITY EARLIEST ANDLATEST TIMES AND SLACK www.measuringusability.com
  • 20.
    EXAMPLEACTIVITY EARLIEST ANDLATEST TIMES AND SLACK z = 1.91 97.19 %

Editor's Notes

  • #3 CPM : A single estimates for activity times did not allow for any variation in activity times Activity times were treated as if they were known for certain PERT: multiple time estimates allow for variation in activity times