Python, the Language of Science and Engineering for EngineersBoey Pak Cheong
A talk given in November 2016 at IEM Malaysia to engineers, who are new to Python, a broad perspective of what Python is, why it is important to learn it and how it can help in solving/visualization of engineering and scientific tasks and problems.
Cheat Sheet for Machine Learning in Python: Scikit-learnKarlijn Willems
Get started with machine learning in Python thanks to this scikit-learn cheat sheet, which is a handy one-page reference that guides you through the several steps to make your own machine learning models. Thanks to the code examples, you won't get lost!
Quick introduction to Python for Pace University undergraduate students. Includes an intro to Jupyter Notebook, the Python libraries scikit-learn and pandas.
Relationship Among Token, Lexeme & PatternBharat Rathore
Relationship among Token, Lexeme and Pattern
Outline
Token
Lexeme
Pattern
Relationship
Tokens : A token is sequence of characters that can be treated
as a unit/single logical entity.
Examples
Keywords
Examples : for, while, if etc.
Identifier
Examples : Variable name, function name, etc.
Operators
Examples : '+', '++', '-' etc.
Separators
Examples : ',' ';' etc.
Pattern
Pattern is a rule describing all those lexemes that can represent a particular token in a source language.
Lexeme
It is a sequence of characters in the source program that is matched by the pattern for a token.
Example : “float”, “=“, “223”, “;”
Learn Python Programming | Python Programming - Step by Step | Python for Beg...Edureka!
( Python Training : https://www.edureka.co/python )
This Edureka “Python Programming" introduces you to Python by giving you enough reasons to learn it. It will then take you to its various fundamentals along with a practical demonstrating the various libraries such as Numpy, Pandas, Matplotlib and Seaborn. This video helps you to learn the below topics:
1. Why should you go for Python?
2. Introduction to Python Programming Language
3. How to work with Jupyter?
4. Python Programming Fundamentals: Operators & Data Types
5. Libraries: Numpy, Pandas, Matplotlib, Seaborn
Youtube Link: https://youtu.be/woVJ4N5nl_s
** Python Certification Training: https://www.edureka.co/data-science-python-certification-course **
This Edureka PPT on 'Python Basics' will help you understand what exactly makes Python special and covers all the basics of Python programming along with examples.
Follow us to never miss an update in the future.
YouTube: https://www.youtube.com/user/edurekaIN
Instagram: https://www.instagram.com/edureka_learning/
Facebook: https://www.facebook.com/edurekaIN/
Twitter: https://twitter.com/edurekain
LinkedIn: https://www.linkedin.com/company/edureka
Castbox: https://castbox.fm/networks/505?country=in
Python is an interpreted, object-oriented, high-level programming language with dynamic semantics. Its high-level built in data structures, combined with dynamic typing and dynamic binding, make it very attractive for Rapid Application Development, as well as for use as a scripting or glue language to connect existing components together. Python's simple, easy to learn syntax emphasizes readability and therefore reduces the cost of program maintenance. Python supports modules and packages, which encourages program modularity and code reuse. The Python interpreter and the extensive standard library are available in source or binary form without charge for all major platforms, and can be freely distributed.
Netbox Day 2020 - An automation approach to automating Network Configuration Backups using Netbox (Inventory), Github (Storage), and Ansible (process execution)
R is a programming language and software environment for statistical analysis, graphics representation and reporting. Are You Interested to Learning R Programming in Best Institute Join Besant Technologies in Bangalore.
Even the best, biggest, beachiest data out there is useless if users can't easily search and analyze it. Under the right circumstances, a custom query language can be a powerful interface to that data, but only if that interface is chosen and developed consciously, with top priority given to creating a fitting domain abstraction, a first-class user experience, and a simple yet flexible implementation that doesn't reinvent the wheel.
These are takeaways from the real-world experiences of ÜberResearch and Valo: two different companies with very different needs, which nevertheless ended up taking similar approaches to the selection and creation of query languages as data interfaces. From the lessons they've learned -- some more painfully than others -- we'll construct a roadmap for choosing, designing, and implementing a custom query language that lets your users interact with your big, beautiful data in all its glory.
this presentation will walk you through basic introduction to python, major features of python, how python runs on our system and some important commands used in python.
Lesson in Feasibility Study- Critical Path method, Critical Path AnalysisHoly Angel University
This lesson in Feasibility Study deals with the Critical Path Method and its analysis for the college students to check on their steps in processes' most critical activities to be supervised most. It include computation in Earliest Finish Time and Earliest Start Time.
Critical Path MethodIntroductionOnce you have the network diag.docxannettsparrow
Critical Path Method
Introduction
Once you have the network diagrams for the activities, as well as the activity duration estimates, you can begin scheduling the project. The critical path method (CPM) is one of the key techniques for developing a project schedule.
In a schedule network diagram, the critical path is the longest full path linking activities that must be performed in sequence. It's important to identify this path, because if one of its activities is delayed, the end date of your project is delayed too.
CPM provides a way to calculate four time boundaries:
· the early start date, which is the earliest possible start date for each activity to begin
· the early finish date, which is the earliest date each activity can end
· the latest start date, which is the latest possible time for each activity to begin
· the latest finish date, which is the latest date each activity can end
CPM involves completing three steps:
1. performing a forward pass through the network diagram
2. performing a backward pass to check your initial results
3. calculating the float for each activity to determine the critical path
The forward pass
The first step in CPM is performing a forward pass through the schedule network diagram so you can establish the early start and finish dates for each activity. This is done so that resources, such as project team members and equipment, can be allocated as soon as possible. Allocating resources assists in determining project expenditure and therefore establishing the project budget.
When performing a forward pass, you begin with the first activity in the network diagram and move forward. You
1. record the earliest date the first activity can start
2. add the duration of this activity to the early start date
3. subtract one day from the result
Some project managers find it useful to record activities' start and finish times in the network diagram. The early start is usually filled in on the top left corner of each activity block, with the early finish date shown in the right corner.
The backward pass
The second step in determining the critical path for a project is to perform a backward pass through the schedule network diagram.
You perform the backward pass to establish the latest start and finish dates for the project to remain on schedule.
In a backward pass, you start at the end of the project and work back, subtracting the estimated duration of each preceding activity.
To begin the backward pass, the late finish date will either be a hard date that's been set or the early finish date of the last activity in the project. An example of a hard date may be a deadline that determines the project's end date.
To calculate the late start date, you
1. subtract the duration of the last activity from its late finish date
2. add one day because the last day of the project is included as a working day
As you work backward through the schedule network diagram, the late finish date will fall on the working day preceding the lat.
My presentation slides for a technical dinner presentation I delivered for the PMI\'s Arabian Gulf Chapter in Al-Khobar, KSA, on June 21, 2010.
Yousef Abugosh, PMP
Chapter 08 of ICT Project Management based on IOE Engineering syllabus. This chapter contains activity definition, decomposition of activities,activity attributes, schedule development and control etc....Provided by Project Management Sir of KU.
Assignment 1 Identify elements of concern (e.g. resources.docxsherni1
Assignment 1:
Identify elements of concern (e.g. resources, time, cost, quality, scope, accessibility to interviewees,
generation a questionnaire, distributing the questionnaire, sample size, ability to analyze/verify the
results…) of your project and suggest what you intend to do about them.
PS: My Project about: Relationship between Money and Time with Virtualization Technology.
Minimum number of words 500, referencing with Harvard style and the number of references not less than
three Academic Articles or books.
Please, make sure that there is no Plagiarism
Assignment 2:
Create a Monthly/Weekly/Daily log. Analyze it according to the importance of the activities listed. Suggest
ways to reduce time on the unimportant activities in favor of the more important ones.
Minimum number of words 500, referencing with Harvard style and the number of references not less than
three Academic Articles or books.
Please, make sure that there is no Plagiarism
Introduction
All projects consume resources, including time and money, in order to deliver a
product of a particular scope and quality. There is thus always a tension between
the extent of resource input and the extend of product output. Additionally, there
is also tension between project management activities and project development
activities.
Dawson (2009: 4.1) provides a graphical presentation of this:
Project Management
Project Management concerns the planning and conduct of the project by
controlling and checking project progress, monitoring milestones and
deliverables, and managing risk.
The effort involved in project management should account for not more than 10%
of the overall effort but it will not be evenly distributed, as most of it is expended
towards the start of the project. A project can be conceived as product
2
development that is concerned with achieving the aims and objectives of the
project by producing the deliverables in accordance with the project plan, while
optimizing scope and quality of the deliverables relative to the resources
available.
Project Stages
From a project management perspective, projects proceed in five stages:
1. Definition - Deciding on a project; making a project proposal
2. Planning - Detailed planning of the project
3. Initiation - Organizing work (in particular, group work); literature survey
4. Control - Monitoring the progress of the project
5. Closure -Delivering/deploying result of the project; preparing final presentation;
writing up reports
Project Definition
Aims and objectives
It is important to decide and define a clear specification of what the project is to
achieve and adhere to it. Wavering between different aims might be disastrous to
the conduct of the project. Aims are broad statements of intent that identify the
proje ...
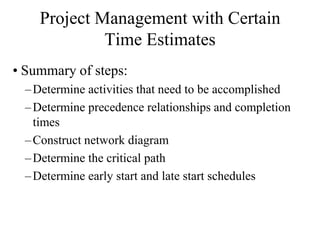
1. Project Management with Certain Time Estimates Summary of steps: Determine activities that need to be accomplished Determine precedence relationships and completion times Construct network diagram Determine the critical path Determine early start and late start schedules
2. Project Management: Scheduling Projects with Certain Time Estimates Create Network Diagram Based on order of precedence among activities
3. 3 5 1 2 6 7 8 4 Calculation of the Critical Path Network approach helps calculate project duration A “path” is a sequence of activities that begins at the start of the project and goes to the end of the project 1,2,3,5,6,7,8 1,2,4,6,7,8 The “critical path” is the path that takes the longest to complete and thus determines the minimum duration of the project
5. 3 5 1 2 6 7 8 4 2 weeks 3 weeks 4 weeks 10 weeks 16 weeks 4 weeks 1 week 4 weeks Calculation of the Critical Path Critical Path The path that takes the longest to complete
6. 2 weeks 3 weeks 3 5 4 weeks 10 weeks 16 weeks 4 weeks 1 week 1 2 6 7 8 4 weeks 4 Calculation of the Critical Path Critical Path The path that takes the longest to complete C.P. = 40 weeks
7. 3 5 1 2 6 7 8 5 X 4 2 weeks 3 weeks 4 weeks 10 weeks 16 weeks 4 weeks 1 week 4 weeks Calculation of the Critical Path It is possible for multiple Critical Paths to exist New information suggests that Activity 4 will take 5 weeks instead of 4
8. 5 X 2 weeks 3 weeks 3 5 4 weeks 10 weeks 16 weeks 4 weeks 1 week 1 2 6 7 8 5 weeks 4 Calculation of the Critical Path It is possible for multiple Critical Paths to exist New information suggests that Activity 4 will take 5 weeks instead of 4 C.P. = 40 weeks
9. 3 5 1 2 6 7 8 6 X 4 Calculation of the Critical Path Critical Path may also shift if non-critical activity is lengthened or Critical Path activity is shortened Another update indicates it will actually take 6 weeks for Activity 4 2 weeks 3 weeks 4 weeks 10 weeks 16 weeks 4 weeks 1 week 4 weeks
10. 6 X Calculation of the Critical Path Critical Path may also shift if non-critical activity is lengthened or Critical Path activity is shortened Another update indicates it will actually take 6 weeks for Activity 4 2 weeks 3 weeks 3 5 4 weeks 10 weeks 16 weeks 4 weeks 1 week 1 2 6 7 8 6 weeks 4 C.P. = 41 weeks
11. Determining Slack Slack - The amount of time an activity on a non-critical path can be delayed without affecting the duration of the project (i.e., without putting it on the critical path) Uses four calculated values Early start - Earliest an activity can start (based on prerequisites) Early finish - Earliest it can finish (based on prerequisites & duration) Late start - Latest an activity can start and not delay the project Late finish - Latest an activity can finish and not delay the project
12. Calculating Early Start (ES) and Early Finish (EF) Move from left to right in network ES for 1st activity usually zero EF equals ES plus activity duration ES is latest of the EF times of an activity’s predecessors THIS IS CALLED THE FORWARD PASS
13.
14. LF for last activity equals EF for last activity
17. LF is earliest of the LS times of an activity’s followersTHIS IS CALLED THE BACKWARD PASS
18.
19. Project Scheduling with Time Uncertainty Take three time estimates Optimistic - What is the (realistic) fastest we can get an activity done? Pessimistic - What is the (realistic) worst case scenario for delay? Most likely - What is our “most likely” estimate?
20. Project Scheduling with Time Uncertainty Calculate the “expected time” for the activity Where: Te = Expected Time o = Optimistic estimate m = Most likely estimate p = Worst-case (pessimistic) estimate
21. weeks Activity #1 weeks Activity #2 weeks Activity #3 Project Scheduling with Time Uncertainty
22. 2.17 weeks 3 weeks 3 5 4 weeks 10 weeks 16.17 weeks 4.17 weeks 1.17 weeks 1 2 6 7 8 4.17 weeks 4 Using Variation in Time Estimates to Assess Duration Probabilities How do we interpret this estimate??? Probability theory (“central limit theorem”) dictates that we assume that finish times across entire project are distributed “normally” Probabilistically: 50% chance we will finish faster, 50% chance we will finish slower C.P. = 40.68 weeks
23. Using Variation in Time Estimates to Access Duration Probabilities Note that this is , not 2 , We have to take the square root of the “variance” to get the standard deviation Where: Z = Number of standard deviations D is from Te Te = Expected Time D = Project duration I am thinking about
24. Using Variation in Time Estimates to Access Duration Probabilities We recognize that there is variation around our estimates We are estimating “most likely” or “expected” not “exact” Commonly assume a “Beta” distribution Another asymmetric distribution (because duration is never less than zero) Calculating variance of the activity’s duration estimate:
25. Activity #2 weeks Activity #3 weeks Using Variation in Time Estimates to Access Duration Probabilities Activity #1 weeks
26. Using Variation in Time Estimates to Assess Duration Probabilities Calculate Critical Path using Te Accumulate the variances of the individual activities Apply formula to estimate project duration probabilities Where: Z = Number of standard deviations D is from Te Te = Expected Time D = Activity duration I am thinking about
28. 3 5 1 2 6 7 8 4 2.17 weeks 3 weeks 4 weeks 10 weeks 16.17 weeks 4.17 weeks 1.17 weeks 4.17 weeks Using Variation in Time Estimates to Assess Duration Probabilities What is the probability of finishing in 39 weeks or less?
29. 2.17 weeks 3 weeks 3 5 4 weeks 10 weeks 16.17 weeks 4.17 weeks 1.17 weeks 1 2 6 7 8 4.17 weeks 4 Using Variation in Time Estimates to Assess Duration Probabilities Exhibit 8.22: Expected Values and Variances of Time Estimates What is the probability of finishing in 39 weeks or less? Critical Path = 40.68 weeks Sum of Variances = 2.56 weeks
30. Standard deviation difference between “most likely” and desired duration 1.6 = the square root of 2.56!!! Using Variation in Time Estimates to Assess Duration Probabilities Where: Z = Number of standard deviations D is from Te Te = Expected Time D = Activity duration I am thinking about So, I look up the cumulative probability [G(z)] of the activity being completed before -1.05 standard deviations from the “most likely” estimate… … and find out I have a 85.314% chance of finishing within 39 weeks!! FROM APPENDIX A PAGE A3
31. Find probability under G(z) in Appendix B and translate to number of standard deviations weeks!!! Using Variation in Time Estimates to Access Duration Probabilities So, what if I want to be 90 percent sure that I hit the project duration that I tell my boss I will (or she will fire me)? Reconfigure “Z” equation to solve for D Pick the value of “Z” that corresponds to the level of certainty I want (90% = +1.30) Solve What if I can stand to be only 80% sure??
32. Crashing Projects A methodical approach to reducing project duration Focus on the time of activities on the critical path Looking for greatest improvement with least cost Additional labor, machinery Overtime and temporary employees Premiums paid to outside contractors for early delivery Steps Create network Identify critical path Identify costs of reducing each activity on path Reduce most cost effective activity Look for critical path changes Beware of multiple critical paths Crash next activity
37. Crashing Projects: Look for Critical Path Changes 6 B 7 C 7 X A 8 D 10 F 8 H 5 E 12 G 9 Old Critical Path Completion = 35 days Activity C Crashed by 1 day project completion = 34 days Did that effect the critical path?
38. Crashing Projects: Look for Critical Path Changes 6 B 7 C 7 X A 8 D 10 F 8 H 5 E 12 G 9 Multiple Critical Paths Appear!!! Critical Path = 34 days
39. Path 1 Only Path 2 Only Both C.P. Crashing Projects: Crash Next Activity Exhibit 8.25: Crash Time and Costs