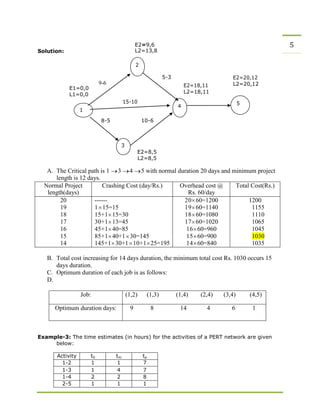
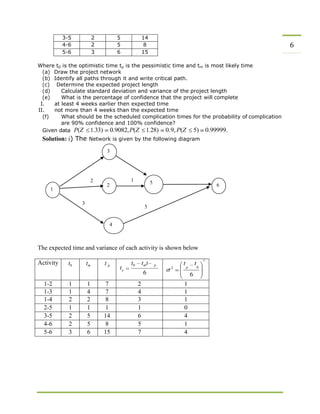
Network
PERT CPM
Introduction 1
Network is a technique used for planning and scheduling of large projects in the fields of
construction, maintenance, fabrication, purchasing, computer system instantiation, research
and development planning etc. There is multitude of operations research situations that can
be modeled and solved as network. Some recent surveys reports that as much as 70% of
the real-world mathematical programming problems can be represented by network related
models. Network analysis is known by many names _PERT (Programme Evaluation and
Review Technique), CPM (Critical Path Method), PEP (Programme Evaluation Procedure),
LCES (Least Cost Estimating and Scheduling), SCANS (Scheduling and Control by
Automated Network System), etc
This chapter will present three of algorithms.
1. PERT & CPM
2. Shortest- route algorithms
3. Maximum-flow algorithms
The Basic Terminology
Network
It is a graphical representation of logical and sequentially connected activities and events of
a project. Network is also called arrow diagram. PERT (Programme Evolution Review
Technique) and (Critical Path Method) are the two most widely applied techniques.
Project
A project is defined as a combination of interrelated activities which must be executed in a
certain order in for its completion.
Project Management Process
Network analysis is the general name given to certain specific techniques which can be used
for the planning, management and control of projects
Activity
Any individual operation, which utilizes resources and has an end and a beginning, is called
activity.
A task or a certain amount of work required in the project
Requires time to complete
Represented by an arrow
These are usually classified into four categories:
Predecessor activity
Successor activity
Concurrent activity
Dummy activity 2
Dummy Activity
It Indicates only precedence relationships and does not require any time of effort
PERT(Program Evaluation and Review Technique) is a method to analyze the involved
tasks in completing a given project, especially the time needed to complete each task, and
identifying the minimum time needed to complete the total project.
PERT is based on the assumption that an activity’s duration follows a probability distribution
instead of being a single value
Three time estimates are required to compute the parameters of an activity’s duration
distribution:
1. Pessimistic time (tp ) - the time the activity would take if things did not go well
2. Most likely time (tm ) - the consensus best estimate of the activity’s duration
3. Optimistic time (to ) - the time the activity would take if things did go well.
Mean (expected time) =
Variance ( 2
) =
(t p 4tm
6
to )
Probability computation: Determine probability that project is completed within specified
time Z
X
Where = project mean time
= project standard mean time
x = (proposed) specified time
Float:
Float of an activity represents the excess of available time over its duration.
Total Float (Ft)
The amount of time by which the completion of an activity could be delay beyond the
earliest expected completion time without affecting the overall project duration.
i.e. Tf= (Latest start-Earliest start) for activity(i-j), or,(Tf)ij=(LS)jj-(ES)ij
Free Float (Ff)
The time by which the completion of an activity can be delayed beyond the earliest finish
time without affecting the earliest start of a subsequent (succeeding) activities.
Situations in network diagram
1. A must finish before either B or C can start
3
2. Both A and B must finish before C can start
3. Both A and C must finish before either of B or D can start
4. A must finish before B can start both A and C must finish before D can start
Benefits of CPM/PERT
1) Useful at many stages of project management
2) Mathematically simple
3) Give critical path and slack time
4) Provide project documentation
5) Useful in monitoring costs
Distinguish Between PERT and CPM? 4
PERT
(Programme Evaluation Review
Technique)
CPM
(Critical Path Method)
1. PERT is event oriented.
2. PERT is probabilistic.
3. PERT is primarily concerned with time
only.
4. PERT is generally used for projects
where time required to complete the
activities is not known a priori. Thus
PERT is used for large, R&D type of
projects.
5. Three time estimates are possible for
activities linking up two events.
1. CPM is activity oriented.
2. CPM is deterministic.
3. CPM places dual emphasis on project
time as well cost.
4. CPM is used for projects which are
repetitive in nature and comparatively
small in size.
5.One time estimate is possible for activities
(No allowance is made for uncertainty)
Example: 02. The following table gives the activities of a construction project and other
relevant information.
Activities
(i-j)
Normal duration
(days)
Crash duration
(days)
Crashing cost
(Rs. per day)
1-2
1-3
1-4
2-4
3-5
4-5
9
8
15
5
10
2
6
5
10
3
6
1
20
25
30
10
15
40
A. What is the normal project length and minimum project length?
B. Determine the minimum crashing costs of schedule ranging from length down to and
the minimum length schedule.
C. What is the optimal length schedule duration of each job for your solution?
Given that over head cost total Rs. 60 per day.
5E2=9,6
Solution: L2=13,8
E1=0,0
L1=0,0
1
9-6
8-5
2
15-10
10-6
5-3
4
E2=18,11
L2=18,11
E2=20,12
L2=20,12
5
3
E2=8,5
L2=8,5
A. The Critical path is 1 3 4 5 with normal duration 20 days and minimum project
length is 12 days.
Normal Project
length(days)
Crashing Cost (day/Rs.) Overhead cost @
Rs. 60/day
Total Cost(Rs.)
20
19
18
17
16
15
14
------
1 15=15
15+1 15=30
30+1 13=45
45+1 40=85
85+1 40+1 30=145
145+1 30+1 10+1 25=195
20 60=1200
19 60=1140
18 60=1080
17 60=1020
16 60=960
15 60=900
14 60=840
1200
1155
1110
1065
1045
1030
1035
B. Total cost increasing for 14 days duration, the minimum total cost Rs. 1030 occurs 15
days duration.
C. Optimum duration of each job is as follows:
D.
Job: (1,2) (1,3) (1,4) (2,4) (3,4) (4,5)
Optimum duration days: 9 8 14 4 6 1
Example-3: The time estimates (in hours) for the activities of a PERT network are given
below:
Activity t0 tm tp
1-2 1 1 7
1-3 1 4 7
1-4 2 2 8
2-5 1 1 1
6
2
3
5
3-5 2 5 14
4-6 2 5 8
5-6 3 6 15
Where t0 is the optimistic time tp is the pessimistic time and tm is most likely time
(a) Draw the project network
(b) Identify all paths through it and write critical path.
(c) Determine the expected project length
(d) Calculate standard deviation and variance of the project length
(e) What is the percentage of confidence that the project will complete
I. at least 4 weeks earlier then expected time
II. not more than 4 weeks than the expected time
(f) What should be the scheduled complication times for the probability of complication
are 90% confidence and 100% confidence?
Given data P(Z 1.33) 0.9082,P(Z 1.28) 0.9,P(Z 5) 0.99999.
Solution: i) The Network is given by the following diagram
The expected time and variance of each activity is shown below
Activity t0 tm t p
t
t0 tmt p
e
6
t t
2
2 p 0
6
1-2 1 1 7 2 1
1-3 1 4 7 4 1
1-4 2 2 8 3 1
2-5 1 1 1 1 0
3-5 2 5 14 6 4
4-6 2 5 8 5 1
5-6 3 6 15 7 4
b) Determination of project paths
7
Length of the path 1→ 2→5→6 = 2+1+7=10
Length of the path 1→ 3→5→6 = 4+6+7=17
Length of the path 1→ 4→6 = 5+3= 8
Since 1→ 3→5→6 has largest duration. Therefore the critical path is1→ 3→5→6.
c) The expected project length duration is = 17 weeks
d) Standard deviation of project length (σ2
)=sum of the standard deviations of the activities on
the critical paths=1+4+4 =9
e) I) the probability of completing the project with in 4 weeks earlier than expected is given by
P(Z D), where D
D
13 17
3
1.33 . Given that P(Z 1.33) 0.9082 . Therefore
P(Z 1.33) 0.5
0.5
(1.33)
0.4082
0.0918 9.18%
ii) The probability of completing the project not more than 4 weeks than the expected time
is given by P(Z D), where D
D
21 17
3
1.33 . Given that P(Z 1.33) 0.9082 . Therefore
P(Z 1.33) 0.5
0.5
(1.33)
0.4082
0.9082
f) Value of Z for p=90% i.e.
90.82%
TS 17
3
1.28 , Therefore TS=1.28×3+17=20.84 weeks
Cpm module iii reference

Cpm module iii reference

  • 1.
    Network PERT CPM Introduction 1 Networkis a technique used for planning and scheduling of large projects in the fields of construction, maintenance, fabrication, purchasing, computer system instantiation, research and development planning etc. There is multitude of operations research situations that can be modeled and solved as network. Some recent surveys reports that as much as 70% of the real-world mathematical programming problems can be represented by network related models. Network analysis is known by many names _PERT (Programme Evaluation and Review Technique), CPM (Critical Path Method), PEP (Programme Evaluation Procedure), LCES (Least Cost Estimating and Scheduling), SCANS (Scheduling and Control by Automated Network System), etc This chapter will present three of algorithms. 1. PERT & CPM 2. Shortest- route algorithms 3. Maximum-flow algorithms The Basic Terminology Network It is a graphical representation of logical and sequentially connected activities and events of a project. Network is also called arrow diagram. PERT (Programme Evolution Review Technique) and (Critical Path Method) are the two most widely applied techniques. Project A project is defined as a combination of interrelated activities which must be executed in a certain order in for its completion. Project Management Process Network analysis is the general name given to certain specific techniques which can be used for the planning, management and control of projects Activity Any individual operation, which utilizes resources and has an end and a beginning, is called activity. A task or a certain amount of work required in the project Requires time to complete Represented by an arrow These are usually classified into four categories: Predecessor activity Successor activity
  • 2.
    Concurrent activity Dummy activity2 Dummy Activity It Indicates only precedence relationships and does not require any time of effort PERT(Program Evaluation and Review Technique) is a method to analyze the involved tasks in completing a given project, especially the time needed to complete each task, and identifying the minimum time needed to complete the total project. PERT is based on the assumption that an activity’s duration follows a probability distribution instead of being a single value Three time estimates are required to compute the parameters of an activity’s duration distribution: 1. Pessimistic time (tp ) - the time the activity would take if things did not go well 2. Most likely time (tm ) - the consensus best estimate of the activity’s duration 3. Optimistic time (to ) - the time the activity would take if things did go well. Mean (expected time) = Variance ( 2 ) = (t p 4tm 6 to ) Probability computation: Determine probability that project is completed within specified time Z X Where = project mean time = project standard mean time x = (proposed) specified time Float: Float of an activity represents the excess of available time over its duration. Total Float (Ft) The amount of time by which the completion of an activity could be delay beyond the earliest expected completion time without affecting the overall project duration. i.e. Tf= (Latest start-Earliest start) for activity(i-j), or,(Tf)ij=(LS)jj-(ES)ij Free Float (Ff) The time by which the completion of an activity can be delayed beyond the earliest finish time without affecting the earliest start of a subsequent (succeeding) activities. Situations in network diagram 1. A must finish before either B or C can start
  • 3.
    3 2. Both Aand B must finish before C can start 3. Both A and C must finish before either of B or D can start 4. A must finish before B can start both A and C must finish before D can start Benefits of CPM/PERT 1) Useful at many stages of project management 2) Mathematically simple 3) Give critical path and slack time 4) Provide project documentation 5) Useful in monitoring costs
  • 4.
    Distinguish Between PERTand CPM? 4 PERT (Programme Evaluation Review Technique) CPM (Critical Path Method) 1. PERT is event oriented. 2. PERT is probabilistic. 3. PERT is primarily concerned with time only. 4. PERT is generally used for projects where time required to complete the activities is not known a priori. Thus PERT is used for large, R&D type of projects. 5. Three time estimates are possible for activities linking up two events. 1. CPM is activity oriented. 2. CPM is deterministic. 3. CPM places dual emphasis on project time as well cost. 4. CPM is used for projects which are repetitive in nature and comparatively small in size. 5.One time estimate is possible for activities (No allowance is made for uncertainty) Example: 02. The following table gives the activities of a construction project and other relevant information. Activities (i-j) Normal duration (days) Crash duration (days) Crashing cost (Rs. per day) 1-2 1-3 1-4 2-4 3-5 4-5 9 8 15 5 10 2 6 5 10 3 6 1 20 25 30 10 15 40 A. What is the normal project length and minimum project length? B. Determine the minimum crashing costs of schedule ranging from length down to and the minimum length schedule. C. What is the optimal length schedule duration of each job for your solution? Given that over head cost total Rs. 60 per day.
  • 5.
    5E2=9,6 Solution: L2=13,8 E1=0,0 L1=0,0 1 9-6 8-5 2 15-10 10-6 5-3 4 E2=18,11 L2=18,11 E2=20,12 L2=20,12 5 3 E2=8,5 L2=8,5 A. TheCritical path is 1 3 4 5 with normal duration 20 days and minimum project length is 12 days. Normal Project length(days) Crashing Cost (day/Rs.) Overhead cost @ Rs. 60/day Total Cost(Rs.) 20 19 18 17 16 15 14 ------ 1 15=15 15+1 15=30 30+1 13=45 45+1 40=85 85+1 40+1 30=145 145+1 30+1 10+1 25=195 20 60=1200 19 60=1140 18 60=1080 17 60=1020 16 60=960 15 60=900 14 60=840 1200 1155 1110 1065 1045 1030 1035 B. Total cost increasing for 14 days duration, the minimum total cost Rs. 1030 occurs 15 days duration. C. Optimum duration of each job is as follows: D. Job: (1,2) (1,3) (1,4) (2,4) (3,4) (4,5) Optimum duration days: 9 8 14 4 6 1 Example-3: The time estimates (in hours) for the activities of a PERT network are given below: Activity t0 tm tp 1-2 1 1 7 1-3 1 4 7 1-4 2 2 8 2-5 1 1 1
  • 6.
    6 2 3 5 3-5 2 514 4-6 2 5 8 5-6 3 6 15 Where t0 is the optimistic time tp is the pessimistic time and tm is most likely time (a) Draw the project network (b) Identify all paths through it and write critical path. (c) Determine the expected project length (d) Calculate standard deviation and variance of the project length (e) What is the percentage of confidence that the project will complete I. at least 4 weeks earlier then expected time II. not more than 4 weeks than the expected time (f) What should be the scheduled complication times for the probability of complication are 90% confidence and 100% confidence? Given data P(Z 1.33) 0.9082,P(Z 1.28) 0.9,P(Z 5) 0.99999. Solution: i) The Network is given by the following diagram The expected time and variance of each activity is shown below Activity t0 tm t p t t0 tmt p e 6 t t 2 2 p 0 6 1-2 1 1 7 2 1 1-3 1 4 7 4 1 1-4 2 2 8 3 1 2-5 1 1 1 1 0 3-5 2 5 14 6 4 4-6 2 5 8 5 1 5-6 3 6 15 7 4
  • 7.
    b) Determination ofproject paths 7 Length of the path 1→ 2→5→6 = 2+1+7=10 Length of the path 1→ 3→5→6 = 4+6+7=17 Length of the path 1→ 4→6 = 5+3= 8 Since 1→ 3→5→6 has largest duration. Therefore the critical path is1→ 3→5→6. c) The expected project length duration is = 17 weeks d) Standard deviation of project length (σ2 )=sum of the standard deviations of the activities on the critical paths=1+4+4 =9 e) I) the probability of completing the project with in 4 weeks earlier than expected is given by P(Z D), where D D 13 17 3 1.33 . Given that P(Z 1.33) 0.9082 . Therefore P(Z 1.33) 0.5 0.5 (1.33) 0.4082 0.0918 9.18% ii) The probability of completing the project not more than 4 weeks than the expected time is given by P(Z D), where D D 21 17 3 1.33 . Given that P(Z 1.33) 0.9082 . Therefore P(Z 1.33) 0.5 0.5 (1.33) 0.4082 0.9082 f) Value of Z for p=90% i.e. 90.82% TS 17 3 1.28 , Therefore TS=1.28×3+17=20.84 weeks