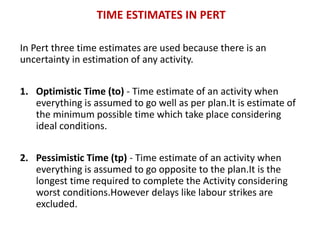
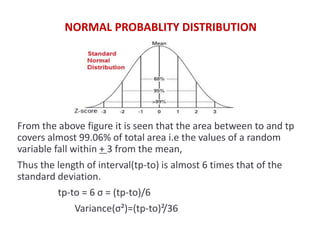
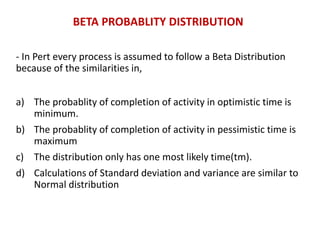
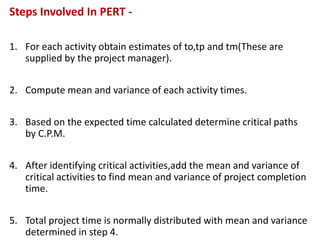
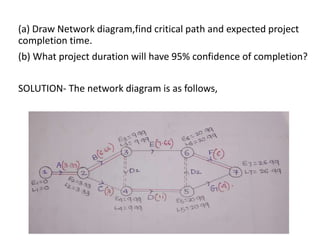
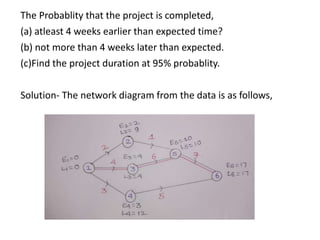
PERT(Programme Evaluation And Review Technique)
Name-Rahul Vinod Wasekar
Class-BE Civil
Roll no-BE17F01F055
Subject-Construction Management
Guided by - Prof.Dr.UJ Kahalekar
PERT is......
• Programme evaluation and Review technique.
• developed by US Navy for the Polaris Nuclear Submarine
project.
• based on probablistic approach
• useful to handle activities which are having uncertainty in its
completion.
• Activities like research development type of project are based
on this approach.
TIME ESTIMATES IN PERT
In Pert three time estimates are used because there is an
uncertainty in estimation of any activity.
1. Optimistic Time (to) - Time estimate of an activity when
everything is assumed to go well as per plan.It is estimate of
the minimum possible time which take place considering
ideal conditions.
2. Pessimistic Time (tp) - Time estimate of an activity when
everything is assumed to go opposite to the plan.It is the
longest time required to complete the Activity considering
worst conditions.However delays like labour strikes are
excluded.
3. Most likely time (tm)- The time which the activity will take most
frequently if it is performed a number of times.
The Above cases are combined statistically to give expected time for
activity.
FREQUENCY DISTRIBUTION
• The process of time estimation is analyzed by a curve called as a
frequency distribution curve.
• When frequency distribution curve is symmetric it is called normal
frequency distribution otherwise it is skewed which can be left or
right.
Some characteristics of Frequency distribution are-
Mean (tm) = Σti/n
Variance(σ)²=Σ(ti-tm)²/n
Standard Deviation(σ)=(Variance)½
NORMAL PROBABLITY DISTRIBUTION
From the above figure it is seen that the area between to and tp
covers almost 99.06% of total area i.e the values of a random
variable fall within + 3 from the mean,
Thus the length of interval(tp-to) is almost 6 times that of the
standard deviation.
tp-to = 6 σ = (tp-to)/6
Variance(σ²)=(tp-to)²/36
BETA PROBABLITY DISTRIBUTION
- In Pert every process is assumed to follow a Beta Distribution
because of the similarities in,
a) The probablity of completion of activity in optimistic time is
minimum.
b) The probablity of completion of activity in pessimistic time is
maximum
c) The distribution only has one most likely time(tm).
d) Calculations of Standard deviation and variance are similar to
Normal distribution
Expected Time of an Activity
• Average time taken for the completion of the activity is called
as expected time(te).
• For the calculation of expected time all the three time
estimates( to,tm,tp) are combined and their weighted mean is
taken as follows,
te=(to+4tm+tp)/6
here the weightage of 1 is given for to and tp while
weightage of 4 given to tm.
Steps Involved In PERT -
1. For each activity obtain estimates of to,tp and tm(These are
supplied by the project manager).
2. Compute mean and variance of each activity times.
3. Based on the expected time calculated determine critical paths
by C.P.M.
4. After identifying critical activities,add the mean and variance of
critical activities to find mean and variance of project completion
time.
5. Total project time is normally distributed with mean and variance
determined in step 4.
CRITICAL PATH IN PERT NETWORK
• The path starting from an initial event and connects the events
which has zero float and terminate at the final event is called
as critical path.
• It is denoted by a double line.
• The path having the largest value of Variance is the most
critical path.
CENTRAL LIMIT THEOREM
- Central limit theorem states that for a given distribution with a
mean μ and variance σ², the sampling distribution of the mean
approaches a normal distribution with a mean (μ) and a variance
σ².
-Along the critical path,
expected time(te) -- t= t1+t2+t3...+tn
variance(σ)²--(σ1² +σ2²+.....+σn²)
FLOAT
• It is the difference between Ei and Li (Earliest occurence time-
Latest occurence time)
(Ej=Ei+te) and (Li=Lj-te)...where i and j are the immediate
predecessor and successive events
• Associated with an event
• It is the excess time available by which the occurence of
event can be delayed without affecting the project
completion time.
The Probablity of completion of Project is given by the formula-
Z = (Ts-Te)/σc
where,
Ts-Schedule time for completion of project
Te-Expected time computed by the weighted mean
σc- Standard deviation calculated along critical path
Z=Normal deviate/probablity factor
It is observed that the value of Z can be positive,negative or zero,
• When Z is positive, it means Ts is at right of Te and the
probablity of competion is more than 50%.
• When Z is negative,Ts is at left of Te and the probablity of
completion is less than 50%.
• When Z is Zero,Ts coincides with Te and the probablity of
completion is 50%.
The Value Of Z (Normal deviate) is calculated from the table given
below
Problems-
Q.1-A small Project Consists of Seven Activities as follows,
(a) Draw Network diagram,find critical path and expected project
completion time.
(b) What project duration will have 95% confidence of completion?
SOLUTION- The network diagram is as follows,
Where,
te=(to+4tm+tp)/6 and σ²=(tp-to)²/36
Ei= earliest occurence time and Li=latest occurence time,
Q.2-A project consists of activities given in the table as,
ACTIVITY to tm tp te σ²
1-2 1 1 7 2 1
1-3 1 4 7 4 1
1-4 2 2 8 3 1
2-5 1 1 1 1 0
3-5 2 5 14 6 4
4-6 2 5 8 5 1
5-6 3 6 15 7 4
The Probablity that the project is completed,
(a) atleast 4 weeks earlier than expected time?
(b) not more than 4 weeks later than expected.
(c)Find the project duration at 95% probablity.
Solution- The network diagram from the data is as follows,
The Critical Path is 1-3-5-6,
Expected time(Te) =Σ(te) along critical path,
Hence expected time= 4+6+7=17 weeks,
(a) Project to be completed 4 weeks earlier,
∴ Ts=Te-4=17-4 =13 weeks.
σc²=1+4+4=9,
Z=(Ts-Te)/σc
Z=(13-17)/3 = -1.33
The value of Z from from Normal deviate table is 0.0918
Hence Probablity is 9.18%.
(b) Project to be completed 4 weeks later than expected,
∴ Ts=Te+4=21weeks.
σc²=1+4+4=9,
Z=(Ts-Te)/σc
Z=(13-17)/3 = 1.33
The value of Z from from Normal deviate table is 0.9082
Hence Probablity is 90.82%.
(c) Project duration at 95% Probablity is given by,
Z=(Ts-Te)/σc
Z=1.65 at 95% probablity,
∴ 1.65=(Ts-17)/3
∴Ts= 22 Weeks.
REFERENCES
• NPTEL
• Slideshare
• Youtube (https://youtu.be/WrAf6zdteXI)
THANK YOU!

PERT

  • 1.
    PERT(Programme Evaluation AndReview Technique) Name-Rahul Vinod Wasekar Class-BE Civil Roll no-BE17F01F055 Subject-Construction Management Guided by - Prof.Dr.UJ Kahalekar
  • 2.
    PERT is...... • Programmeevaluation and Review technique. • developed by US Navy for the Polaris Nuclear Submarine project. • based on probablistic approach • useful to handle activities which are having uncertainty in its completion. • Activities like research development type of project are based on this approach.
  • 3.
    TIME ESTIMATES INPERT In Pert three time estimates are used because there is an uncertainty in estimation of any activity. 1. Optimistic Time (to) - Time estimate of an activity when everything is assumed to go well as per plan.It is estimate of the minimum possible time which take place considering ideal conditions. 2. Pessimistic Time (tp) - Time estimate of an activity when everything is assumed to go opposite to the plan.It is the longest time required to complete the Activity considering worst conditions.However delays like labour strikes are excluded.
  • 4.
    3. Most likelytime (tm)- The time which the activity will take most frequently if it is performed a number of times. The Above cases are combined statistically to give expected time for activity.
  • 5.
    FREQUENCY DISTRIBUTION • Theprocess of time estimation is analyzed by a curve called as a frequency distribution curve. • When frequency distribution curve is symmetric it is called normal frequency distribution otherwise it is skewed which can be left or right.
  • 6.
    Some characteristics ofFrequency distribution are- Mean (tm) = Σti/n Variance(σ)²=Σ(ti-tm)²/n Standard Deviation(σ)=(Variance)½
  • 7.
    NORMAL PROBABLITY DISTRIBUTION Fromthe above figure it is seen that the area between to and tp covers almost 99.06% of total area i.e the values of a random variable fall within + 3 from the mean, Thus the length of interval(tp-to) is almost 6 times that of the standard deviation. tp-to = 6 σ = (tp-to)/6 Variance(σ²)=(tp-to)²/36
  • 8.
    BETA PROBABLITY DISTRIBUTION -In Pert every process is assumed to follow a Beta Distribution because of the similarities in, a) The probablity of completion of activity in optimistic time is minimum. b) The probablity of completion of activity in pessimistic time is maximum c) The distribution only has one most likely time(tm). d) Calculations of Standard deviation and variance are similar to Normal distribution
  • 9.
    Expected Time ofan Activity • Average time taken for the completion of the activity is called as expected time(te). • For the calculation of expected time all the three time estimates( to,tm,tp) are combined and their weighted mean is taken as follows, te=(to+4tm+tp)/6 here the weightage of 1 is given for to and tp while weightage of 4 given to tm.
  • 10.
    Steps Involved InPERT - 1. For each activity obtain estimates of to,tp and tm(These are supplied by the project manager). 2. Compute mean and variance of each activity times. 3. Based on the expected time calculated determine critical paths by C.P.M. 4. After identifying critical activities,add the mean and variance of critical activities to find mean and variance of project completion time. 5. Total project time is normally distributed with mean and variance determined in step 4.
  • 11.
    CRITICAL PATH INPERT NETWORK • The path starting from an initial event and connects the events which has zero float and terminate at the final event is called as critical path. • It is denoted by a double line. • The path having the largest value of Variance is the most critical path.
  • 12.
    CENTRAL LIMIT THEOREM -Central limit theorem states that for a given distribution with a mean μ and variance σ², the sampling distribution of the mean approaches a normal distribution with a mean (μ) and a variance σ². -Along the critical path, expected time(te) -- t= t1+t2+t3...+tn variance(σ)²--(σ1² +σ2²+.....+σn²)
  • 13.
    FLOAT • It isthe difference between Ei and Li (Earliest occurence time- Latest occurence time) (Ej=Ei+te) and (Li=Lj-te)...where i and j are the immediate predecessor and successive events • Associated with an event • It is the excess time available by which the occurence of event can be delayed without affecting the project completion time.
  • 15.
    The Probablity ofcompletion of Project is given by the formula- Z = (Ts-Te)/σc where, Ts-Schedule time for completion of project Te-Expected time computed by the weighted mean σc- Standard deviation calculated along critical path Z=Normal deviate/probablity factor It is observed that the value of Z can be positive,negative or zero,
  • 16.
    • When Zis positive, it means Ts is at right of Te and the probablity of competion is more than 50%. • When Z is negative,Ts is at left of Te and the probablity of completion is less than 50%. • When Z is Zero,Ts coincides with Te and the probablity of completion is 50%.
  • 17.
    The Value OfZ (Normal deviate) is calculated from the table given below
  • 18.
    Problems- Q.1-A small ProjectConsists of Seven Activities as follows,
  • 19.
    (a) Draw Networkdiagram,find critical path and expected project completion time. (b) What project duration will have 95% confidence of completion? SOLUTION- The network diagram is as follows,
  • 20.
    Where, te=(to+4tm+tp)/6 and σ²=(tp-to)²/36 Ei=earliest occurence time and Li=latest occurence time,
  • 21.
    Q.2-A project consistsof activities given in the table as, ACTIVITY to tm tp te σ² 1-2 1 1 7 2 1 1-3 1 4 7 4 1 1-4 2 2 8 3 1 2-5 1 1 1 1 0 3-5 2 5 14 6 4 4-6 2 5 8 5 1 5-6 3 6 15 7 4
  • 22.
    The Probablity thatthe project is completed, (a) atleast 4 weeks earlier than expected time? (b) not more than 4 weeks later than expected. (c)Find the project duration at 95% probablity. Solution- The network diagram from the data is as follows,
  • 23.
    The Critical Pathis 1-3-5-6, Expected time(Te) =Σ(te) along critical path, Hence expected time= 4+6+7=17 weeks, (a) Project to be completed 4 weeks earlier, ∴ Ts=Te-4=17-4 =13 weeks. σc²=1+4+4=9, Z=(Ts-Te)/σc Z=(13-17)/3 = -1.33 The value of Z from from Normal deviate table is 0.0918 Hence Probablity is 9.18%.
  • 24.
    (b) Project tobe completed 4 weeks later than expected, ∴ Ts=Te+4=21weeks. σc²=1+4+4=9, Z=(Ts-Te)/σc Z=(13-17)/3 = 1.33 The value of Z from from Normal deviate table is 0.9082 Hence Probablity is 90.82%.
  • 25.
    (c) Project durationat 95% Probablity is given by, Z=(Ts-Te)/σc Z=1.65 at 95% probablity, ∴ 1.65=(Ts-17)/3 ∴Ts= 22 Weeks.
  • 26.
    REFERENCES • NPTEL • Slideshare •Youtube (https://youtu.be/WrAf6zdteXI)
  • 27.