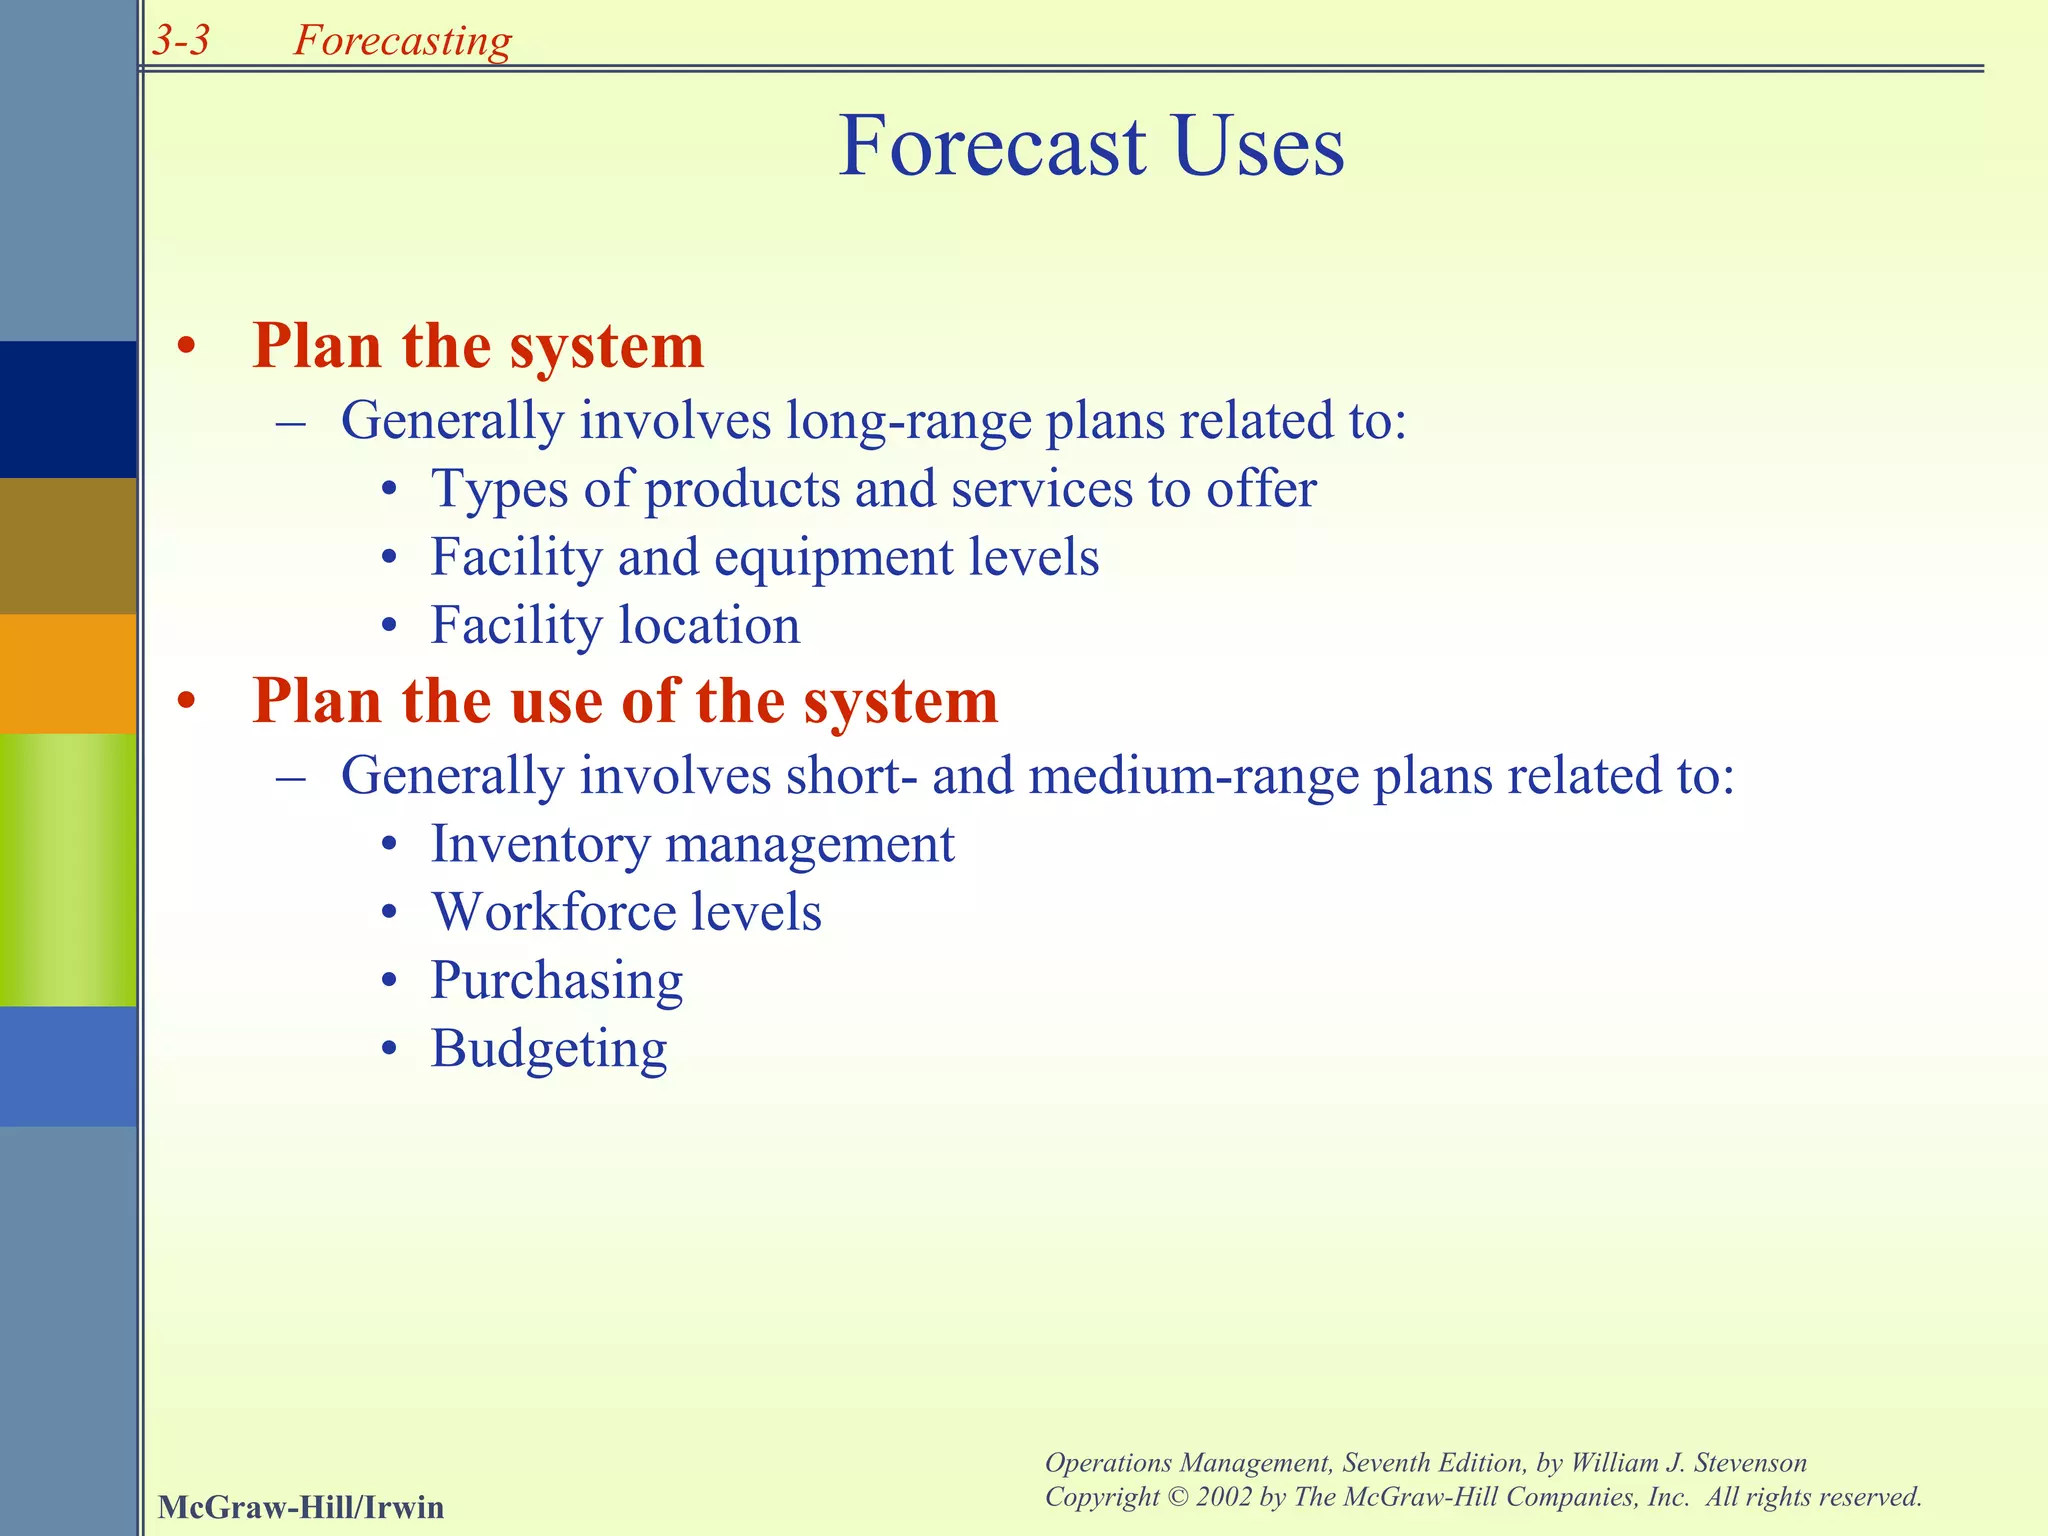
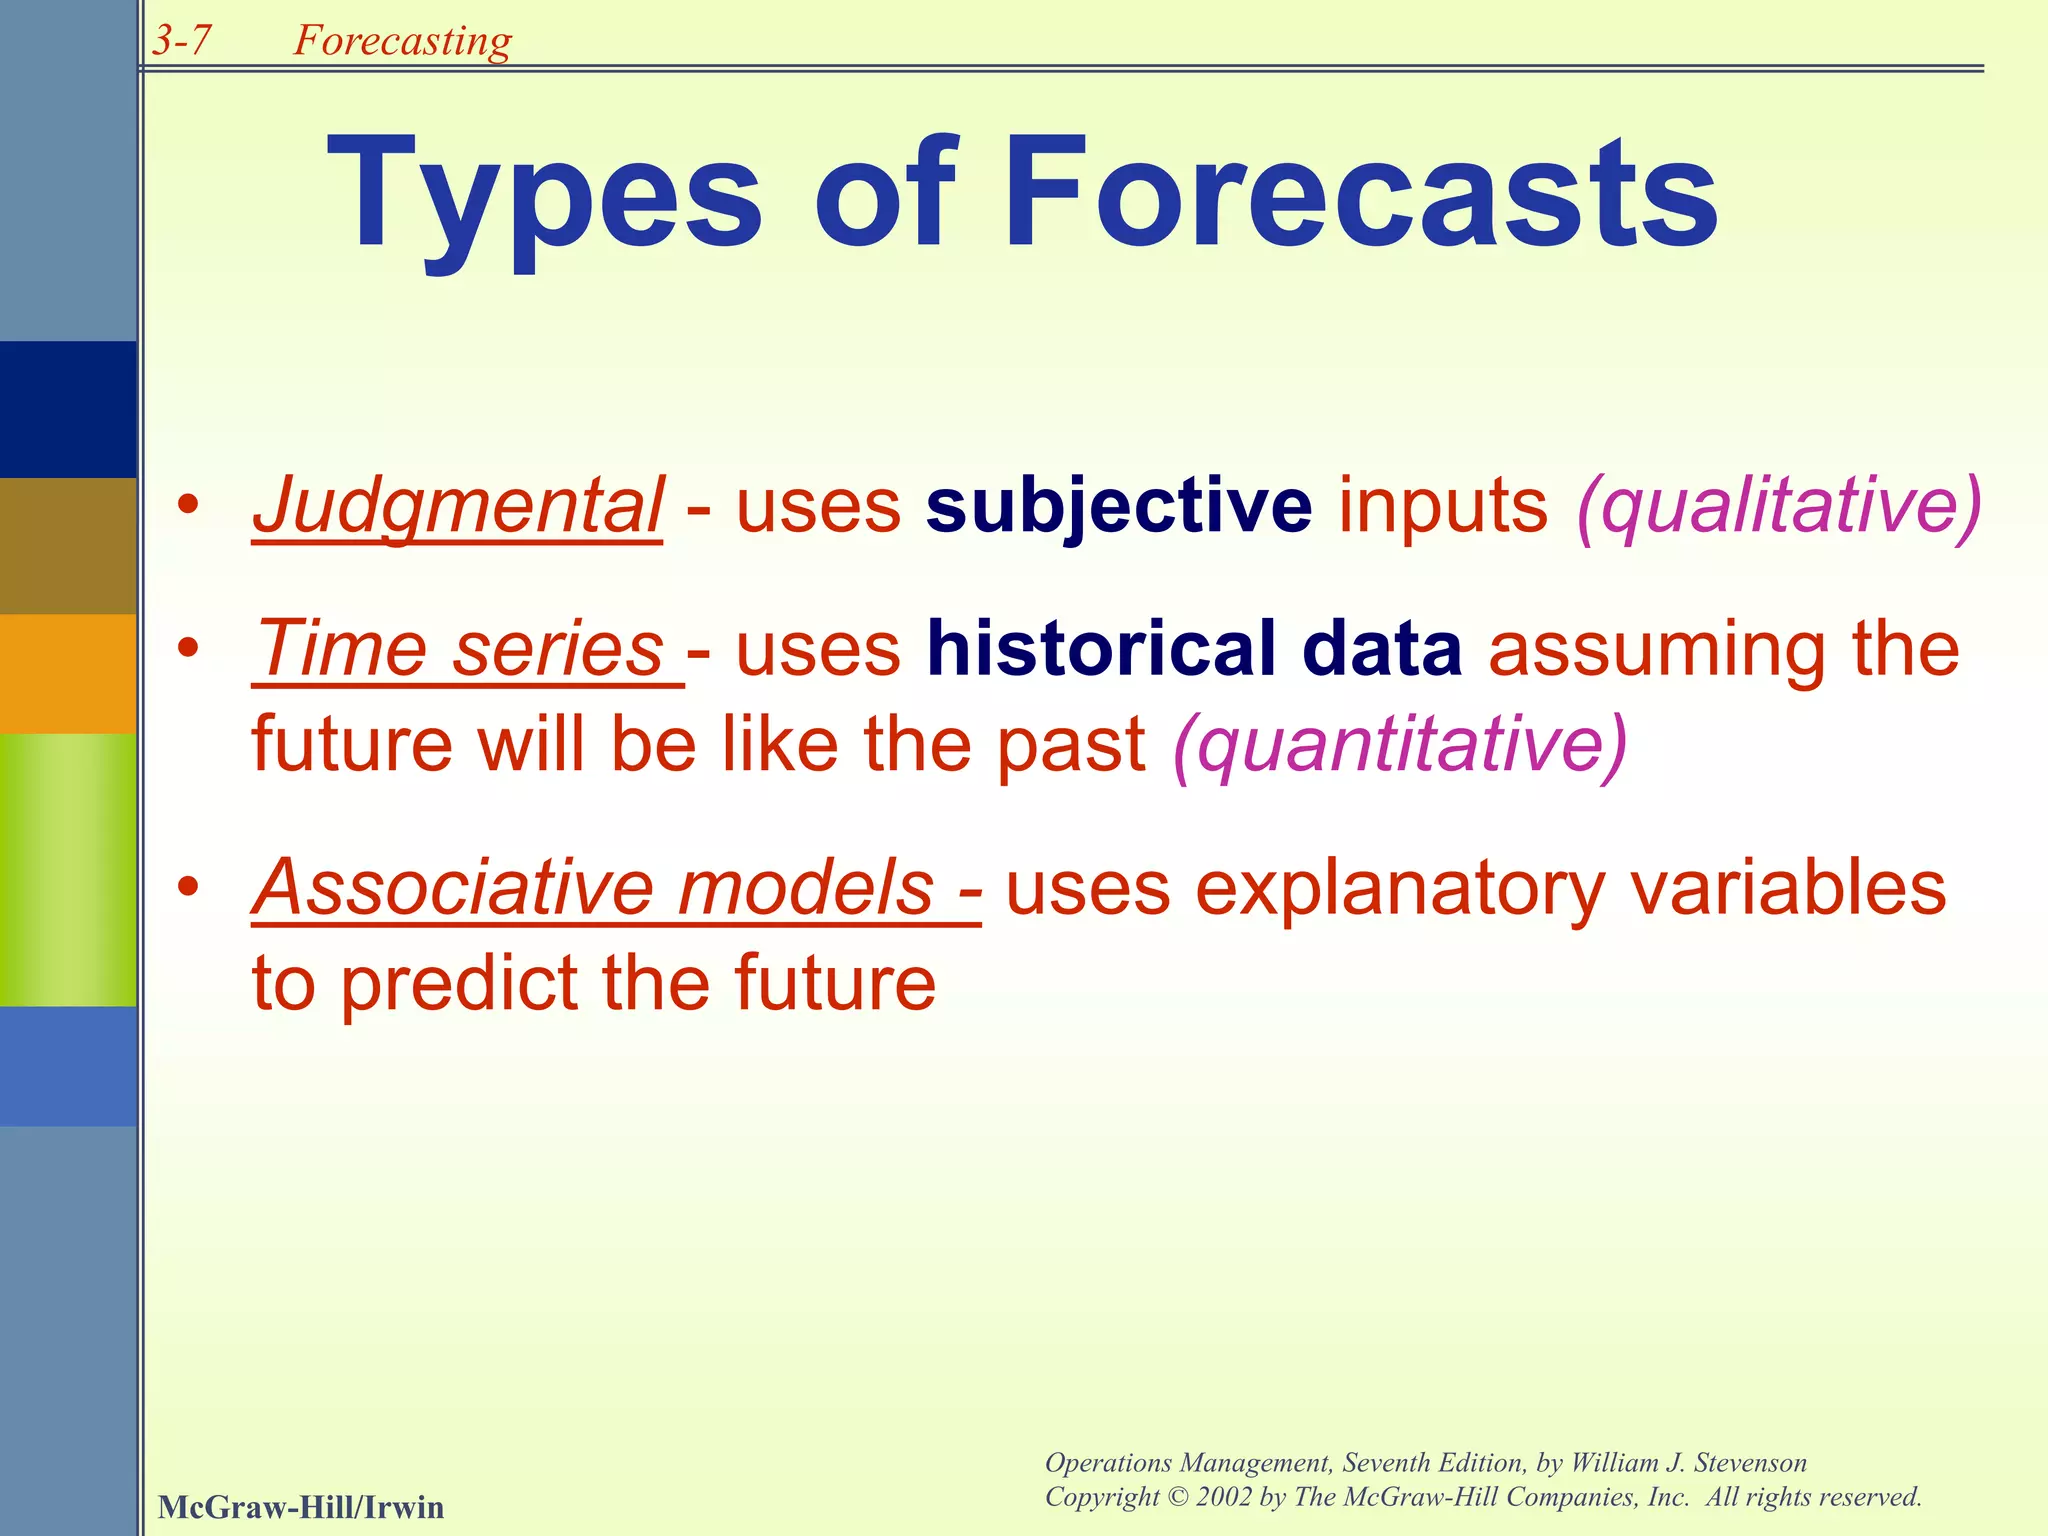
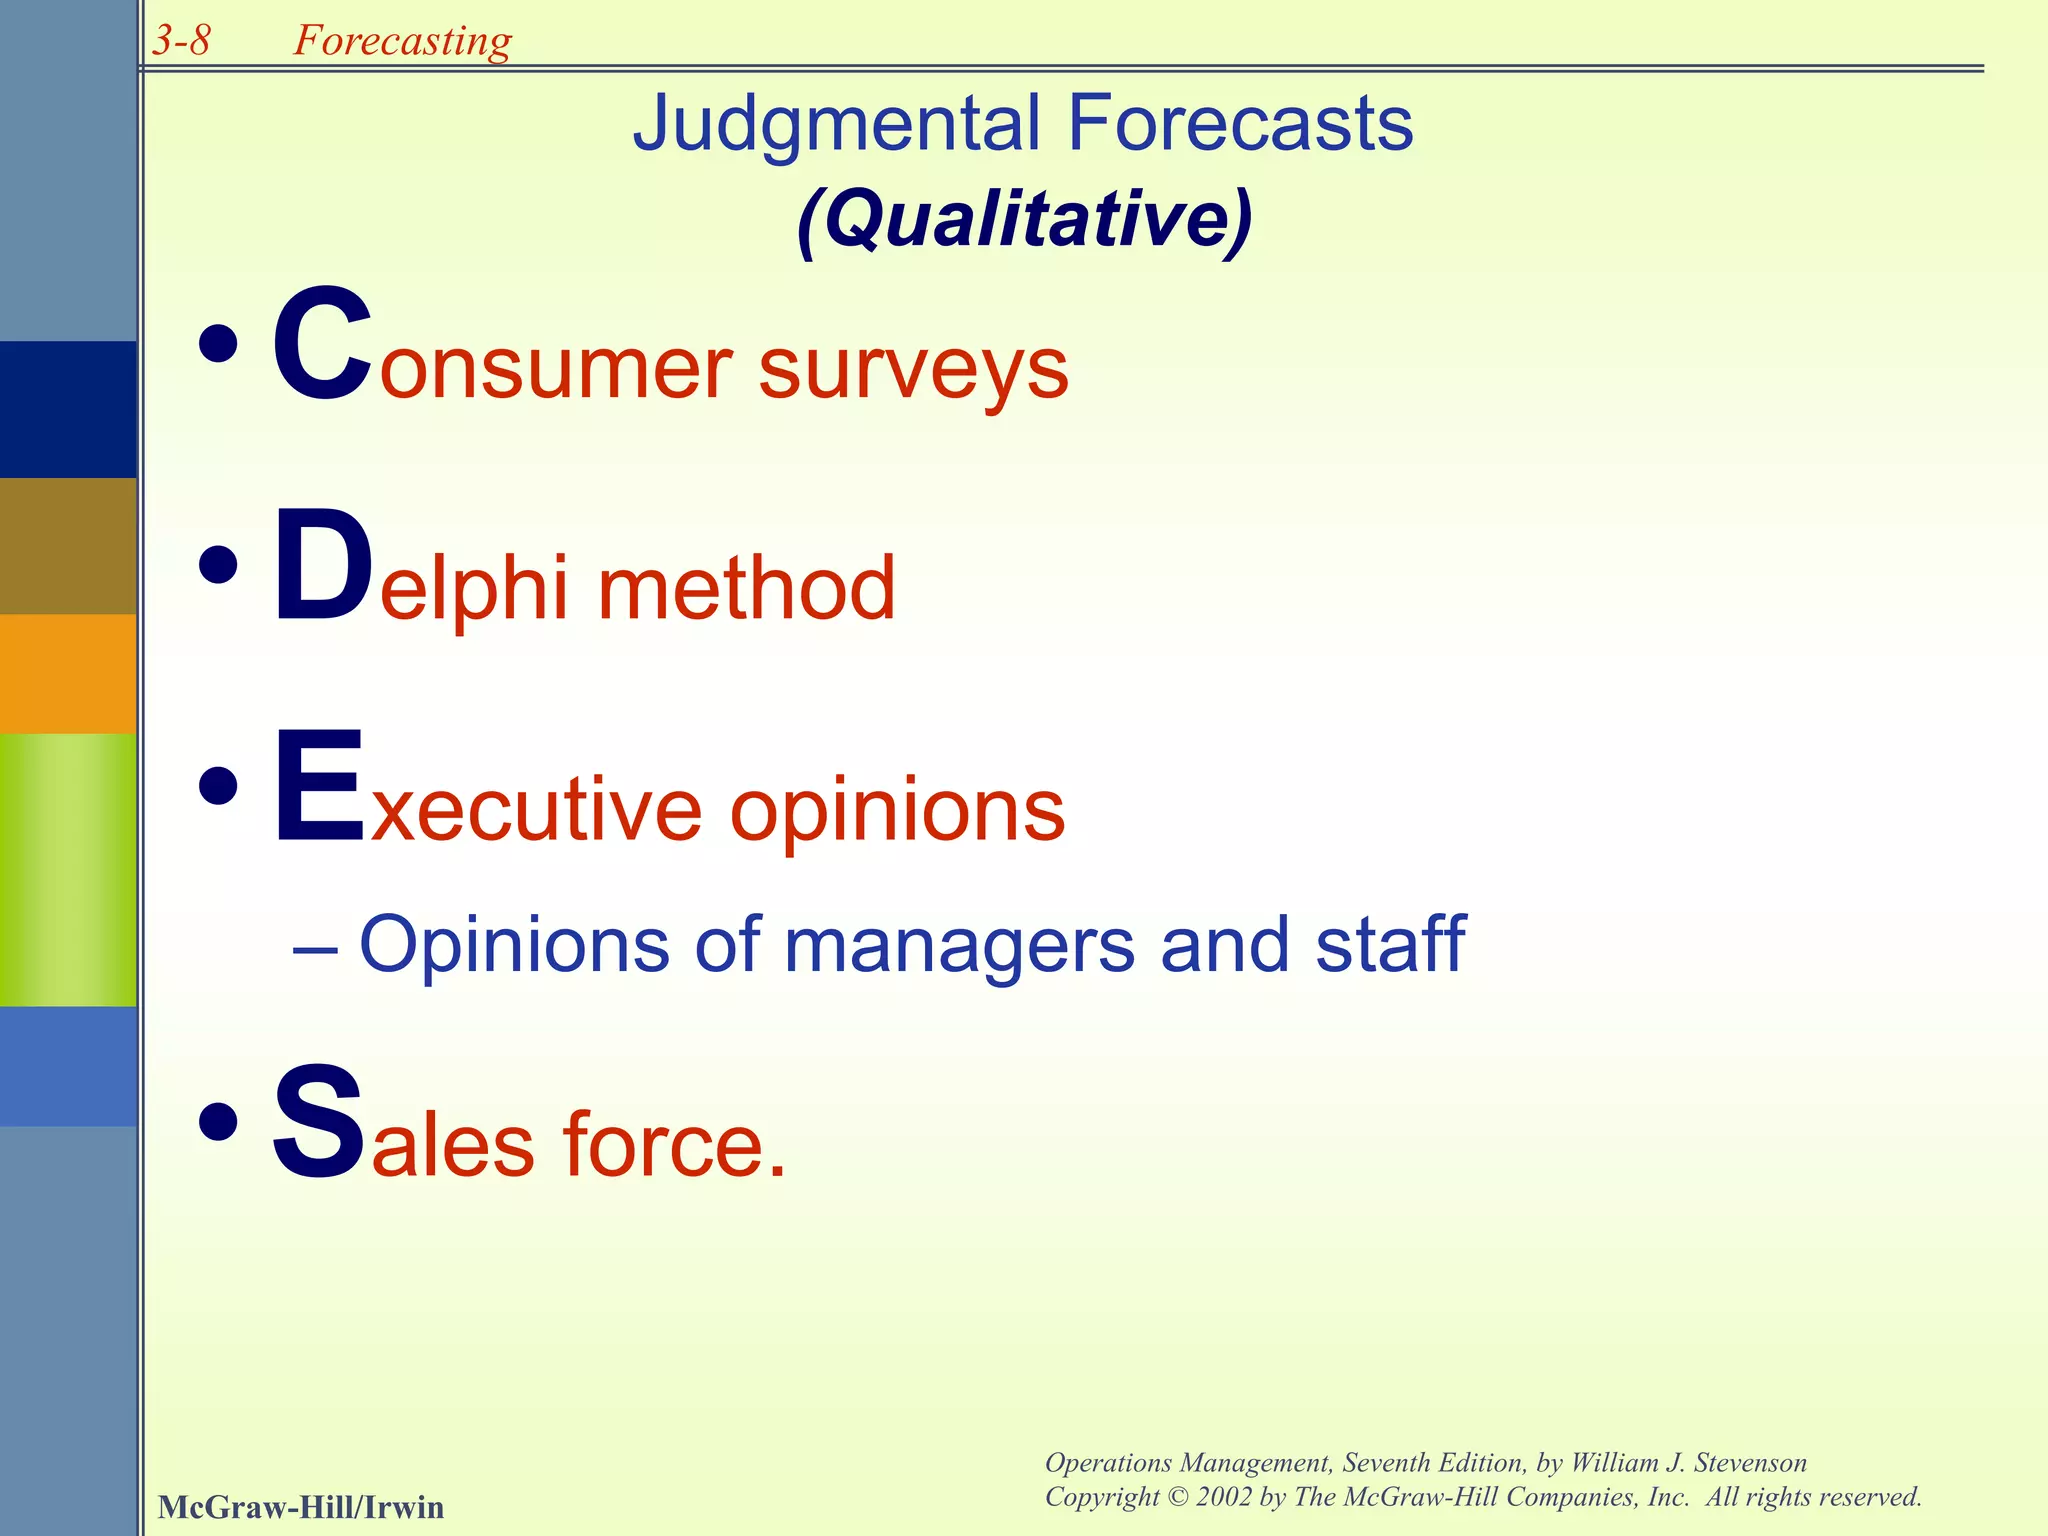
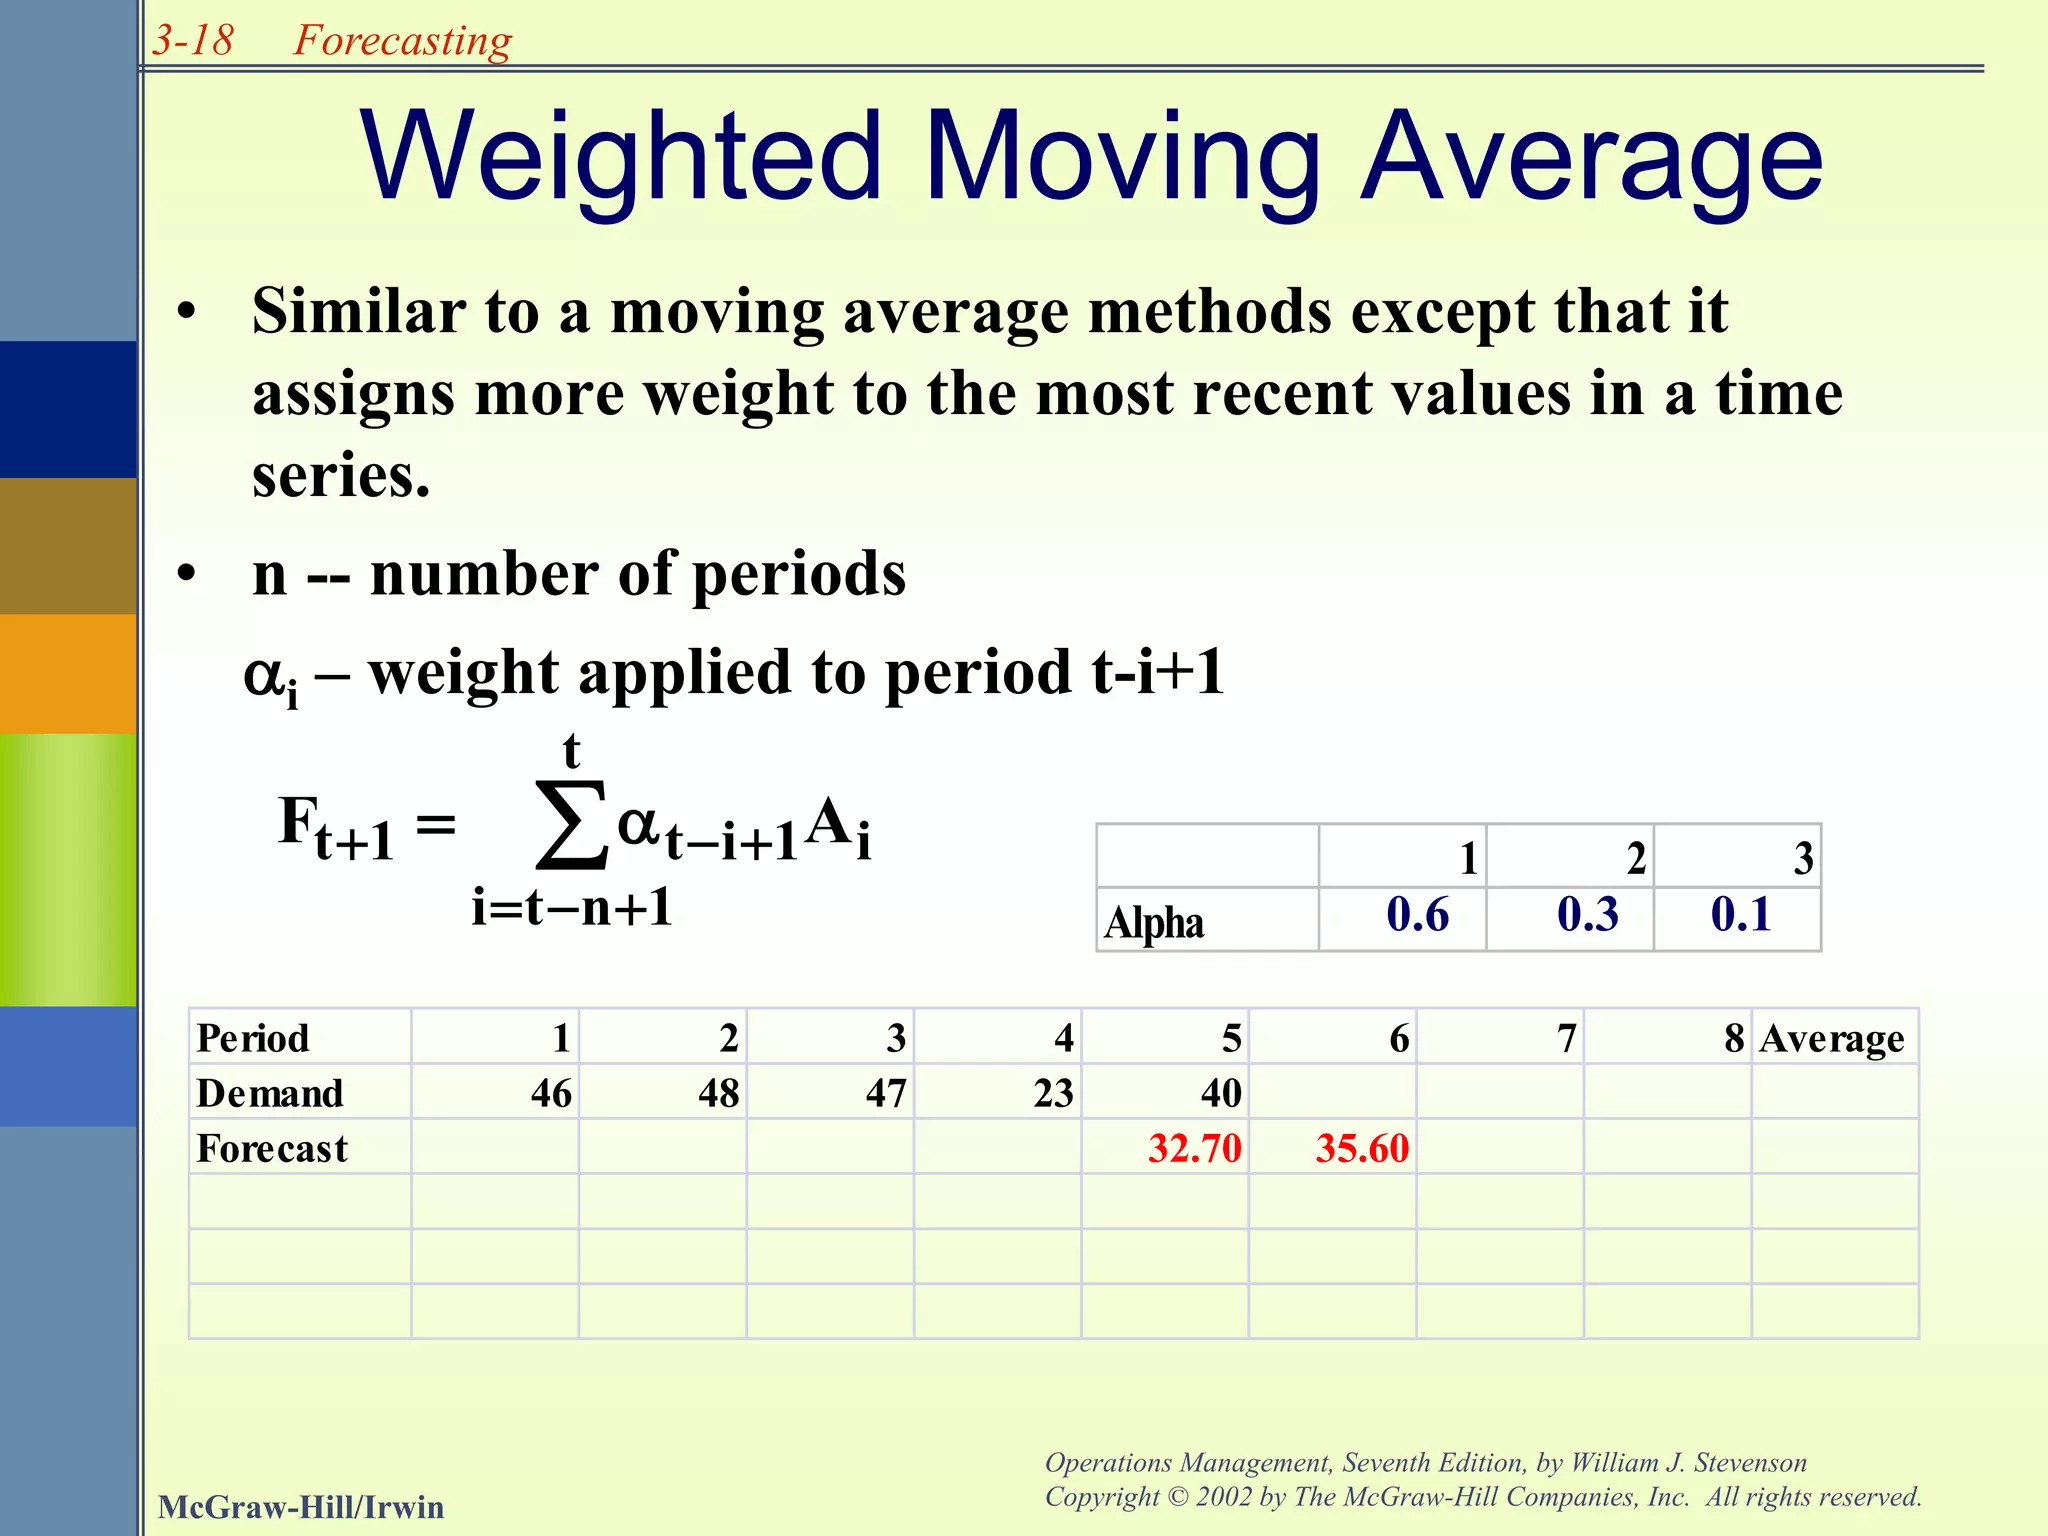
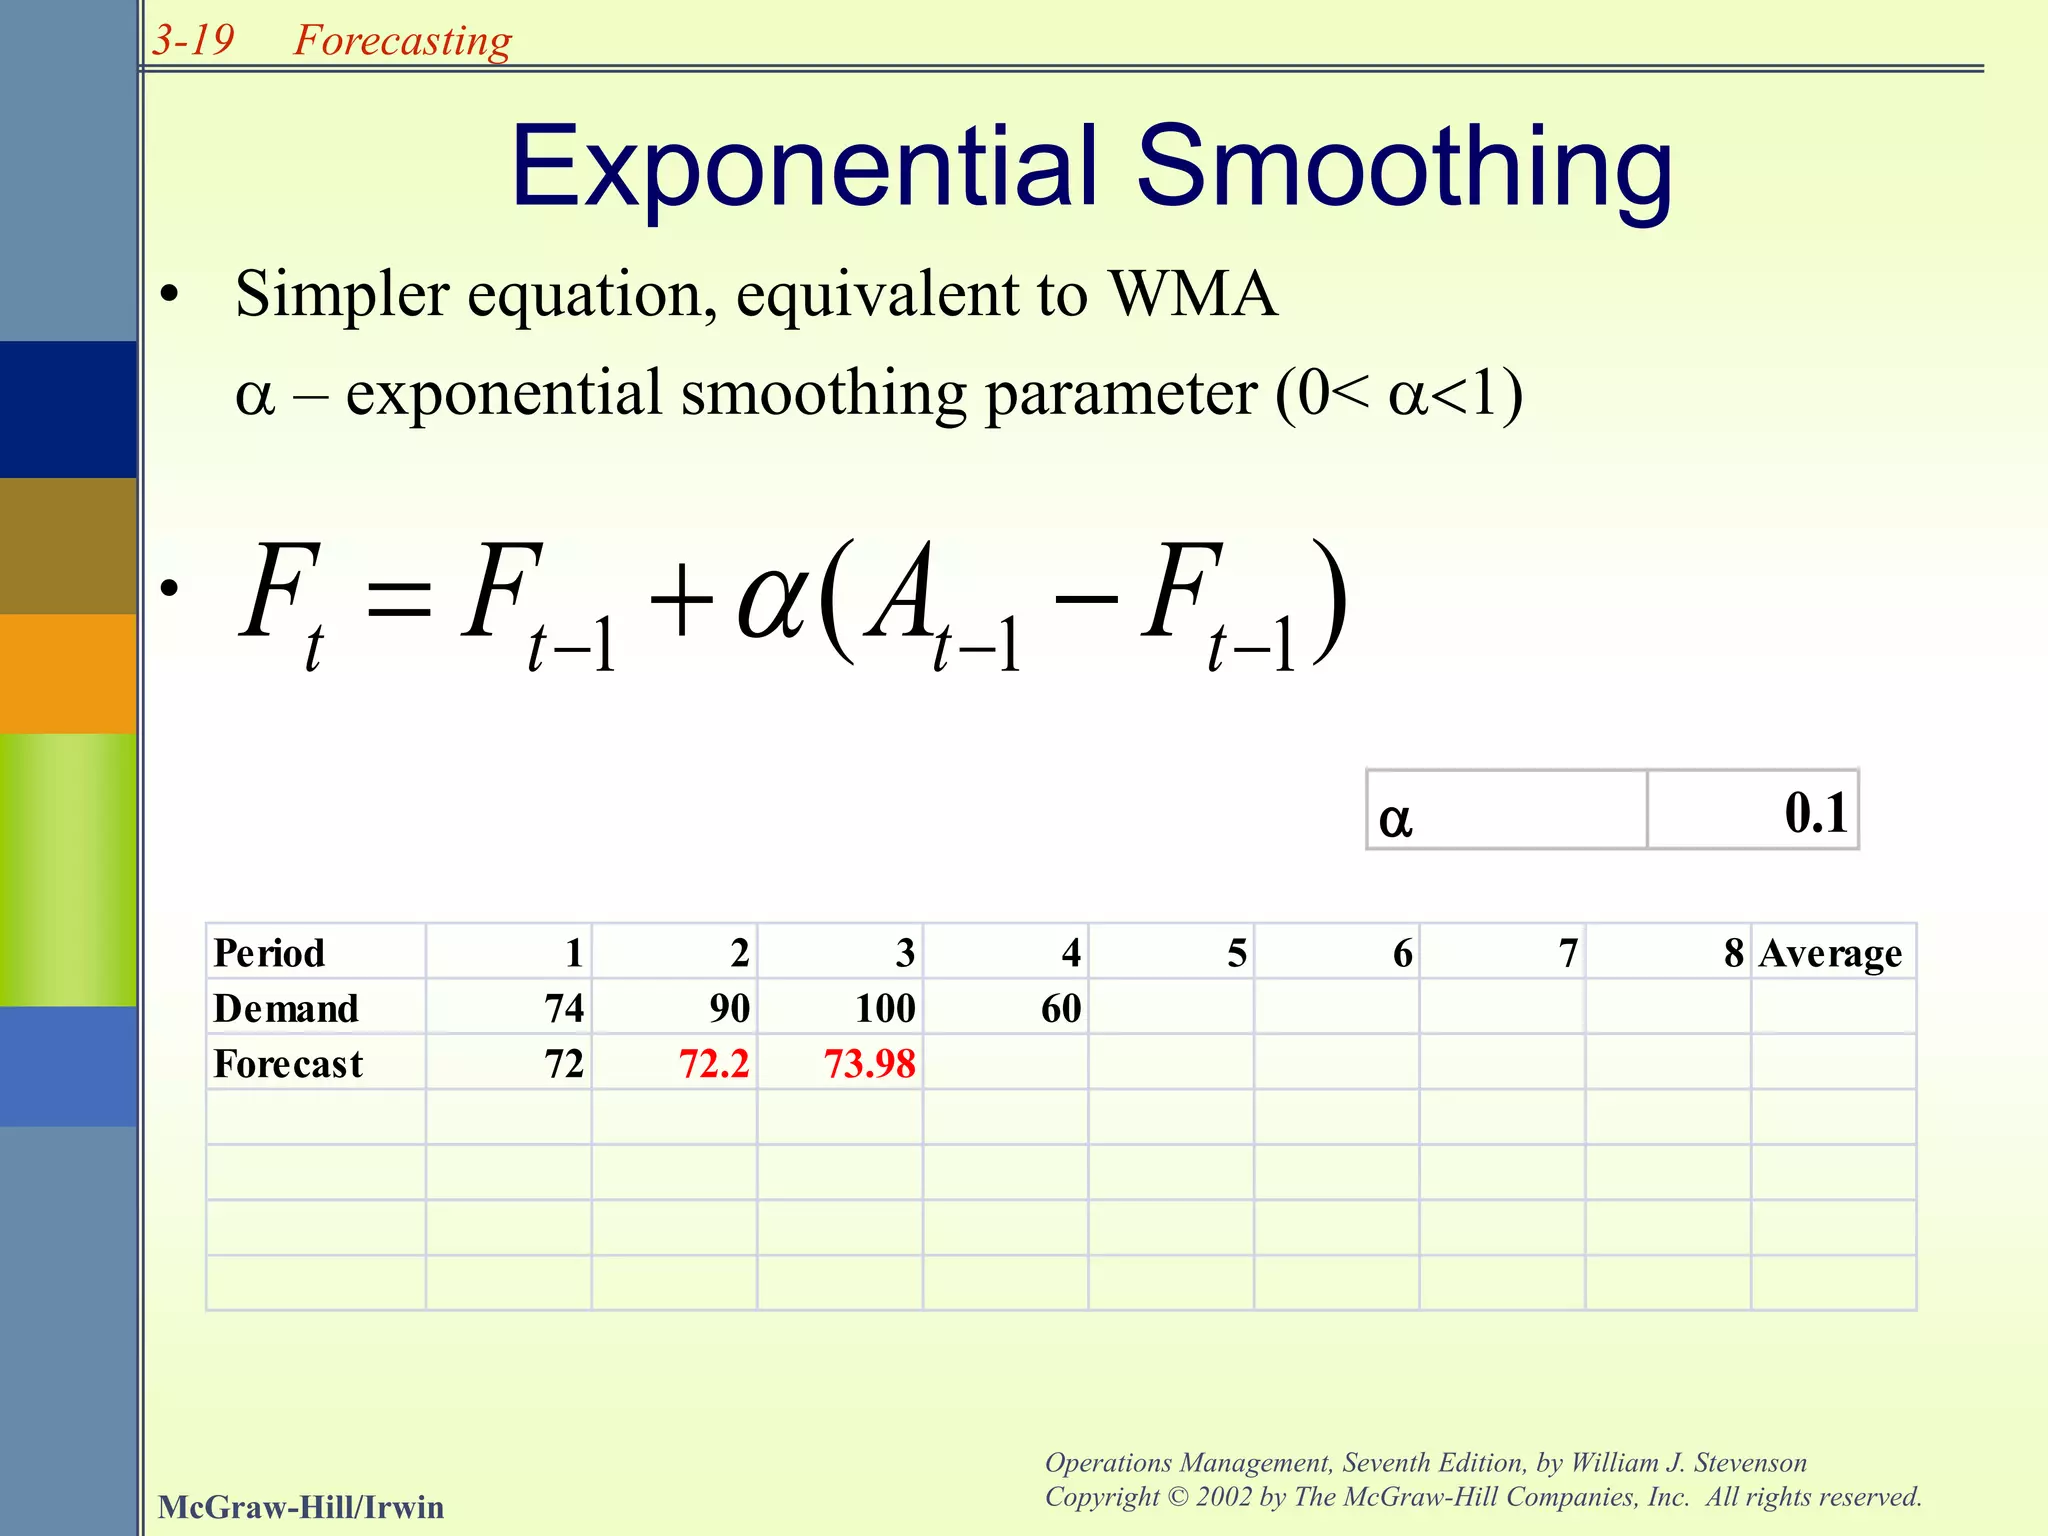
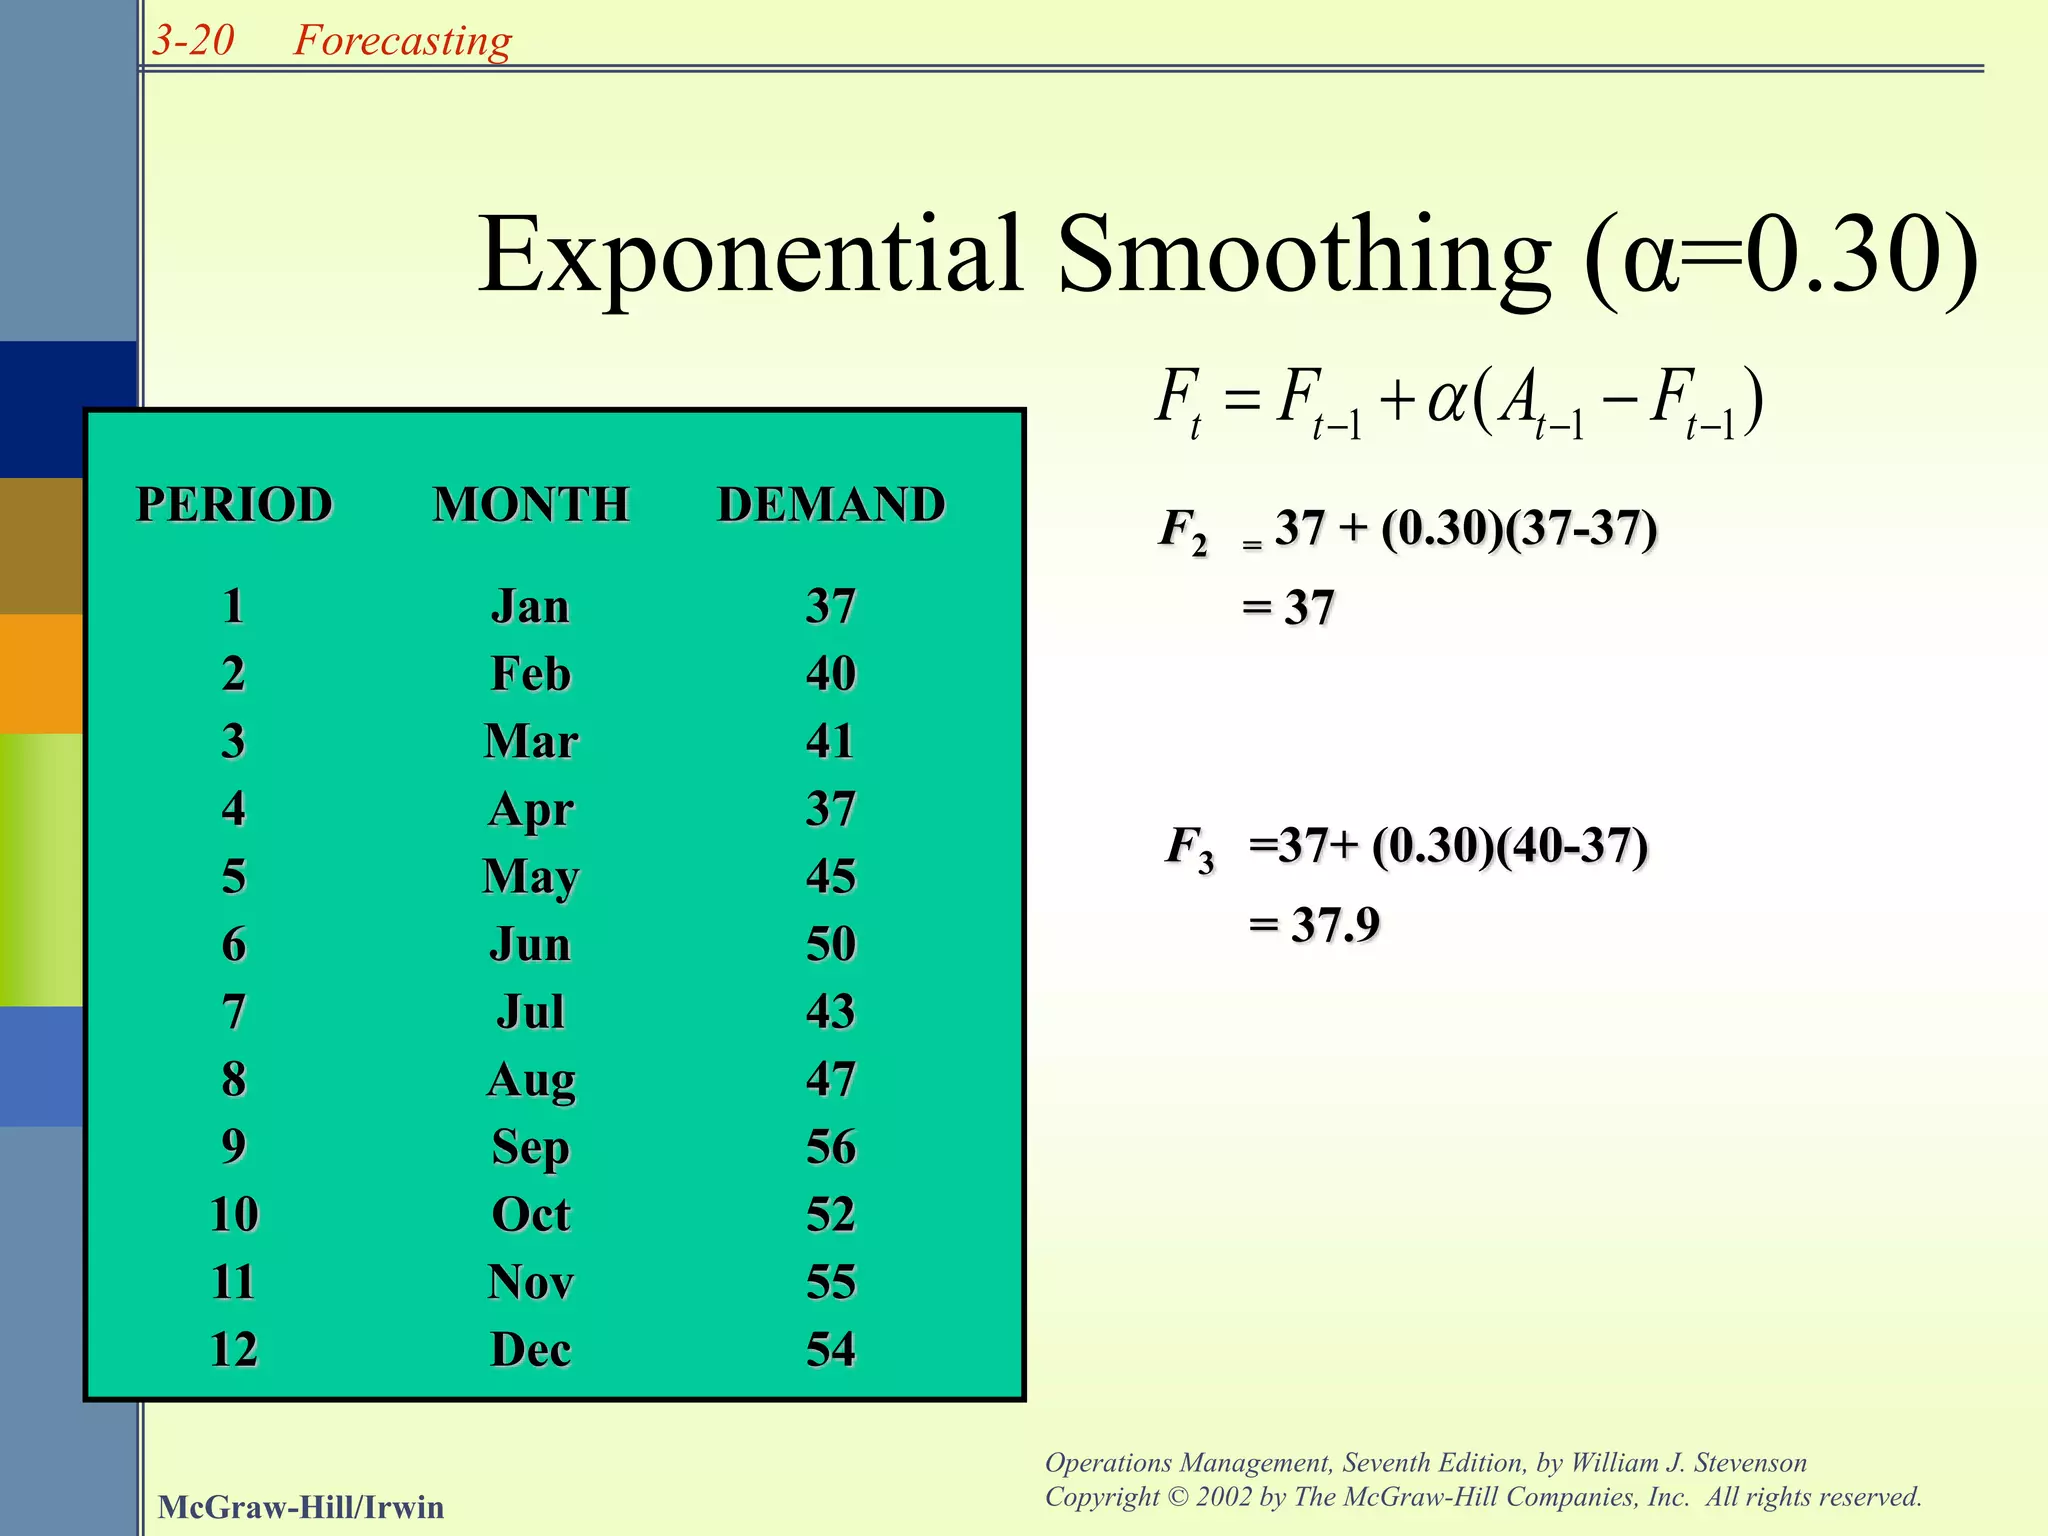
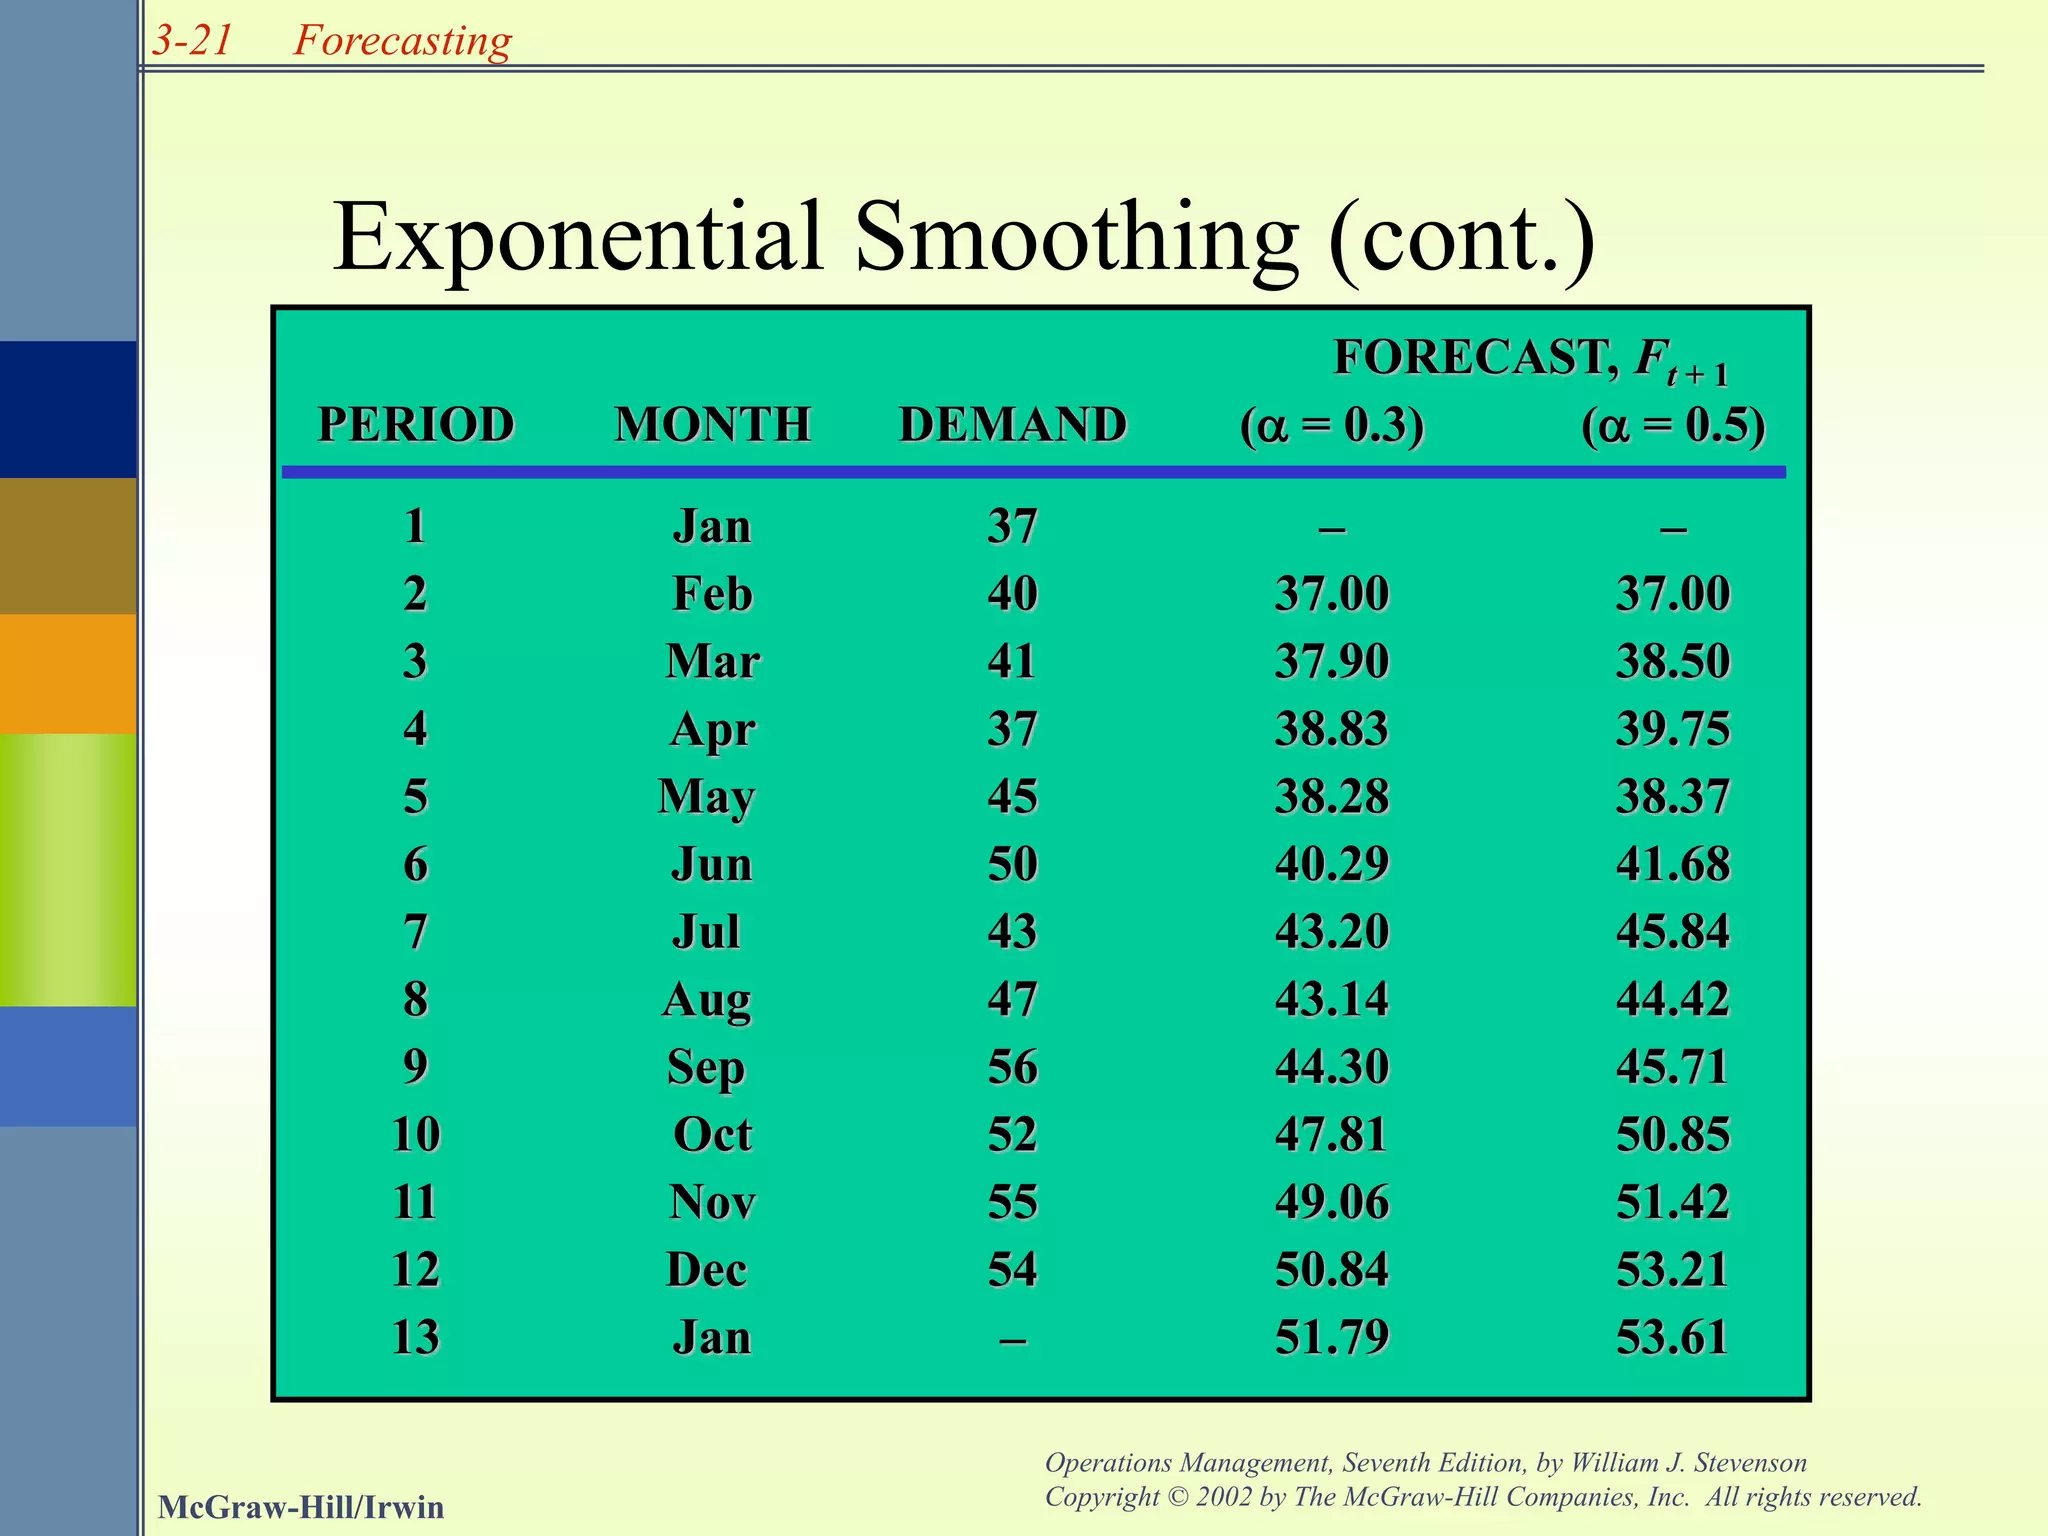
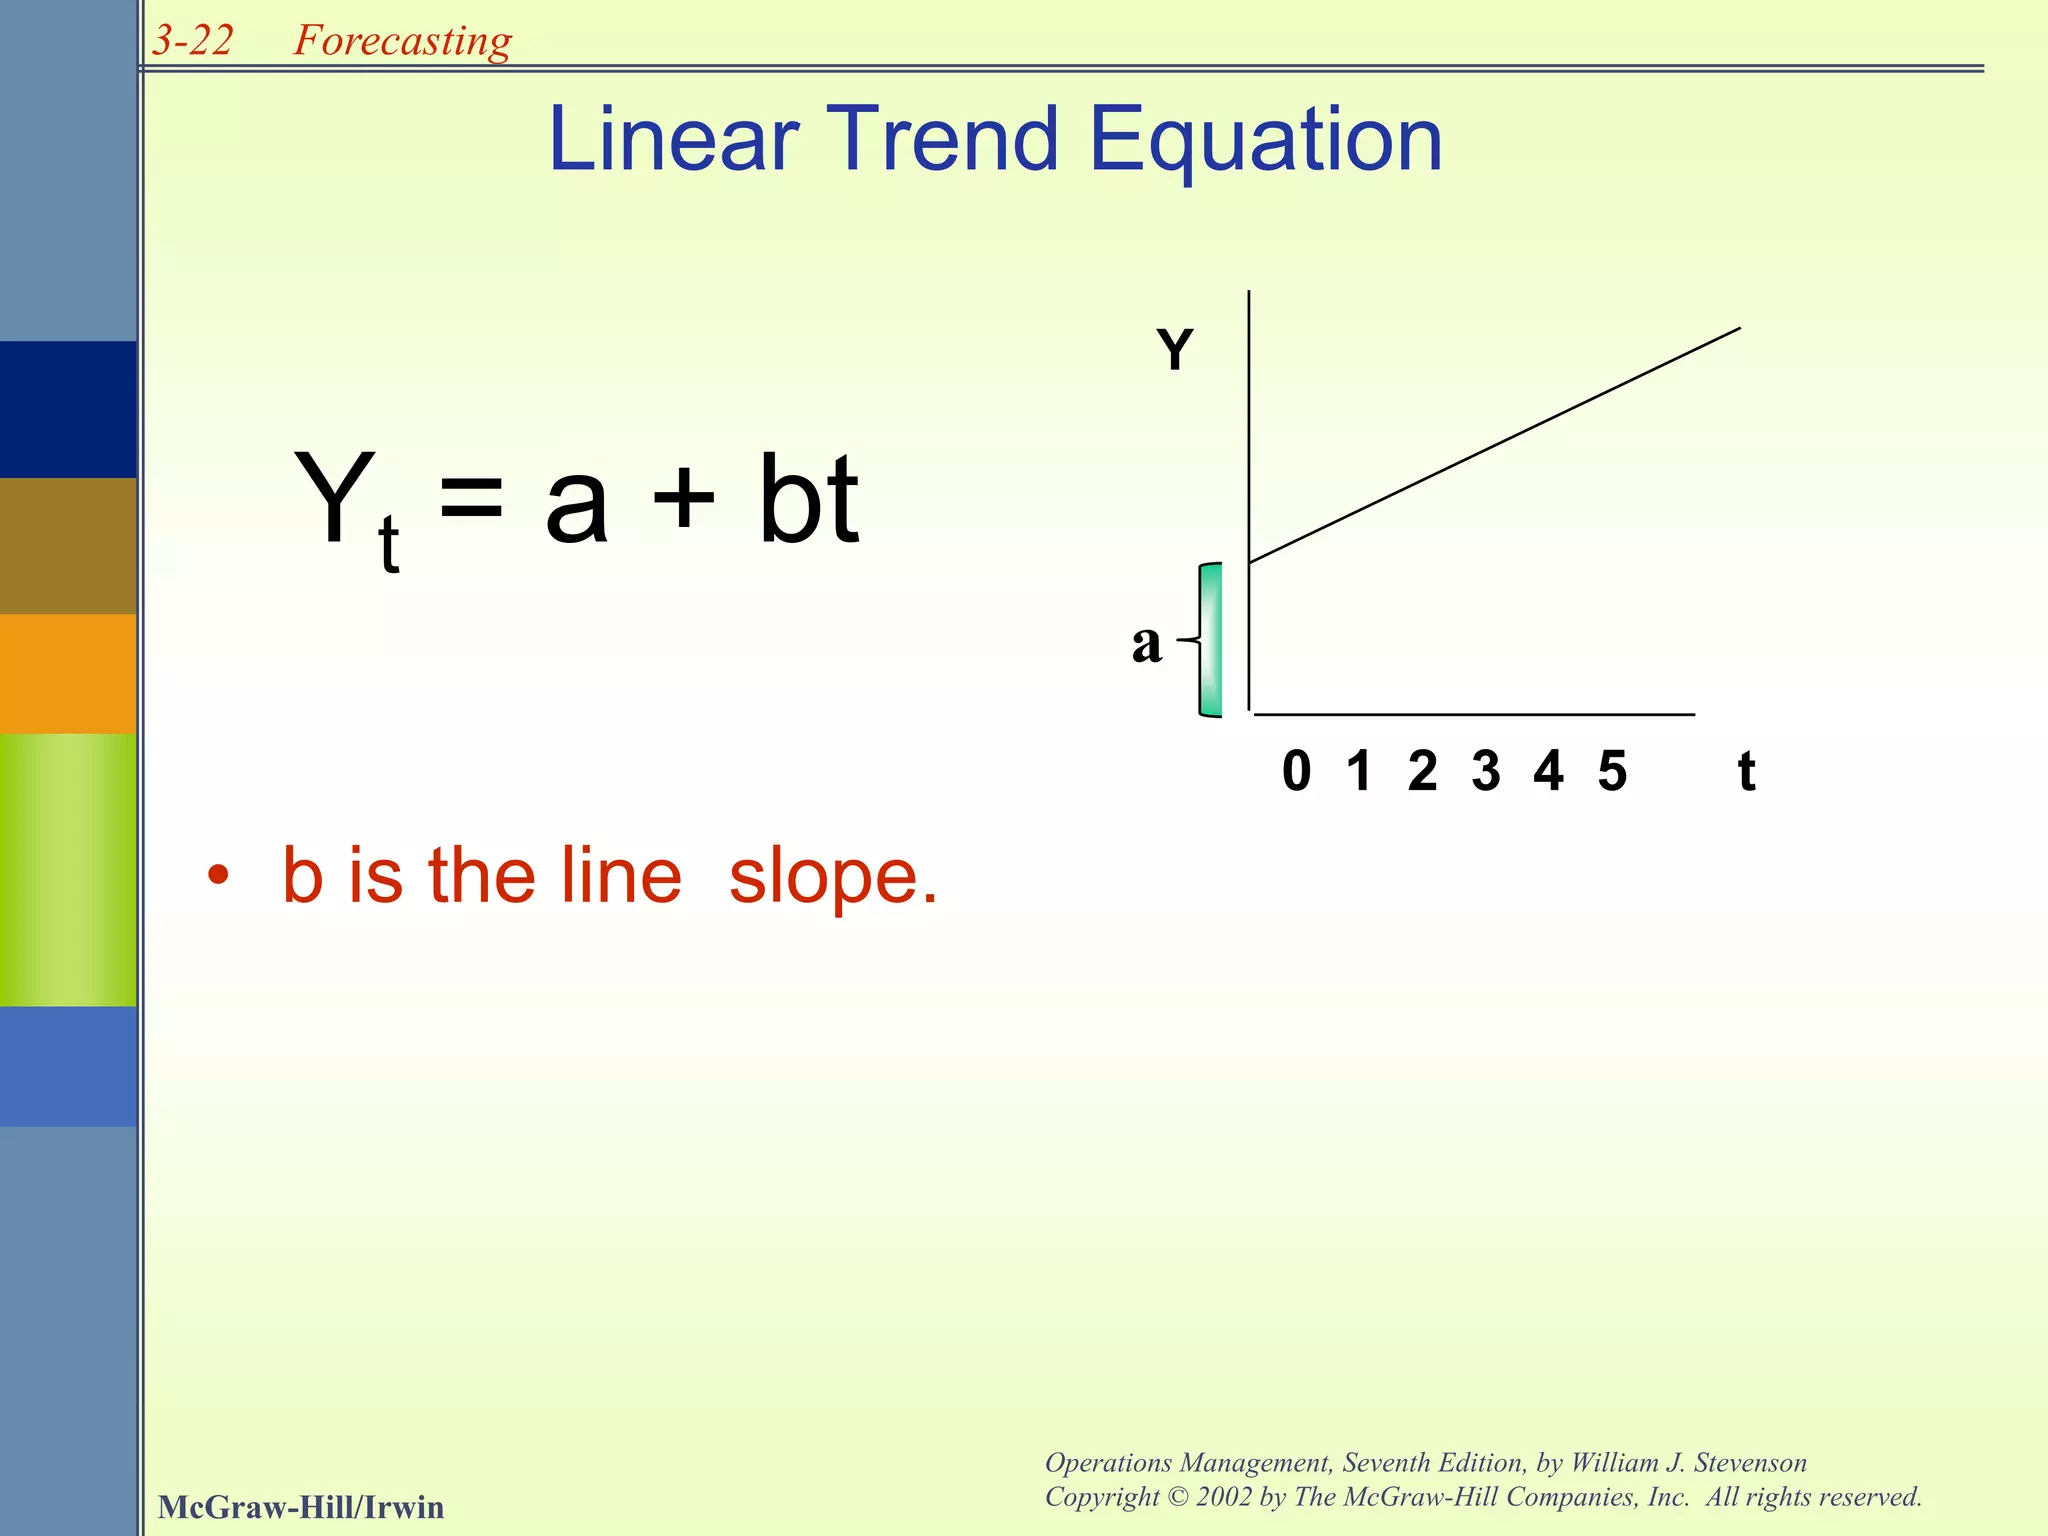
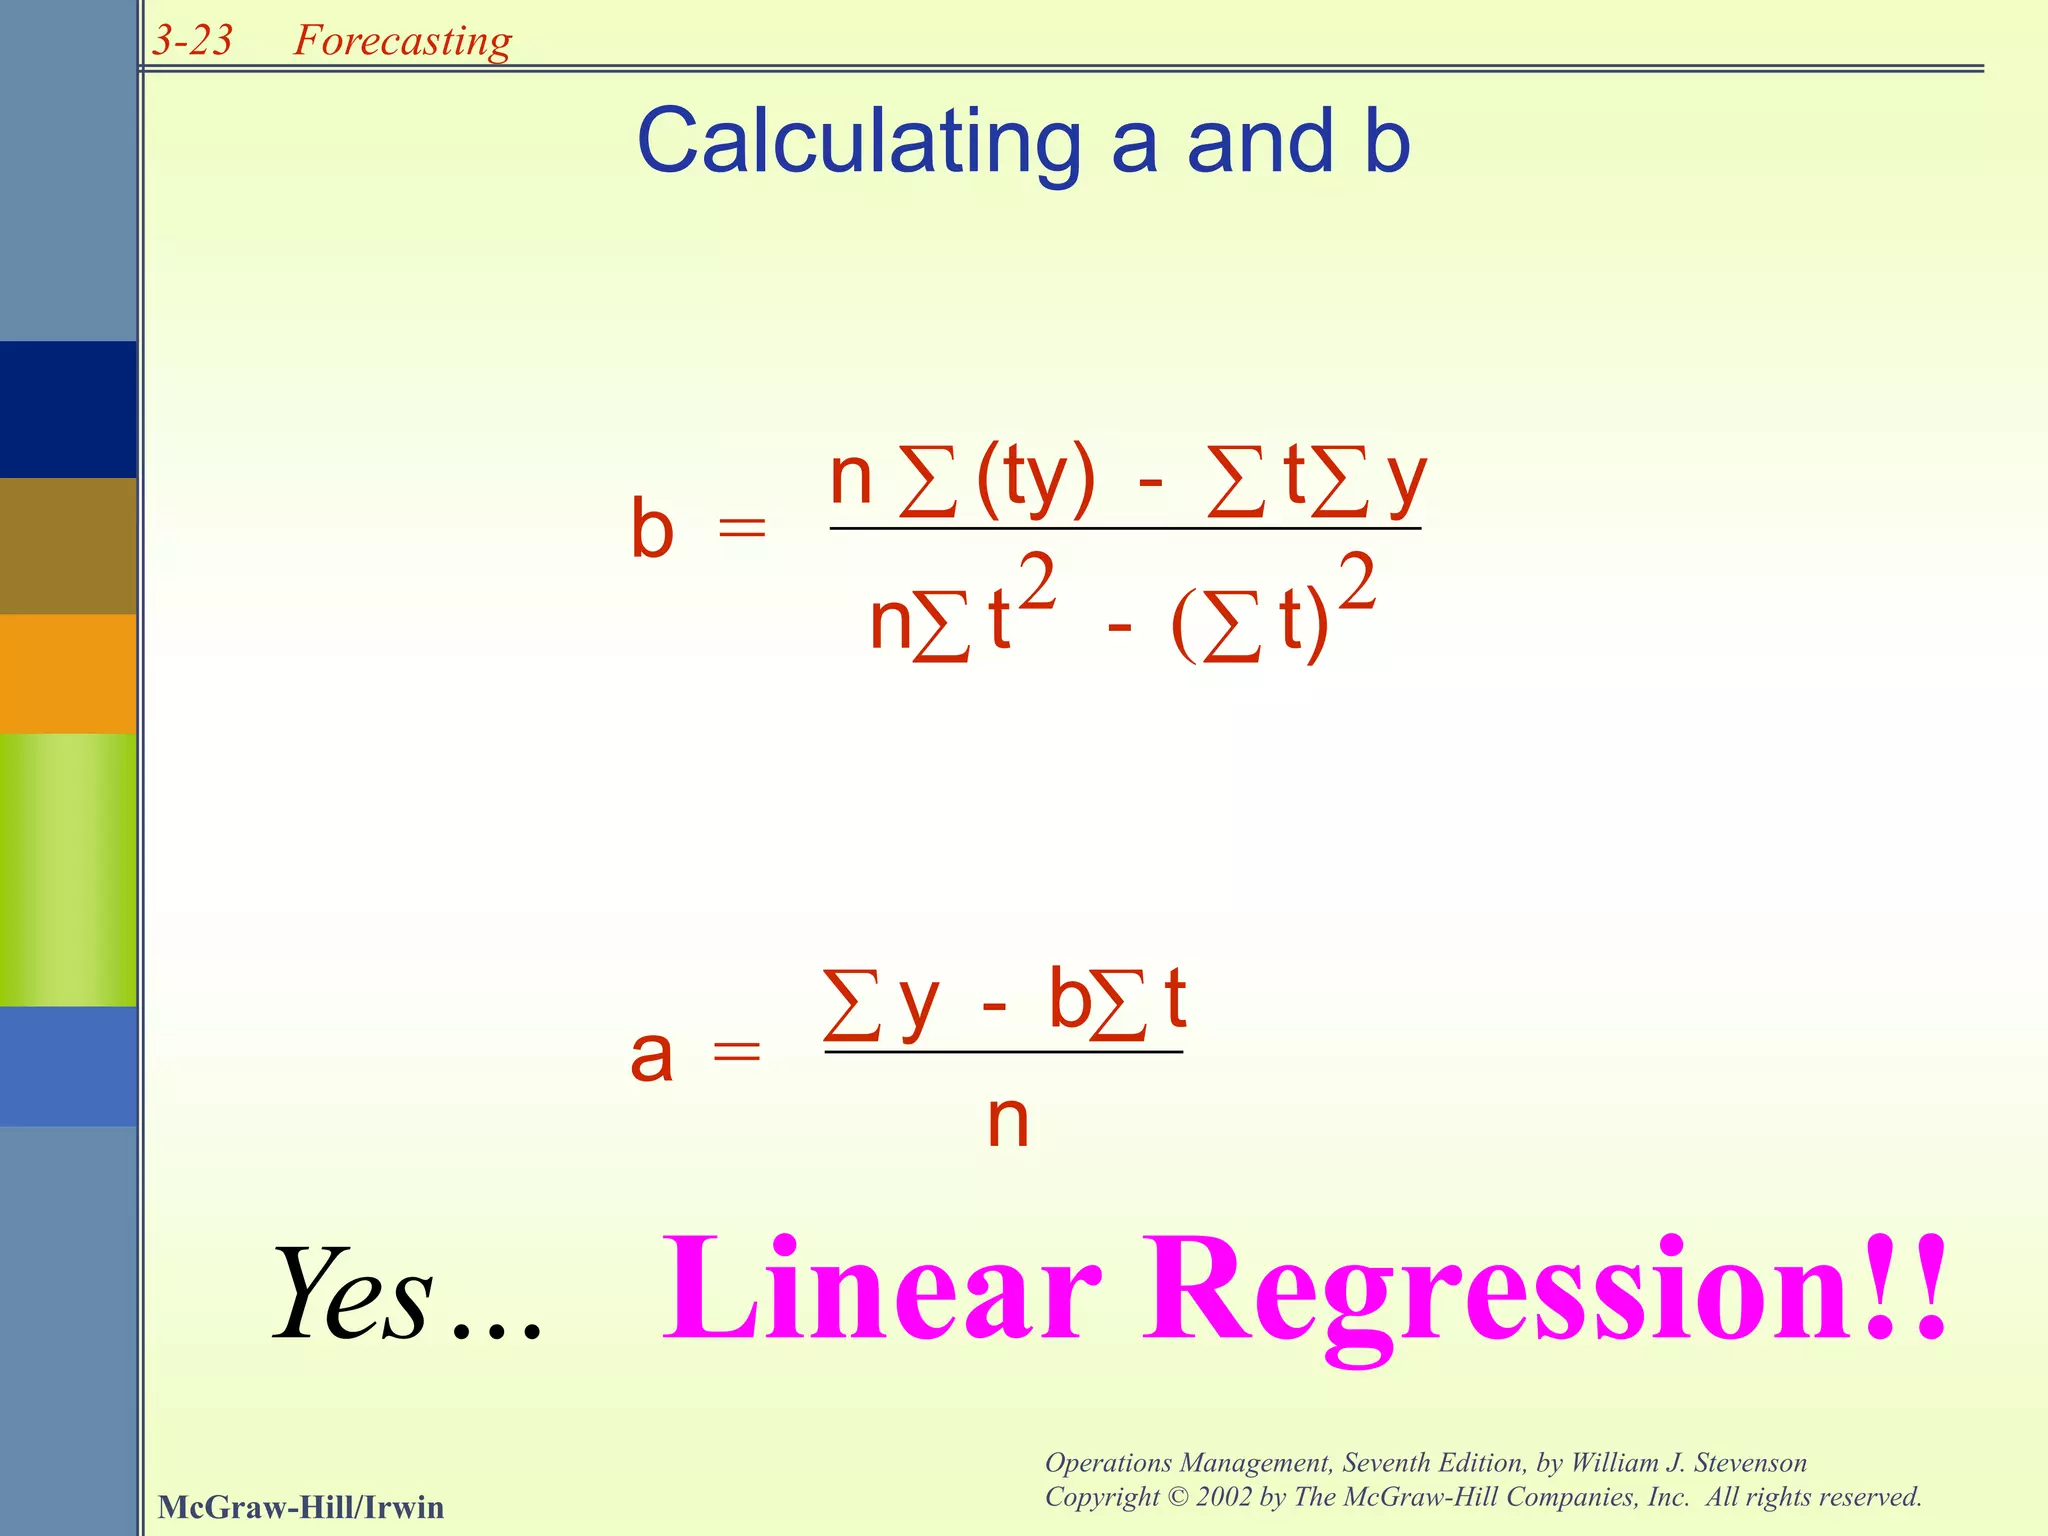
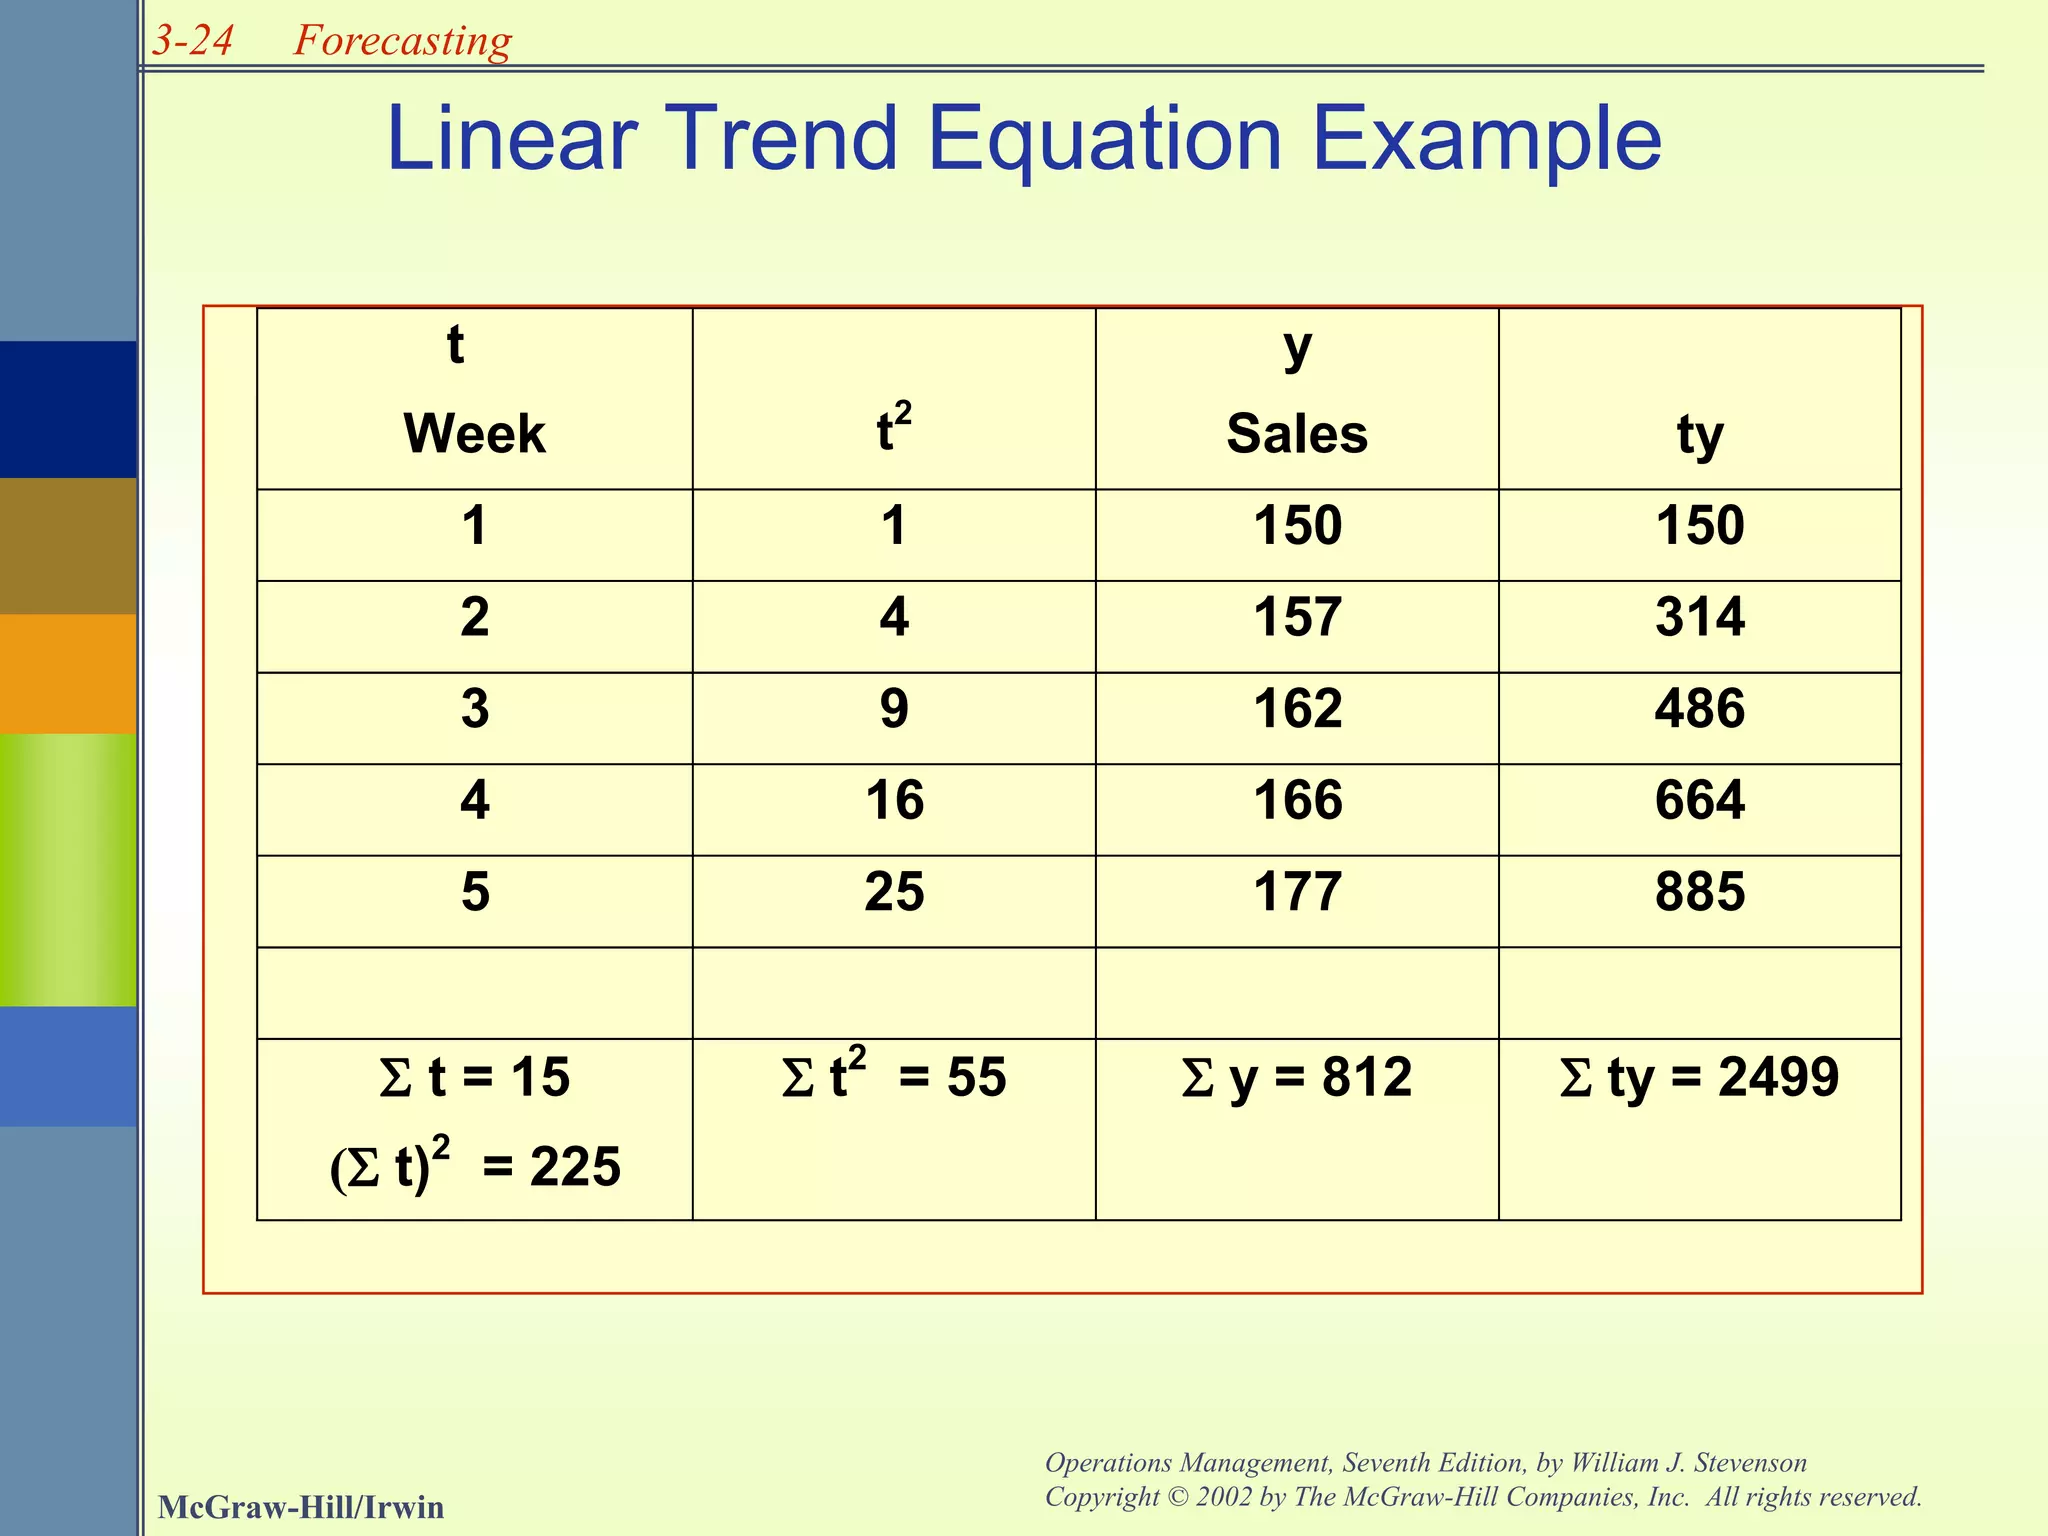
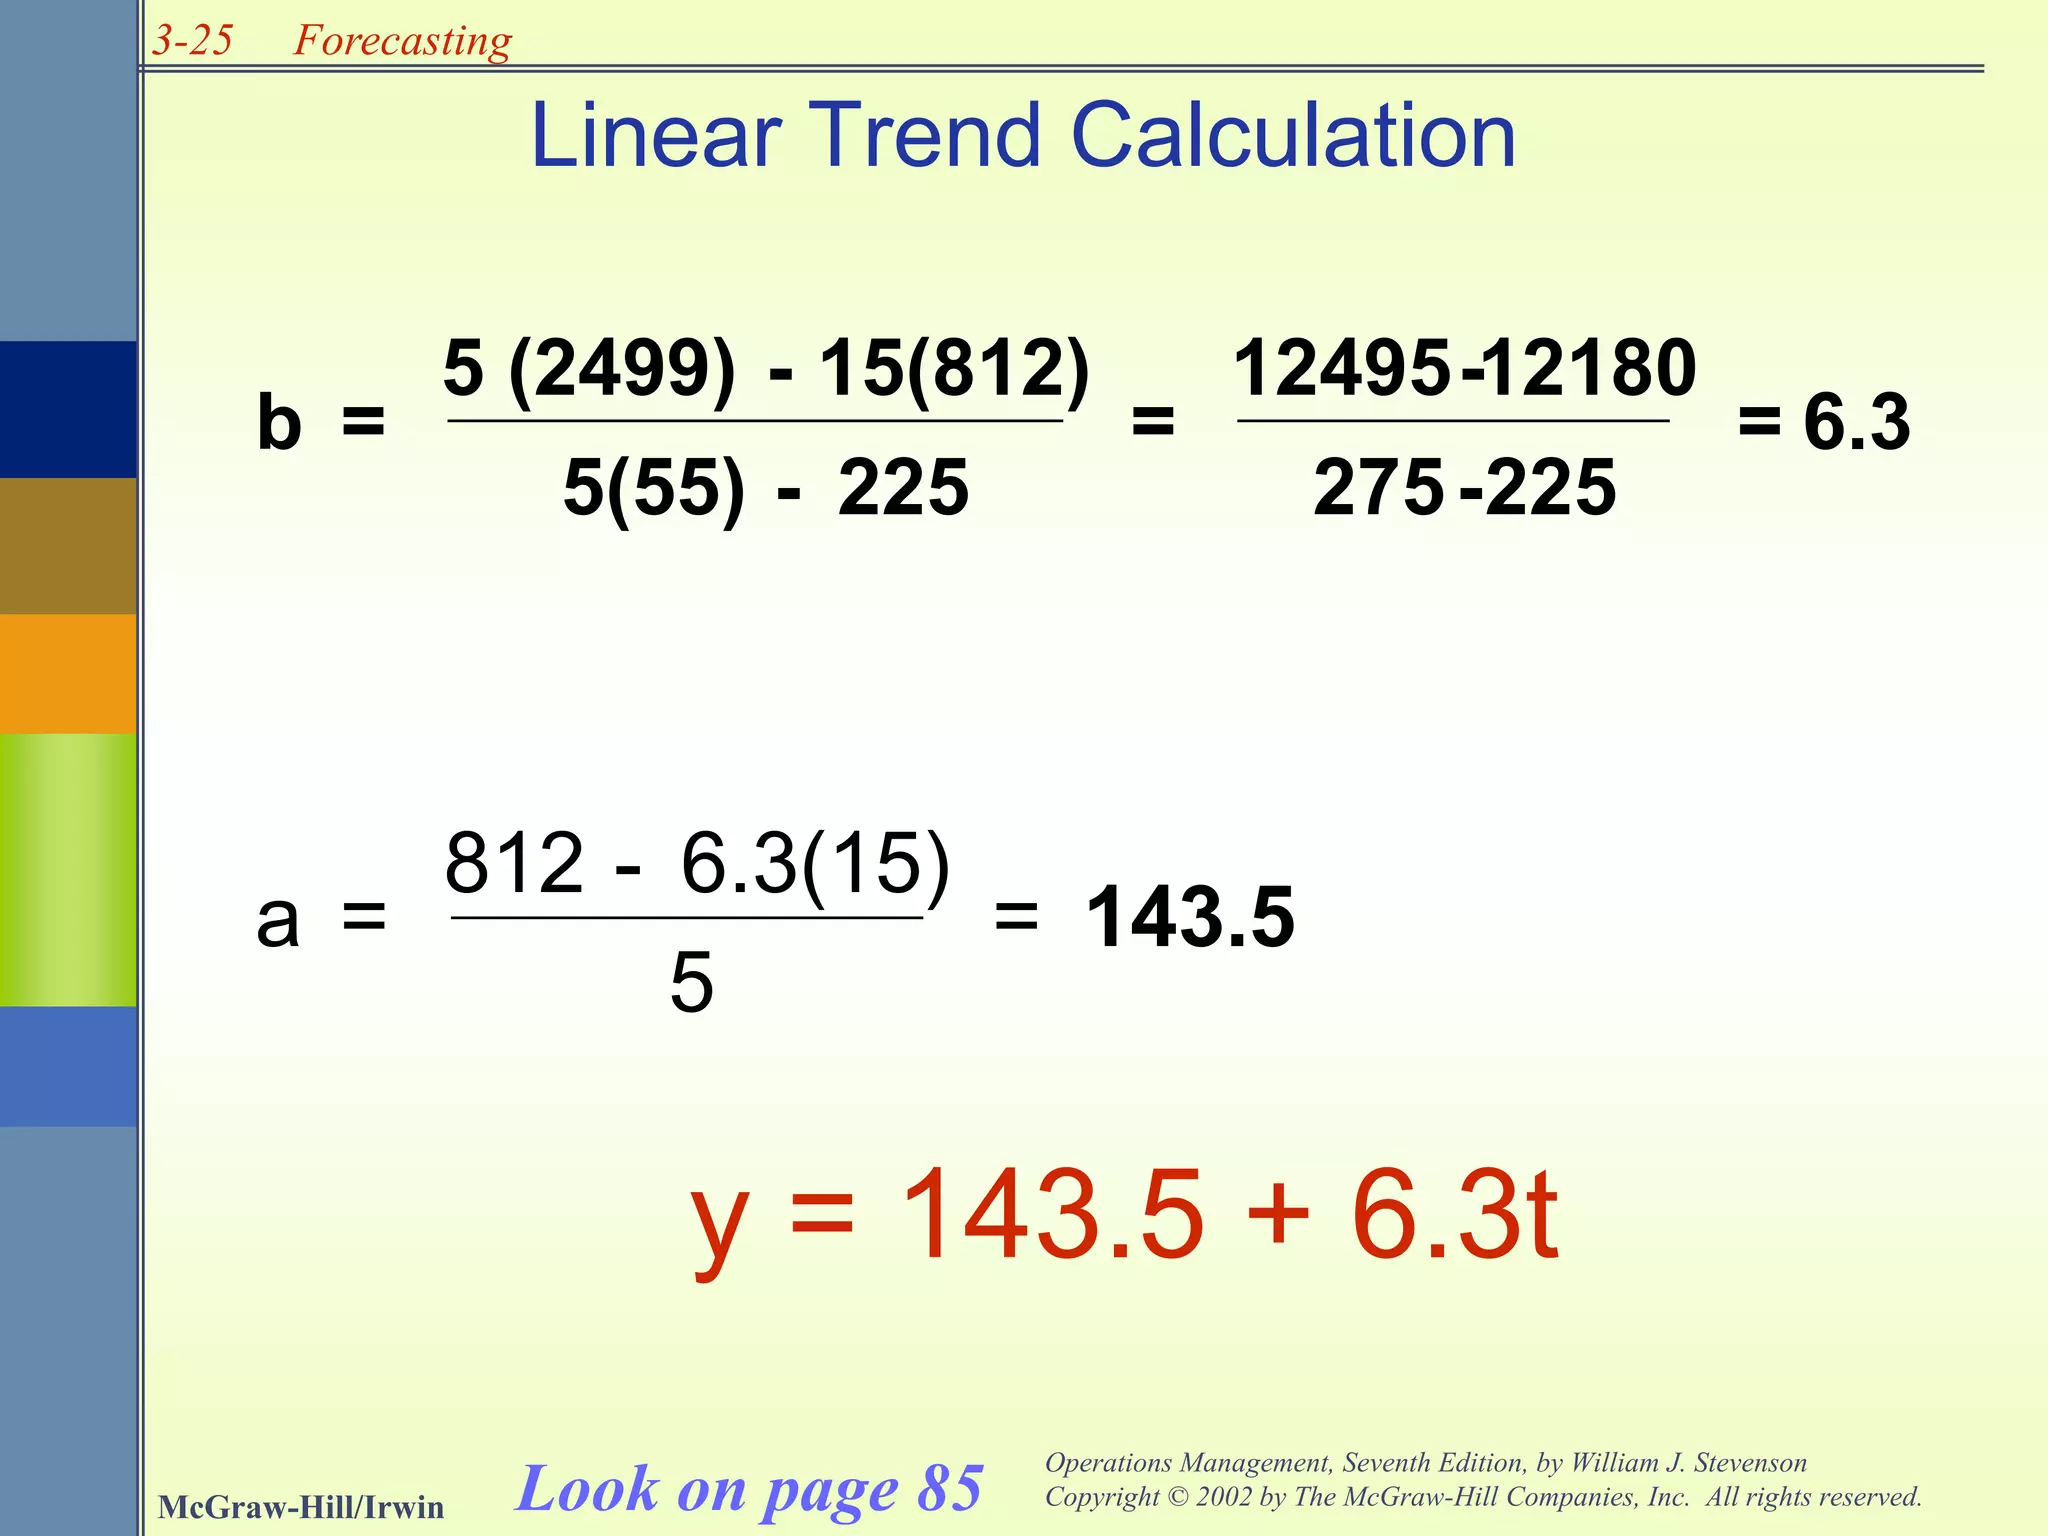
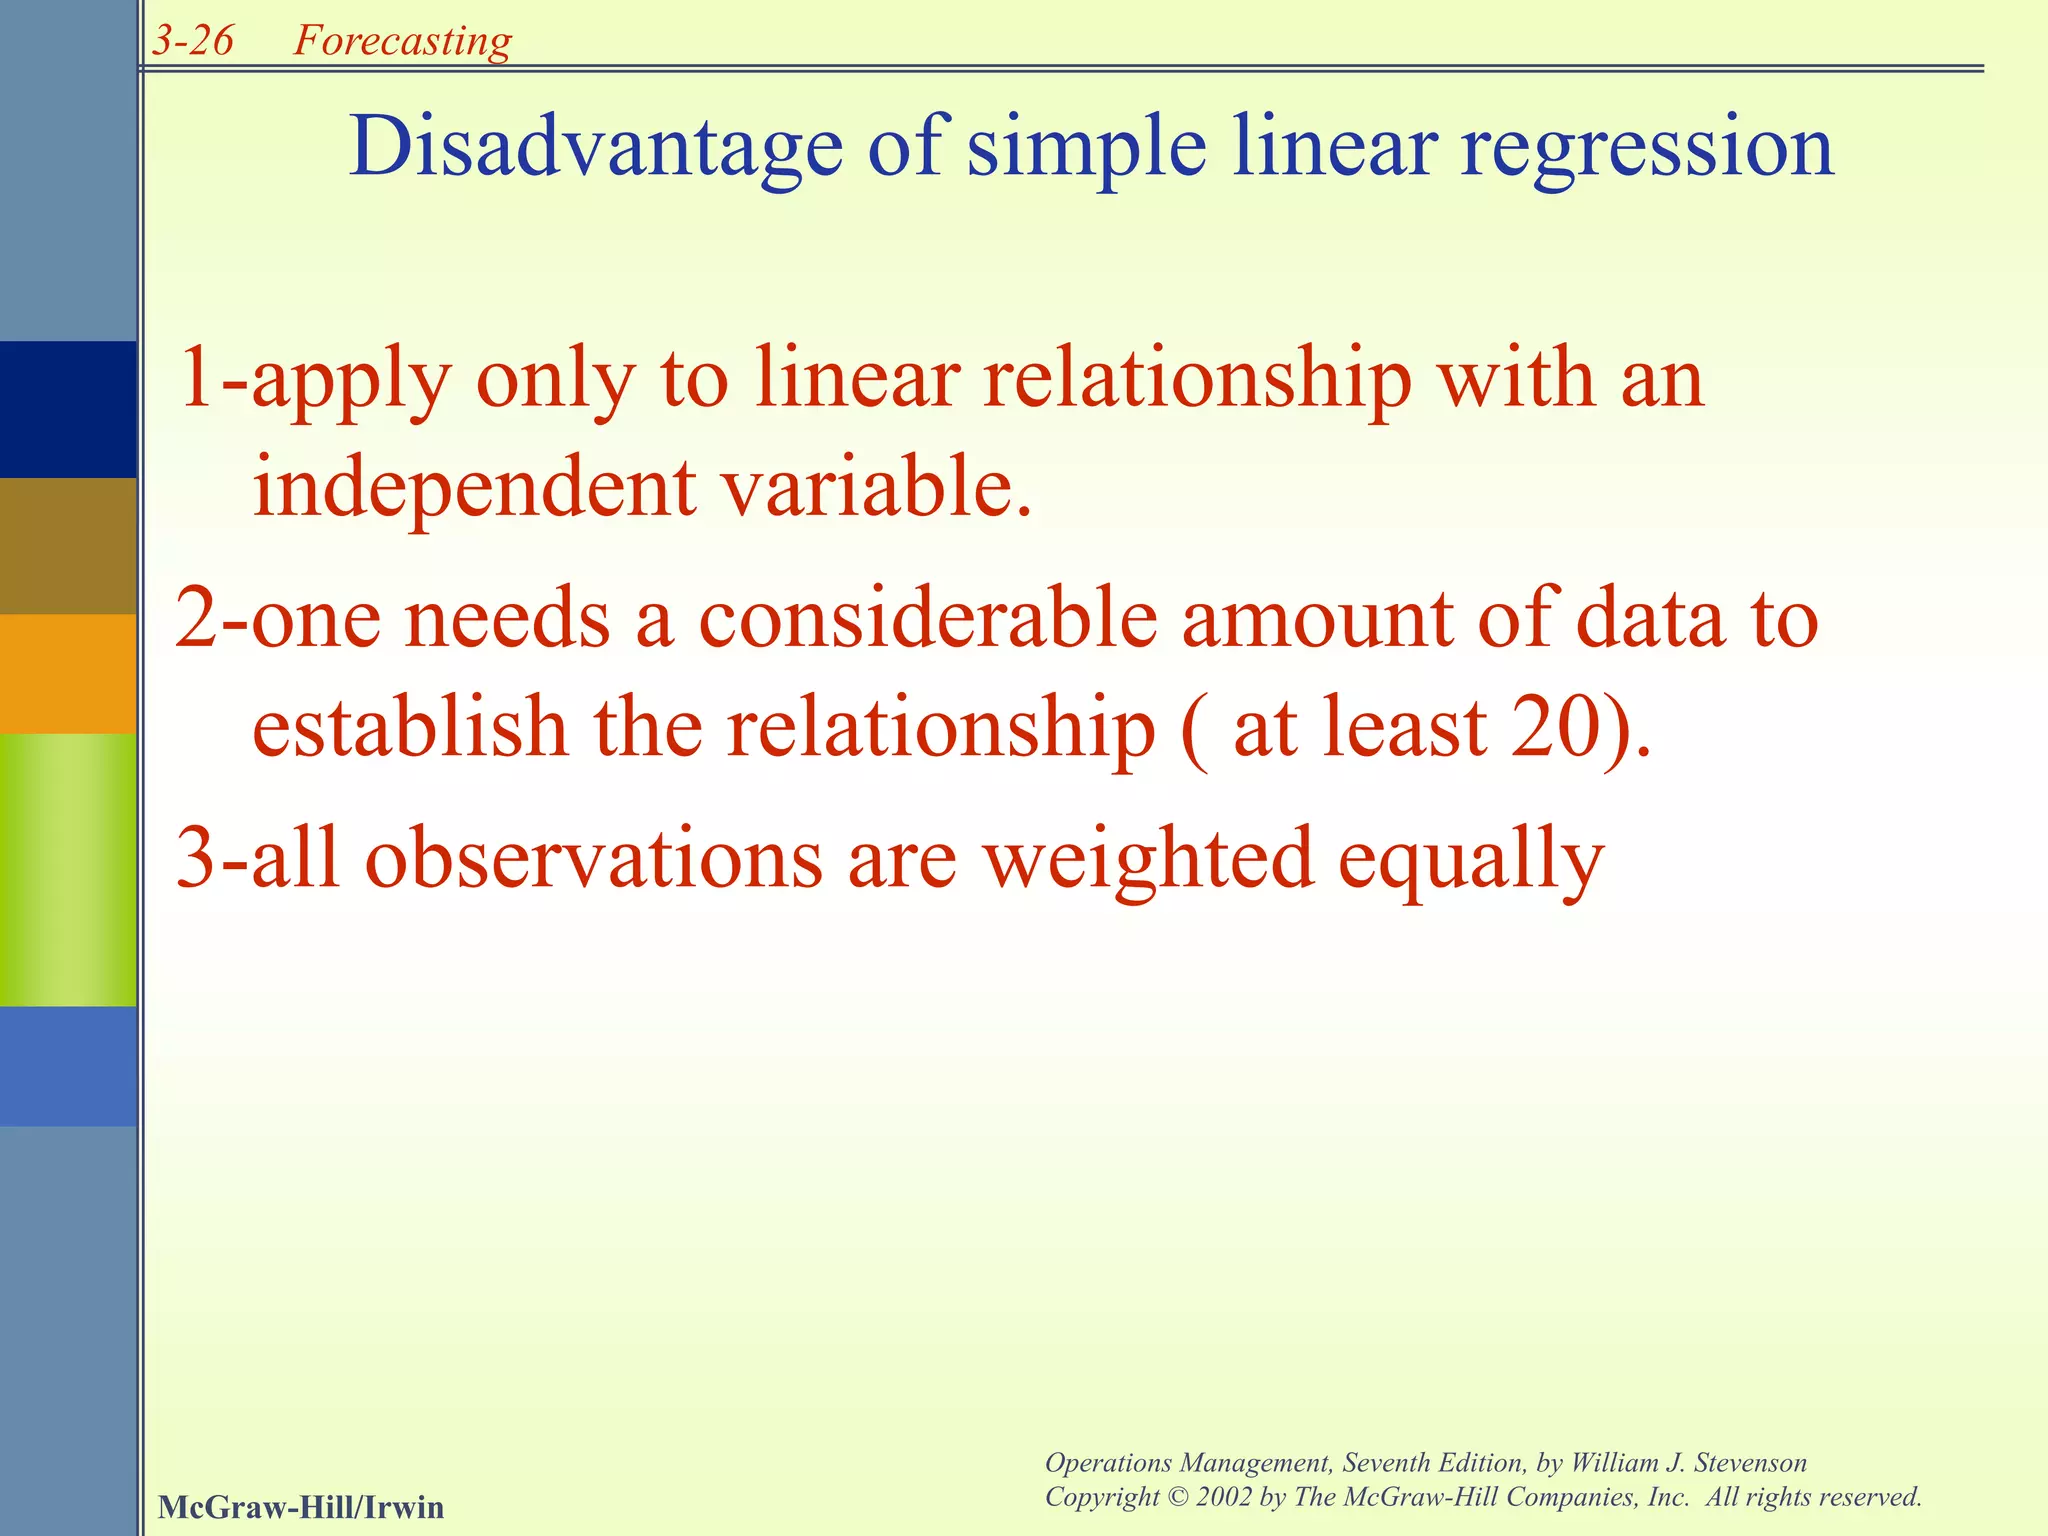
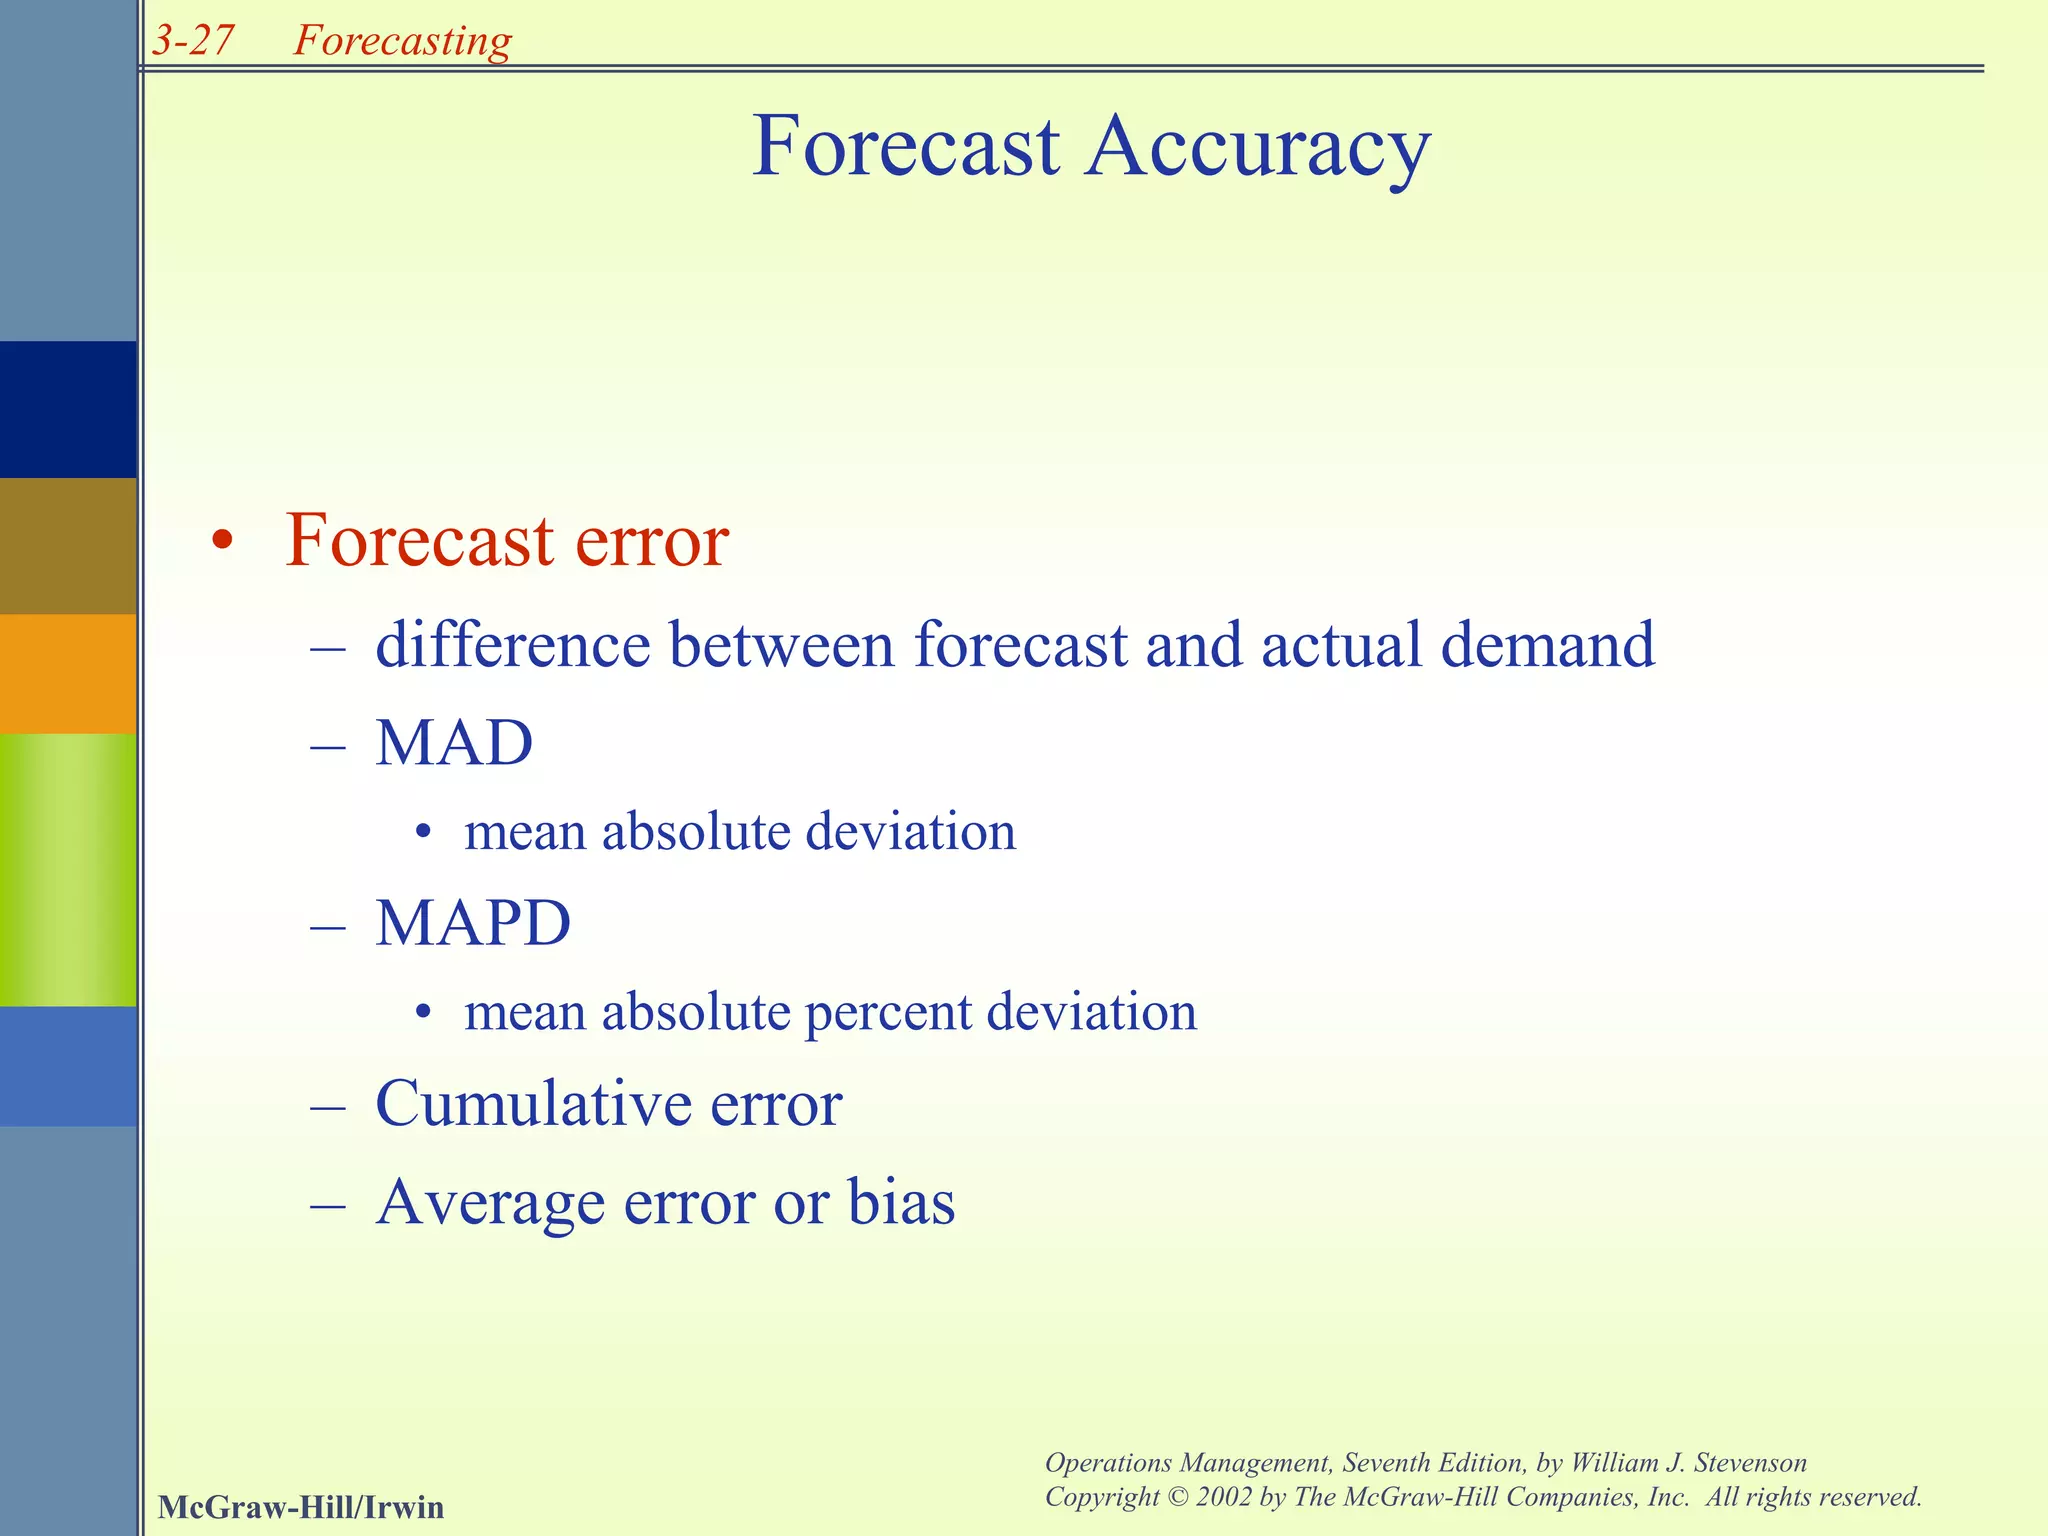
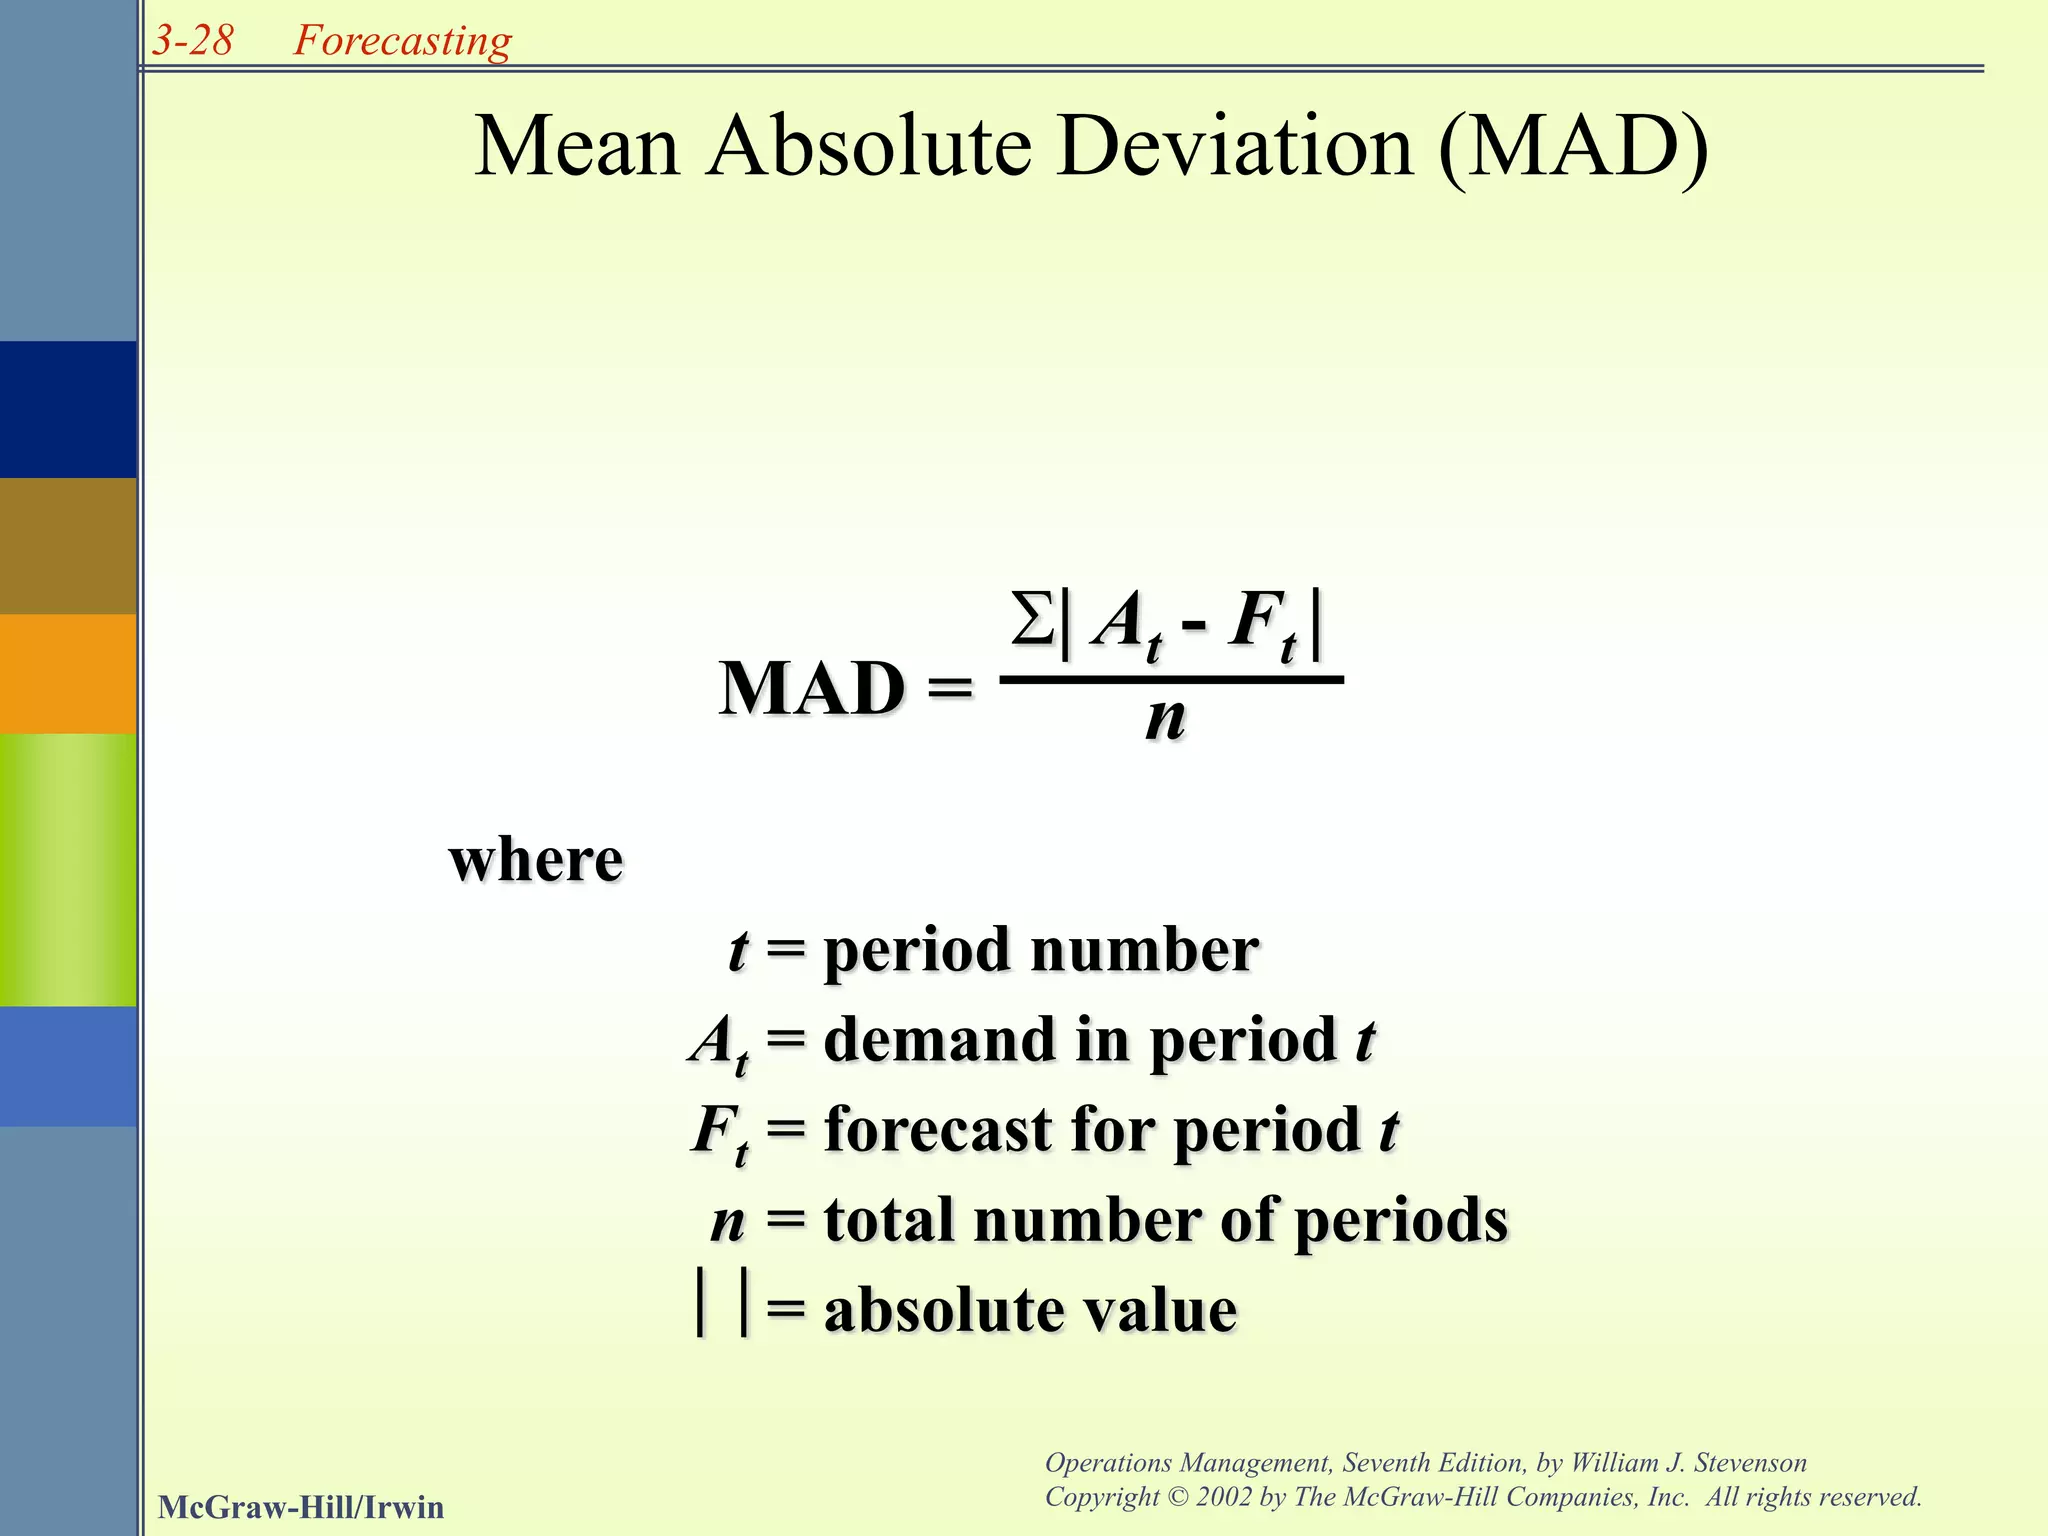
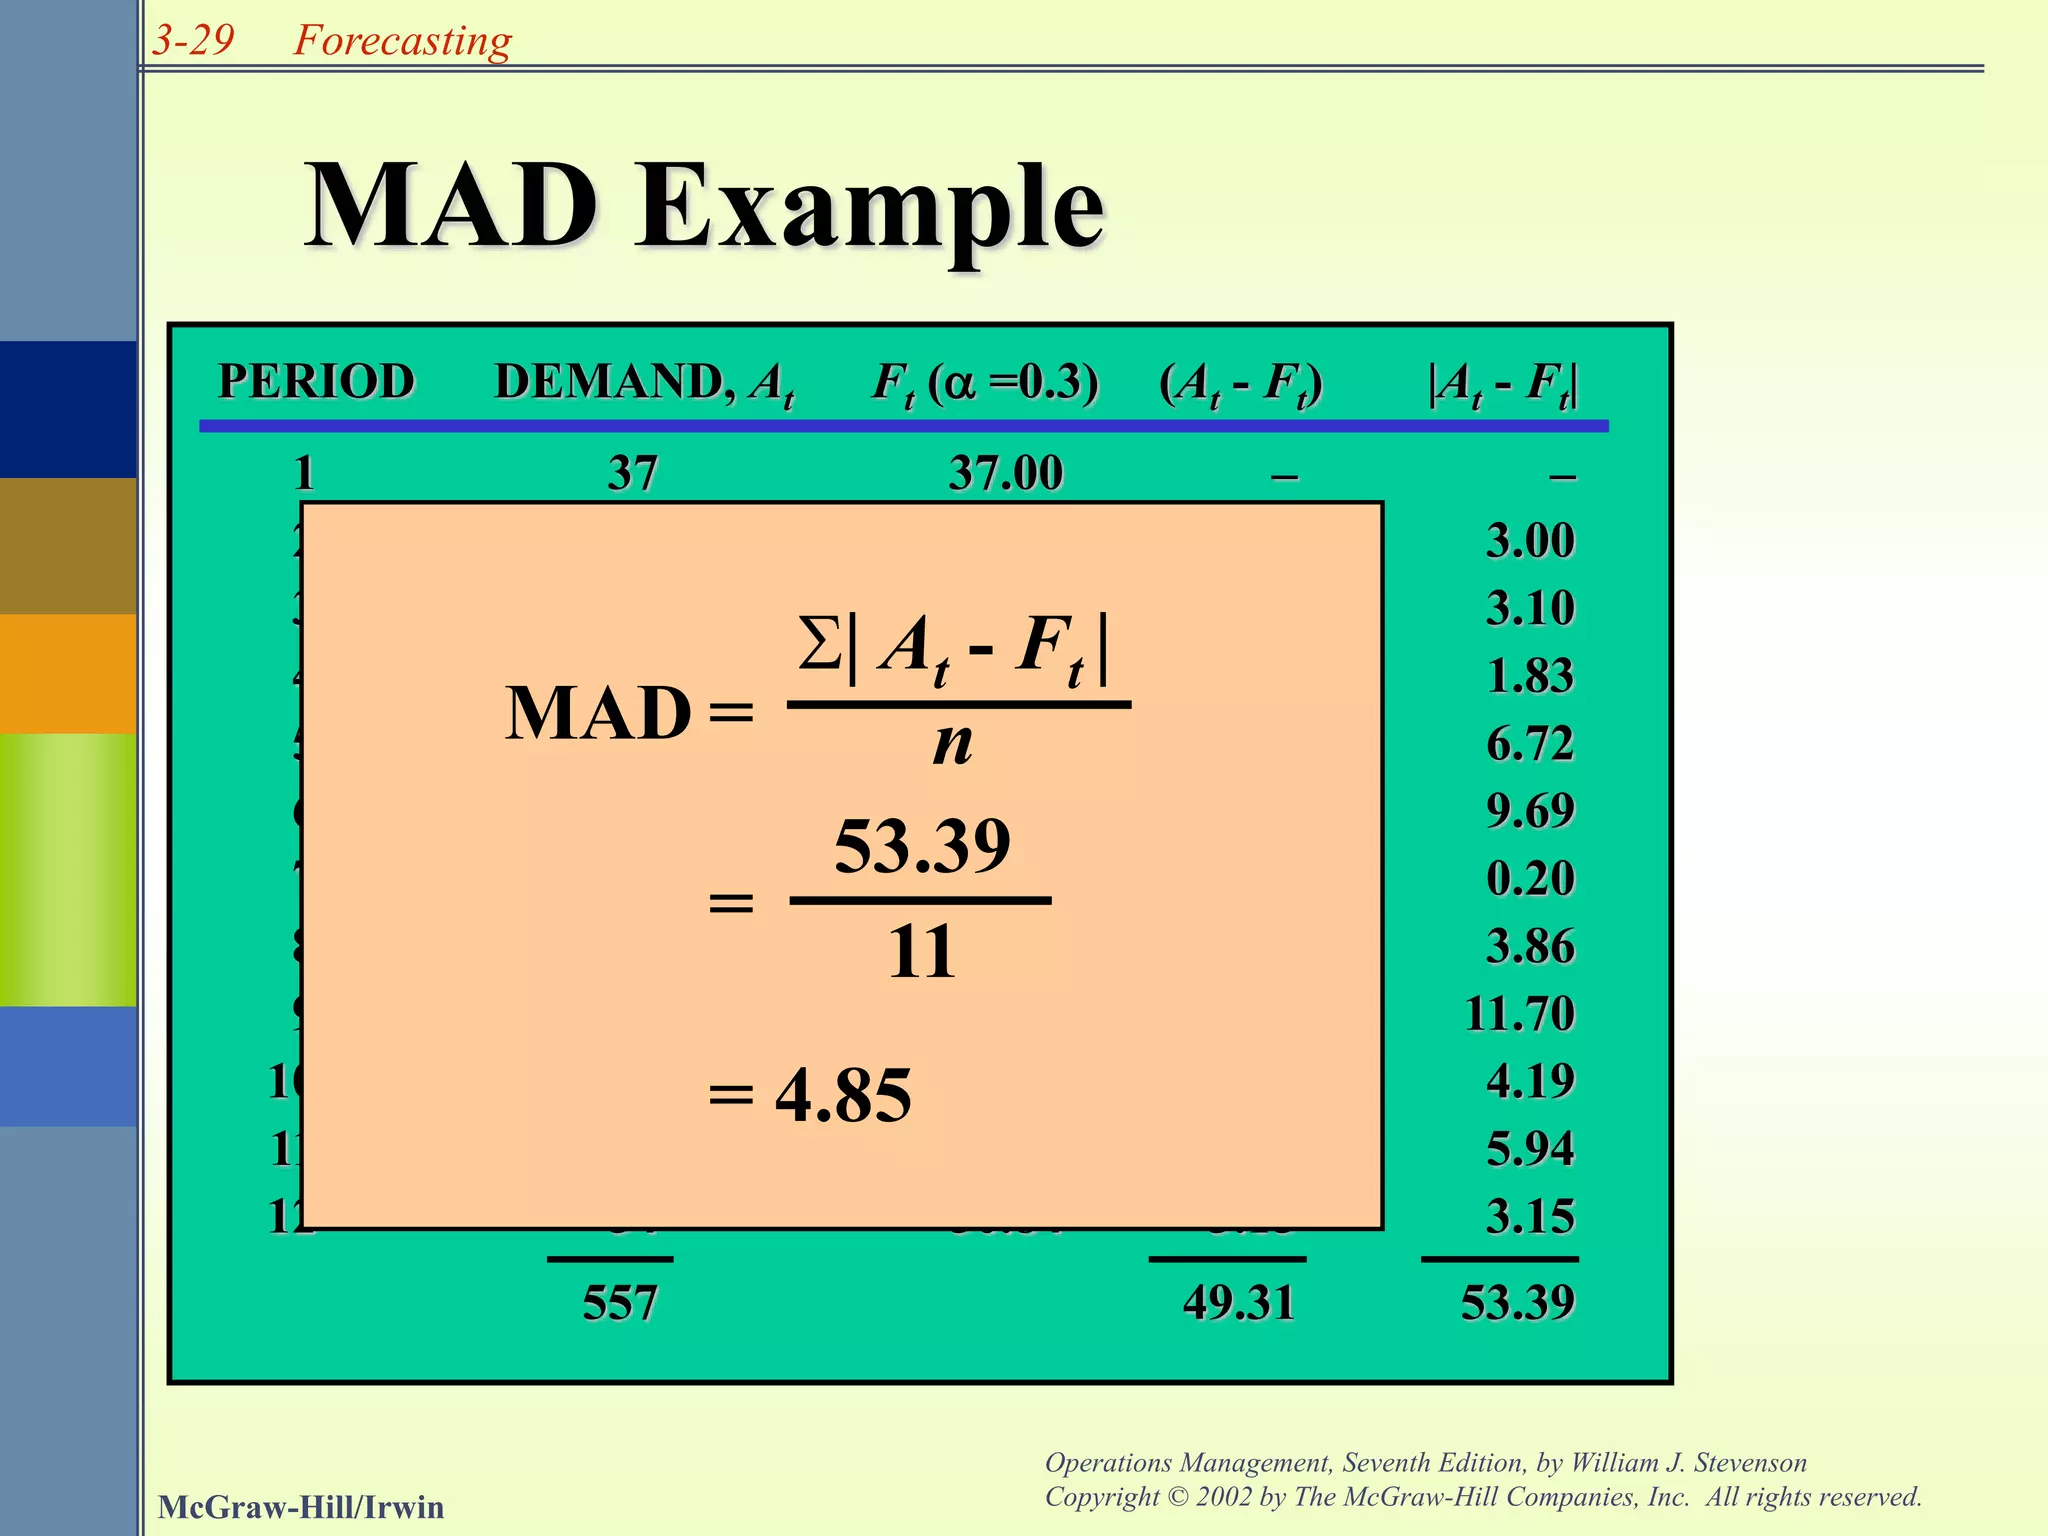
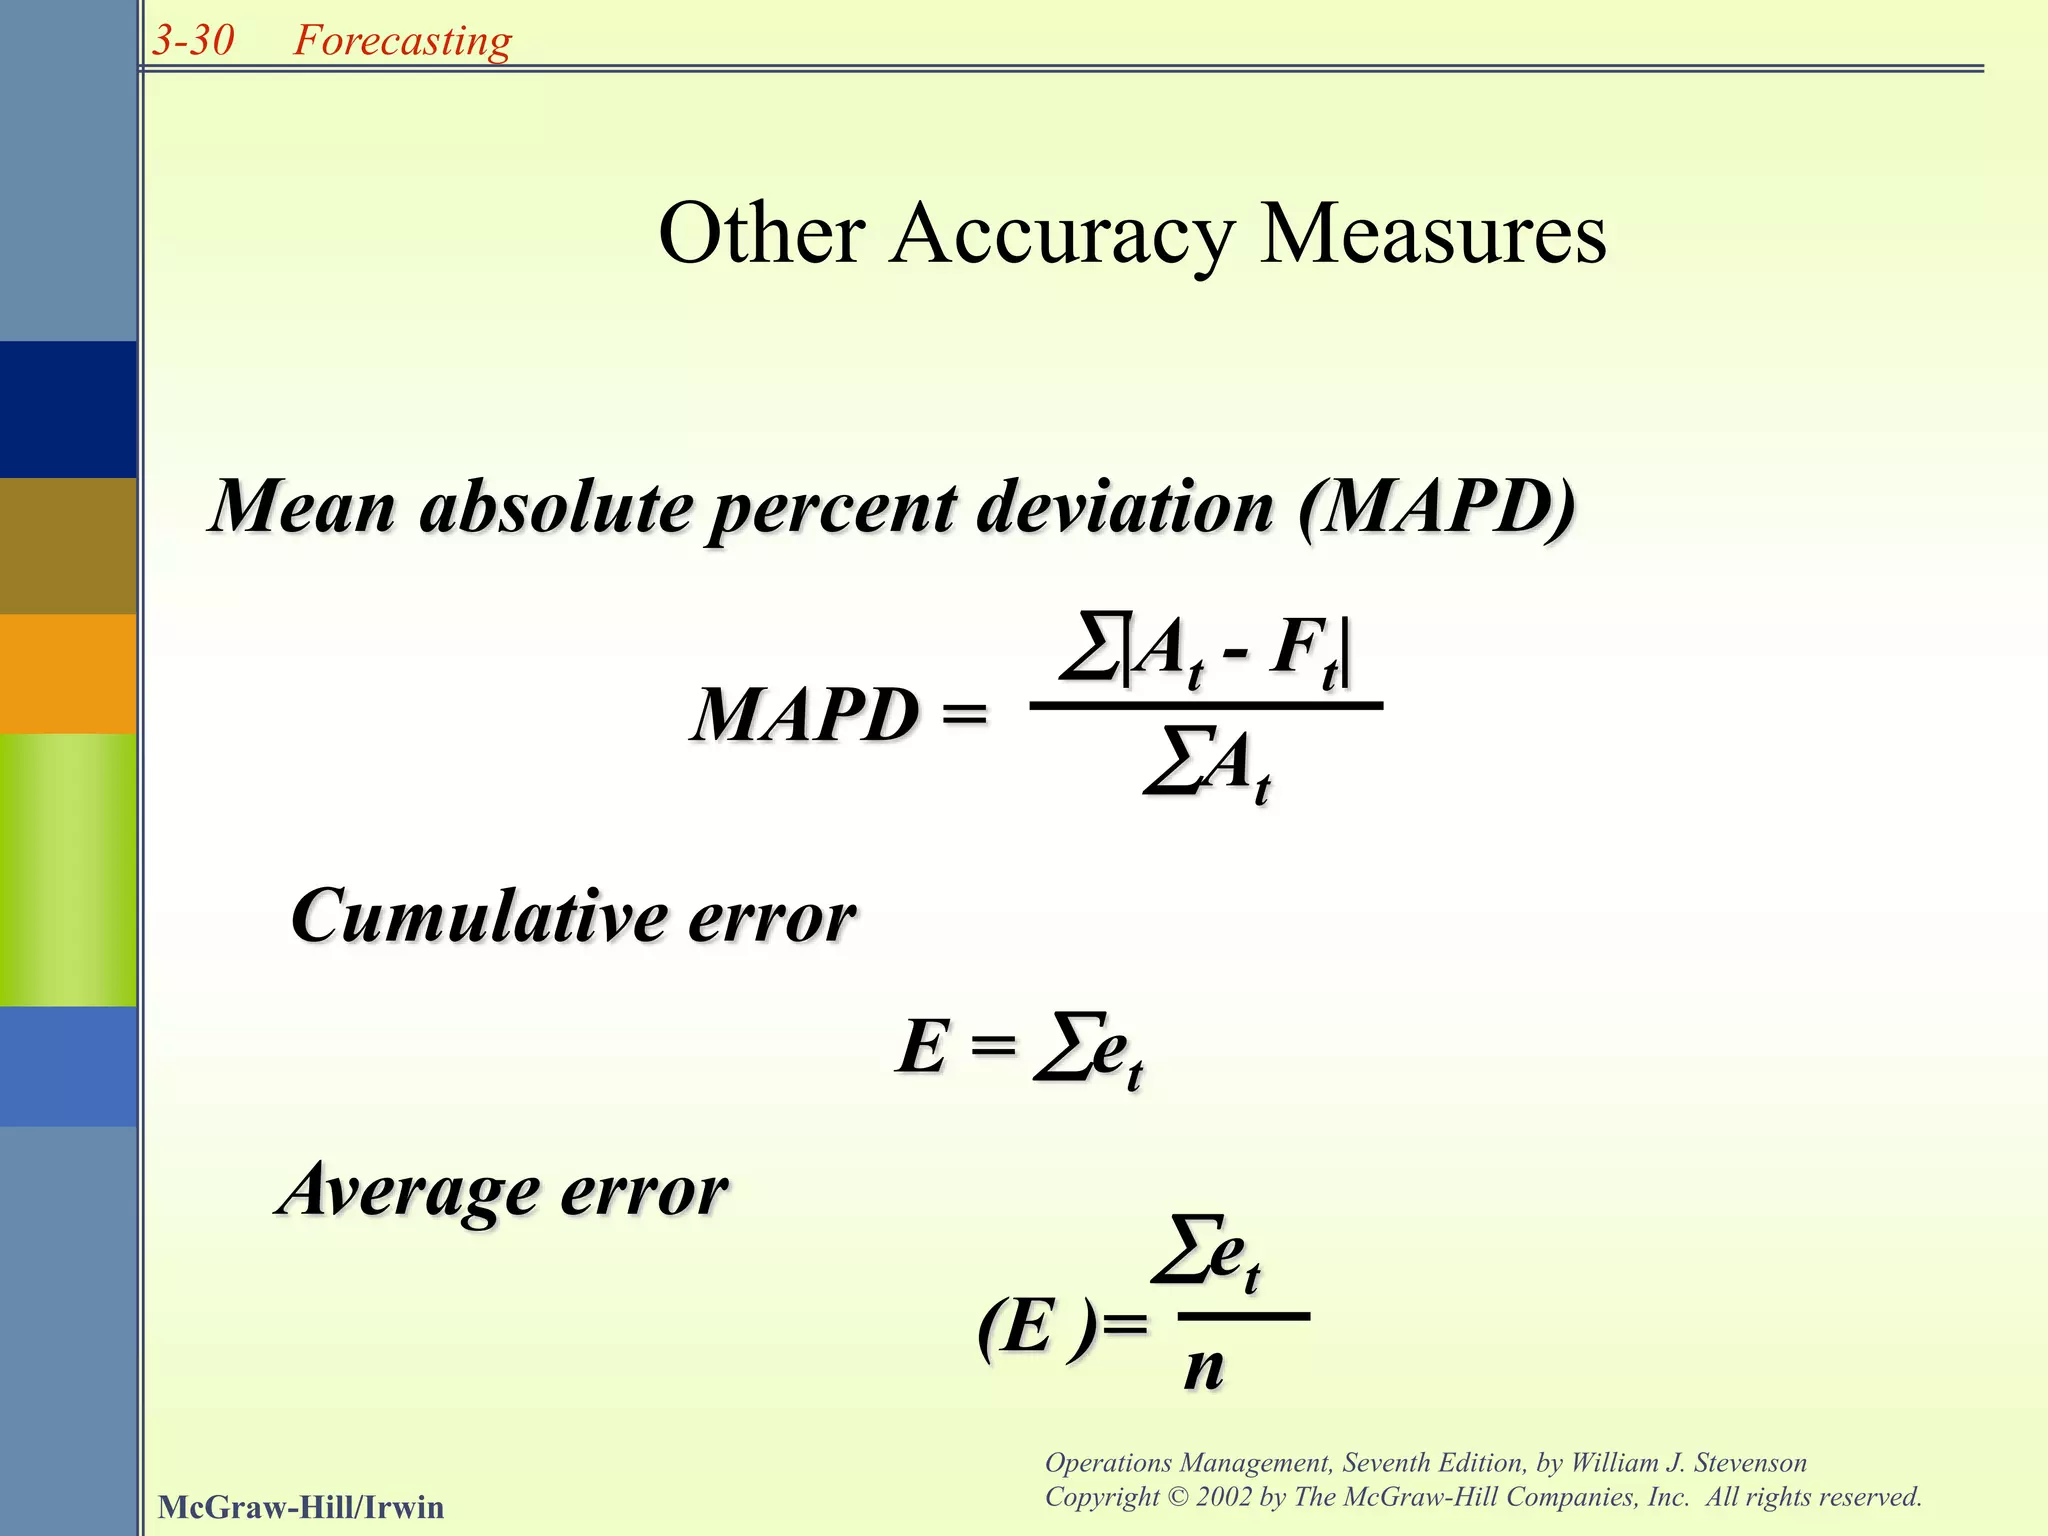
3-1
McGraw-Hill/Irwin
Operations Management, Seventh Edition, by William J. Stevenson
Copyright © 2002 by The McGraw-Hill Companies, Inc. All rights reserved.
Forecasting
Chapter 3
Forecasting
3-2
McGraw-Hill/Irwin
Operations Management, Seventh Edition, by William J. Stevenson
Copyright © 2002 by The McGraw-Hill Companies, Inc. All rights reserved.
Forecasting
FORECAST:
• A statement about the future
• Used to help managers
– Plan the system
– Plan the use of the system
3-3
McGraw-Hill/Irwin
Operations Management, Seventh Edition, by William J. Stevenson
Copyright © 2002 by The McGraw-Hill Companies, Inc. All rights reserved.
Forecasting
Forecast Uses
• Plan the system
– Generally involves long-range plans related to:
• Types of products and services to offer
• Facility and equipment levels
• Facility location
• Plan the use of the system
– Generally involves short- and medium-range plans related to:
• Inventory management
• Workforce levels
• Purchasing
• Budgeting
3-4
McGraw-Hill/Irwin
Operations Management, Seventh Edition, by William J. Stevenson
Copyright © 2002 by The McGraw-Hill Companies, Inc. All rights reserved.
Forecasting
• Assumes causal system
past ==> future
• Forecasts rarely perfect because of
randomness
• Forecasts more accurate for
groups vs. individuals
• Forecast accuracy decreases
as time horizon increases
I see that you will
get an A this quarter.
Common Features
3-5
McGraw-Hill/Irwin
Operations Management, Seventh Edition, by William J. Stevenson
Copyright © 2002 by The McGraw-Hill Companies, Inc. All rights reserved.
Forecasting
Elements of a Good Forecast
Timely
Accurate
Reliable
Written
3-6
McGraw-Hill/Irwin
Operations Management, Seventh Edition, by William J. Stevenson
Copyright © 2002 by The McGraw-Hill Companies, Inc. All rights reserved.
Forecasting
Steps in the Forecasting Process
Step 1 Determine purpose of forecast
Step 2 Establish a time horizon
Step 3 Select a forecasting technique
Step 4 Gather and analyze data
Step 5 Make the forecast
Step 6 Monitor the forecast
“The forecast”
3-7
McGraw-Hill/Irwin
Operations Management, Seventh Edition, by William J. Stevenson
Copyright © 2002 by The McGraw-Hill Companies, Inc. All rights reserved.
Forecasting
Types of Forecasts
• Judgmental - uses subjective inputs (qualitative)
• Time series - uses historical data assuming the
future will be like the past (quantitative)
• Associative models - uses explanatory variables
to predict the future
3-8
McGraw-Hill/Irwin
Operations Management, Seventh Edition, by William J. Stevenson
Copyright © 2002 by The McGraw-Hill Companies, Inc. All rights reserved.
Forecasting
Judgmental Forecasts
(Qualitative)
•Consumer surveys
•Delphi method
•Executive opinions
– Opinions of managers and staff
•Sales force.
3-9
McGraw-Hill/Irwin
Operations Management, Seventh Edition, by William J. Stevenson
Copyright © 2002 by The McGraw-Hill Companies, Inc. All rights reserved.
Forecasting
3-10
McGraw-Hill/Irwin
Operations Management, Seventh Edition, by William J. Stevenson
Copyright © 2002 by The McGraw-Hill Companies, Inc. All rights reserved.
Forecasting
Time Series Forecasts
(Quantitative)
• Trend - long-term movement in data
• Seasonality - short-term regular variations in
data
• Irregular variations - caused by unusual
circumstances
• Random variations - caused by chance
• CYCLE- wave like variations lasting more
than one year
3-11
McGraw-Hill/Irwin
Operations Management, Seventh Edition, by William J. Stevenson
Copyright © 2002 by The McGraw-Hill Companies, Inc. All rights reserved.
Forecasting
Forecast Variations
Trend
Irregular
variation
Cycles
Seasonal variations
90
89
88
Figure 3-1
cycle
3-12
McGraw-Hill/Irwin
Operations Management, Seventh Edition, by William J. Stevenson
Copyright © 2002 by The McGraw-Hill Companies, Inc. All rights reserved.
Forecasting
The Forecast of Forecasts
• Naïve
• Simple Moving Average
• Weighted Moving Average
• Exponential Smoothing
• ES with Trend and Seasonality
3-13
McGraw-Hill/Irwin
Operations Management, Seventh Edition, by William J. Stevenson
Copyright © 2002 by The McGraw-Hill Companies, Inc. All rights reserved.
Forecasting
• Simple to use
• Virtually no cost
• Data analysis is nonexistent
• Easily understandable
• Cannot provide high accuracy
Naïve Forecast
3-14
McGraw-Hill/Irwin
Operations Management, Seventh Edition, by William J. Stevenson
Copyright © 2002 by The McGraw-Hill Companies, Inc. All rights reserved.
Forecasting
NAÏVE METHOD
• No smoothing of data
Period 1 2 3 4 5 6 7 8 Average
Demand 74 86 88
Forecast 98 90
change 12 2
3-15
McGraw-Hill/Irwin
Operations Management, Seventh Edition, by William J. Stevenson
Copyright © 2002 by The McGraw-Hill Companies, Inc. All rights reserved.
Forecasting
Techniques for Averaging
• Moving average
• Weighted moving average
• Exponential smoothing
3-16
McGraw-Hill/Irwin
Operations Management, Seventh Edition, by William J. Stevenson
Copyright © 2002 by The McGraw-Hill Companies, Inc. All rights reserved.
Forecasting
Simple Moving Average
• Smoothes out randomness by averaging positive and
negative random elements over several periods
• n - number of periods (this example uses 4)
Period 1 2 3 4 5 6 7
Demand 74 90 100 60 80 90
Forecast 81 82.5 82.5
3-17
McGraw-Hill/Irwin
Operations Management, Seventh Edition, by William J. Stevenson
Copyright © 2002 by The McGraw-Hill Companies, Inc. All rights reserved.
Forecasting
Points to Know on Moving Averages
• Pro: Easy to compute and understand
• Con: All data points were created equal….
…. Weighted Moving Average
3-18
McGraw-Hill/Irwin
Operations Management, Seventh Edition, by William J. Stevenson
Copyright © 2002 by The McGraw-Hill Companies, Inc. All rights reserved.
Forecasting
Weighted Moving Average
• Similar to a moving average methods except that it
assigns more weight to the most recent values in a time
series.
• n -- number of periods
ai – weight applied to period t-i+1
1 2 3
Alpha
Period 1 2 3 4 5 6 7 8 Average
Demand 46 48 47 23 40
Forecast 32.70 35.60






 a

t
1
n
t
i
i
1
i
t
1
t A
F
0.6 0.3 0.1
3-19
McGraw-Hill/Irwin
Operations Management, Seventh Edition, by William J. Stevenson
Copyright © 2002 by The McGraw-Hill Companies, Inc. All rights reserved.
Forecasting
Exponential Smoothing
• Simpler equation, equivalent to WMA
a – exponential smoothing parameter (0< a<1)
• )
( 1
1
1 

 

 t
t
t
t F
A
F
F a
a 0.1
Period 1 2 3 4 5 6 7 8 Average
Demand 74 90 100 60
Forecast 72 72.2 73.98
3-20
McGraw-Hill/Irwin
Operations Management, Seventh Edition, by William J. Stevenson
Copyright © 2002 by The McGraw-Hill Companies, Inc. All rights reserved.
Forecasting
F2 = 37 + (0.30)(37-37)
= 37
F3 =37+ (0.30)(40-37)
= 37.9
Exponential Smoothing (α=0.30)
PERIOD MONTH DEMAND
1 Jan 37
2 Feb 40
3 Mar 41
4 Apr 37
5 May 45
6 Jun 50
7 Jul 43
8 Aug 47
9 Sep 56
10 Oct 52
11 Nov 55
12 Dec 54
)
( 1
1
1 

 

 t
t
t
t F
A
F
F a
3-21
McGraw-Hill/Irwin
Operations Management, Seventh Edition, by William J. Stevenson
Copyright © 2002 by The McGraw-Hill Companies, Inc. All rights reserved.
Forecasting
FORECAST, Ft + 1
PERIOD MONTH DEMAND (a = 0.3) (a = 0.5)
1 Jan 37 – –
2 Feb 40 37.00 37.00
3 Mar 41 37.90 38.50
4 Apr 37 38.83 39.75
5 May 45 38.28 38.37
6 Jun 50 40.29 41.68
7 Jul 43 43.20 45.84
8 Aug 47 43.14 44.42
9 Sep 56 44.30 45.71
10 Oct 52 47.81 50.85
11 Nov 55 49.06 51.42
12 Dec 54 50.84 53.21
13 Jan – 51.79 53.61
Exponential Smoothing (cont.)
3-22
McGraw-Hill/Irwin
Operations Management, Seventh Edition, by William J. Stevenson
Copyright © 2002 by The McGraw-Hill Companies, Inc. All rights reserved.
Forecasting
Linear Trend Equation
• b is the line slope.
Yt = a + bt
0 1 2 3 4 5 t
Y
a
3-23
McGraw-Hill/Irwin
Operations Management, Seventh Edition, by William J. Stevenson
Copyright © 2002 by The McGraw-Hill Companies, Inc. All rights reserved.
Forecasting
Calculating a and b
b =
n (ty) - t y
n t2 - ( t)2
a =
y - b t
n







Yes… Linear Regression!!
3-24
McGraw-Hill/Irwin
Operations Management, Seventh Edition, by William J. Stevenson
Copyright © 2002 by The McGraw-Hill Companies, Inc. All rights reserved.
Forecasting
Linear Trend Equation Example
t y
Week t2
Sales ty
1 1 150 150
2 4 157 314
3 9 162 486
4 16 166 664
5 25 177 885
 t = 15 t2
= 55  y = 812  ty = 2499
(t)2
= 225
3-25
McGraw-Hill/Irwin
Operations Management, Seventh Edition, by William J. Stevenson
Copyright © 2002 by The McGraw-Hill Companies, Inc. All rights reserved.
Forecasting
Linear Trend Calculation
y = 143.5 + 6.3t
a =
812 - 6.3(15)
5
=
b =
5 (2499) - 15(812)
5(55) - 225
=
12495-12180
275-225
= 6.3
143.5
Look on page 85
3-26
McGraw-Hill/Irwin
Operations Management, Seventh Edition, by William J. Stevenson
Copyright © 2002 by The McGraw-Hill Companies, Inc. All rights reserved.
Forecasting
Disadvantage of simple linear regression
1-apply only to linear relationship with an
independent variable.
2-one needs a considerable amount of data to
establish the relationship ( at least 20).
3-all observations are weighted equally
3-27
McGraw-Hill/Irwin
Operations Management, Seventh Edition, by William J. Stevenson
Copyright © 2002 by The McGraw-Hill Companies, Inc. All rights reserved.
Forecasting
Forecast Accuracy
• Forecast error
– difference between forecast and actual demand
– MAD
• mean absolute deviation
– MAPD
• mean absolute percent deviation
– Cumulative error
– Average error or bias
3-28
McGraw-Hill/Irwin
Operations Management, Seventh Edition, by William J. Stevenson
Copyright © 2002 by The McGraw-Hill Companies, Inc. All rights reserved.
Forecasting
Mean Absolute Deviation (MAD)
where
t = period number
At = demand in period t
Ft = forecast for period t
n = total number of periods
 = absolute value
 At - Ft 
n
MAD =
3-29
McGraw-Hill/Irwin
Operations Management, Seventh Edition, by William J. Stevenson
Copyright © 2002 by The McGraw-Hill Companies, Inc. All rights reserved.
Forecasting
MAD Example
1 37 37.00 – –
2 40 37.00 3.00 3.00
3 41 37.90 3.10 3.10
4 37 38.83 -1.83 1.83
5 45 38.28 6.72 6.72
6 50 40.29 9.69 9.69
7 43 43.20 -0.20 0.20
8 47 43.14 3.86 3.86
9 56 44.30 11.70 11.70
10 52 47.81 4.19 4.19
11 55 49.06 5.94 5.94
12 54 50.84 3.15 3.15
557 49.31 53.39
PERIOD DEMAND, At Ft (a =0.3) (At - Ft) |At - Ft|
 At - Ft 
n
MAD =
=
= 4.85
53.39
11
3-30
McGraw-Hill/Irwin
Operations Management, Seventh Edition, by William J. Stevenson
Copyright © 2002 by The McGraw-Hill Companies, Inc. All rights reserved.
Forecasting
Other Accuracy Measures
Mean absolute percent deviation (MAPD)
MAPD =
|At - Ft|
At
Cumulative error
E = et
Average error
(E )=
et
n
3-31
McGraw-Hill/Irwin
Operations Management, Seventh Edition, by William J. Stevenson
Copyright © 2002 by The McGraw-Hill Companies, Inc. All rights reserved.
Forecasting
Sources of forecast errors
• The model may be inadequate.
• Irregular variation may be occur.
• The forecasting technique may be used
incorrectly or the results misinterpreted.
• There are always random variation in the
data.
3-32
McGraw-Hill/Irwin
Operations Management, Seventh Edition, by William J. Stevenson
Copyright © 2002 by The McGraw-Hill Companies, Inc. All rights reserved.
Forecasting
End Notes
• The two most important factors in choosing
a forecasting technique:
– Cost
– Accuracy
• Keep it SIMPLE!

Chapter 3 forecasting.ppt

  • 1.
    3-1 McGraw-Hill/Irwin Operations Management, SeventhEdition, by William J. Stevenson Copyright © 2002 by The McGraw-Hill Companies, Inc. All rights reserved. Forecasting Chapter 3 Forecasting
  • 2.
    3-2 McGraw-Hill/Irwin Operations Management, SeventhEdition, by William J. Stevenson Copyright © 2002 by The McGraw-Hill Companies, Inc. All rights reserved. Forecasting FORECAST: • A statement about the future • Used to help managers – Plan the system – Plan the use of the system
  • 3.
    3-3 McGraw-Hill/Irwin Operations Management, SeventhEdition, by William J. Stevenson Copyright © 2002 by The McGraw-Hill Companies, Inc. All rights reserved. Forecasting Forecast Uses • Plan the system – Generally involves long-range plans related to: • Types of products and services to offer • Facility and equipment levels • Facility location • Plan the use of the system – Generally involves short- and medium-range plans related to: • Inventory management • Workforce levels • Purchasing • Budgeting
  • 4.
    3-4 McGraw-Hill/Irwin Operations Management, SeventhEdition, by William J. Stevenson Copyright © 2002 by The McGraw-Hill Companies, Inc. All rights reserved. Forecasting • Assumes causal system past ==> future • Forecasts rarely perfect because of randomness • Forecasts more accurate for groups vs. individuals • Forecast accuracy decreases as time horizon increases I see that you will get an A this quarter. Common Features
  • 5.
    3-5 McGraw-Hill/Irwin Operations Management, SeventhEdition, by William J. Stevenson Copyright © 2002 by The McGraw-Hill Companies, Inc. All rights reserved. Forecasting Elements of a Good Forecast Timely Accurate Reliable Written
  • 6.
    3-6 McGraw-Hill/Irwin Operations Management, SeventhEdition, by William J. Stevenson Copyright © 2002 by The McGraw-Hill Companies, Inc. All rights reserved. Forecasting Steps in the Forecasting Process Step 1 Determine purpose of forecast Step 2 Establish a time horizon Step 3 Select a forecasting technique Step 4 Gather and analyze data Step 5 Make the forecast Step 6 Monitor the forecast “The forecast”
  • 7.
    3-7 McGraw-Hill/Irwin Operations Management, SeventhEdition, by William J. Stevenson Copyright © 2002 by The McGraw-Hill Companies, Inc. All rights reserved. Forecasting Types of Forecasts • Judgmental - uses subjective inputs (qualitative) • Time series - uses historical data assuming the future will be like the past (quantitative) • Associative models - uses explanatory variables to predict the future
  • 8.
    3-8 McGraw-Hill/Irwin Operations Management, SeventhEdition, by William J. Stevenson Copyright © 2002 by The McGraw-Hill Companies, Inc. All rights reserved. Forecasting Judgmental Forecasts (Qualitative) •Consumer surveys •Delphi method •Executive opinions – Opinions of managers and staff •Sales force.
  • 9.
    3-9 McGraw-Hill/Irwin Operations Management, SeventhEdition, by William J. Stevenson Copyright © 2002 by The McGraw-Hill Companies, Inc. All rights reserved. Forecasting
  • 10.
    3-10 McGraw-Hill/Irwin Operations Management, SeventhEdition, by William J. Stevenson Copyright © 2002 by The McGraw-Hill Companies, Inc. All rights reserved. Forecasting Time Series Forecasts (Quantitative) • Trend - long-term movement in data • Seasonality - short-term regular variations in data • Irregular variations - caused by unusual circumstances • Random variations - caused by chance • CYCLE- wave like variations lasting more than one year
  • 11.
    3-11 McGraw-Hill/Irwin Operations Management, SeventhEdition, by William J. Stevenson Copyright © 2002 by The McGraw-Hill Companies, Inc. All rights reserved. Forecasting Forecast Variations Trend Irregular variation Cycles Seasonal variations 90 89 88 Figure 3-1 cycle
  • 12.
    3-12 McGraw-Hill/Irwin Operations Management, SeventhEdition, by William J. Stevenson Copyright © 2002 by The McGraw-Hill Companies, Inc. All rights reserved. Forecasting The Forecast of Forecasts • Naïve • Simple Moving Average • Weighted Moving Average • Exponential Smoothing • ES with Trend and Seasonality
  • 13.
    3-13 McGraw-Hill/Irwin Operations Management, SeventhEdition, by William J. Stevenson Copyright © 2002 by The McGraw-Hill Companies, Inc. All rights reserved. Forecasting • Simple to use • Virtually no cost • Data analysis is nonexistent • Easily understandable • Cannot provide high accuracy Naïve Forecast
  • 14.
    3-14 McGraw-Hill/Irwin Operations Management, SeventhEdition, by William J. Stevenson Copyright © 2002 by The McGraw-Hill Companies, Inc. All rights reserved. Forecasting NAÏVE METHOD • No smoothing of data Period 1 2 3 4 5 6 7 8 Average Demand 74 86 88 Forecast 98 90 change 12 2
  • 15.
    3-15 McGraw-Hill/Irwin Operations Management, SeventhEdition, by William J. Stevenson Copyright © 2002 by The McGraw-Hill Companies, Inc. All rights reserved. Forecasting Techniques for Averaging • Moving average • Weighted moving average • Exponential smoothing
  • 16.
    3-16 McGraw-Hill/Irwin Operations Management, SeventhEdition, by William J. Stevenson Copyright © 2002 by The McGraw-Hill Companies, Inc. All rights reserved. Forecasting Simple Moving Average • Smoothes out randomness by averaging positive and negative random elements over several periods • n - number of periods (this example uses 4) Period 1 2 3 4 5 6 7 Demand 74 90 100 60 80 90 Forecast 81 82.5 82.5
  • 17.
    3-17 McGraw-Hill/Irwin Operations Management, SeventhEdition, by William J. Stevenson Copyright © 2002 by The McGraw-Hill Companies, Inc. All rights reserved. Forecasting Points to Know on Moving Averages • Pro: Easy to compute and understand • Con: All data points were created equal…. …. Weighted Moving Average
  • 18.
    3-18 McGraw-Hill/Irwin Operations Management, SeventhEdition, by William J. Stevenson Copyright © 2002 by The McGraw-Hill Companies, Inc. All rights reserved. Forecasting Weighted Moving Average • Similar to a moving average methods except that it assigns more weight to the most recent values in a time series. • n -- number of periods ai – weight applied to period t-i+1 1 2 3 Alpha Period 1 2 3 4 5 6 7 8 Average Demand 46 48 47 23 40 Forecast 32.70 35.60        a  t 1 n t i i 1 i t 1 t A F 0.6 0.3 0.1
  • 19.
    3-19 McGraw-Hill/Irwin Operations Management, SeventhEdition, by William J. Stevenson Copyright © 2002 by The McGraw-Hill Companies, Inc. All rights reserved. Forecasting Exponential Smoothing • Simpler equation, equivalent to WMA a – exponential smoothing parameter (0< a<1) • ) ( 1 1 1       t t t t F A F F a a 0.1 Period 1 2 3 4 5 6 7 8 Average Demand 74 90 100 60 Forecast 72 72.2 73.98
  • 20.
    3-20 McGraw-Hill/Irwin Operations Management, SeventhEdition, by William J. Stevenson Copyright © 2002 by The McGraw-Hill Companies, Inc. All rights reserved. Forecasting F2 = 37 + (0.30)(37-37) = 37 F3 =37+ (0.30)(40-37) = 37.9 Exponential Smoothing (α=0.30) PERIOD MONTH DEMAND 1 Jan 37 2 Feb 40 3 Mar 41 4 Apr 37 5 May 45 6 Jun 50 7 Jul 43 8 Aug 47 9 Sep 56 10 Oct 52 11 Nov 55 12 Dec 54 ) ( 1 1 1       t t t t F A F F a
  • 21.
    3-21 McGraw-Hill/Irwin Operations Management, SeventhEdition, by William J. Stevenson Copyright © 2002 by The McGraw-Hill Companies, Inc. All rights reserved. Forecasting FORECAST, Ft + 1 PERIOD MONTH DEMAND (a = 0.3) (a = 0.5) 1 Jan 37 – – 2 Feb 40 37.00 37.00 3 Mar 41 37.90 38.50 4 Apr 37 38.83 39.75 5 May 45 38.28 38.37 6 Jun 50 40.29 41.68 7 Jul 43 43.20 45.84 8 Aug 47 43.14 44.42 9 Sep 56 44.30 45.71 10 Oct 52 47.81 50.85 11 Nov 55 49.06 51.42 12 Dec 54 50.84 53.21 13 Jan – 51.79 53.61 Exponential Smoothing (cont.)
  • 22.
    3-22 McGraw-Hill/Irwin Operations Management, SeventhEdition, by William J. Stevenson Copyright © 2002 by The McGraw-Hill Companies, Inc. All rights reserved. Forecasting Linear Trend Equation • b is the line slope. Yt = a + bt 0 1 2 3 4 5 t Y a
  • 23.
    3-23 McGraw-Hill/Irwin Operations Management, SeventhEdition, by William J. Stevenson Copyright © 2002 by The McGraw-Hill Companies, Inc. All rights reserved. Forecasting Calculating a and b b = n (ty) - t y n t2 - ( t)2 a = y - b t n        Yes… Linear Regression!!
  • 24.
    3-24 McGraw-Hill/Irwin Operations Management, SeventhEdition, by William J. Stevenson Copyright © 2002 by The McGraw-Hill Companies, Inc. All rights reserved. Forecasting Linear Trend Equation Example t y Week t2 Sales ty 1 1 150 150 2 4 157 314 3 9 162 486 4 16 166 664 5 25 177 885  t = 15 t2 = 55  y = 812  ty = 2499 (t)2 = 225
  • 25.
    3-25 McGraw-Hill/Irwin Operations Management, SeventhEdition, by William J. Stevenson Copyright © 2002 by The McGraw-Hill Companies, Inc. All rights reserved. Forecasting Linear Trend Calculation y = 143.5 + 6.3t a = 812 - 6.3(15) 5 = b = 5 (2499) - 15(812) 5(55) - 225 = 12495-12180 275-225 = 6.3 143.5 Look on page 85
  • 26.
    3-26 McGraw-Hill/Irwin Operations Management, SeventhEdition, by William J. Stevenson Copyright © 2002 by The McGraw-Hill Companies, Inc. All rights reserved. Forecasting Disadvantage of simple linear regression 1-apply only to linear relationship with an independent variable. 2-one needs a considerable amount of data to establish the relationship ( at least 20). 3-all observations are weighted equally
  • 27.
    3-27 McGraw-Hill/Irwin Operations Management, SeventhEdition, by William J. Stevenson Copyright © 2002 by The McGraw-Hill Companies, Inc. All rights reserved. Forecasting Forecast Accuracy • Forecast error – difference between forecast and actual demand – MAD • mean absolute deviation – MAPD • mean absolute percent deviation – Cumulative error – Average error or bias
  • 28.
    3-28 McGraw-Hill/Irwin Operations Management, SeventhEdition, by William J. Stevenson Copyright © 2002 by The McGraw-Hill Companies, Inc. All rights reserved. Forecasting Mean Absolute Deviation (MAD) where t = period number At = demand in period t Ft = forecast for period t n = total number of periods  = absolute value  At - Ft  n MAD =
  • 29.
    3-29 McGraw-Hill/Irwin Operations Management, SeventhEdition, by William J. Stevenson Copyright © 2002 by The McGraw-Hill Companies, Inc. All rights reserved. Forecasting MAD Example 1 37 37.00 – – 2 40 37.00 3.00 3.00 3 41 37.90 3.10 3.10 4 37 38.83 -1.83 1.83 5 45 38.28 6.72 6.72 6 50 40.29 9.69 9.69 7 43 43.20 -0.20 0.20 8 47 43.14 3.86 3.86 9 56 44.30 11.70 11.70 10 52 47.81 4.19 4.19 11 55 49.06 5.94 5.94 12 54 50.84 3.15 3.15 557 49.31 53.39 PERIOD DEMAND, At Ft (a =0.3) (At - Ft) |At - Ft|  At - Ft  n MAD = = = 4.85 53.39 11
  • 30.
    3-30 McGraw-Hill/Irwin Operations Management, SeventhEdition, by William J. Stevenson Copyright © 2002 by The McGraw-Hill Companies, Inc. All rights reserved. Forecasting Other Accuracy Measures Mean absolute percent deviation (MAPD) MAPD = |At - Ft| At Cumulative error E = et Average error (E )= et n
  • 31.
    3-31 McGraw-Hill/Irwin Operations Management, SeventhEdition, by William J. Stevenson Copyright © 2002 by The McGraw-Hill Companies, Inc. All rights reserved. Forecasting Sources of forecast errors • The model may be inadequate. • Irregular variation may be occur. • The forecasting technique may be used incorrectly or the results misinterpreted. • There are always random variation in the data.
  • 32.
    3-32 McGraw-Hill/Irwin Operations Management, SeventhEdition, by William J. Stevenson Copyright © 2002 by The McGraw-Hill Companies, Inc. All rights reserved. Forecasting End Notes • The two most important factors in choosing a forecasting technique: – Cost – Accuracy • Keep it SIMPLE!