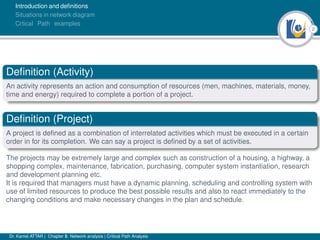
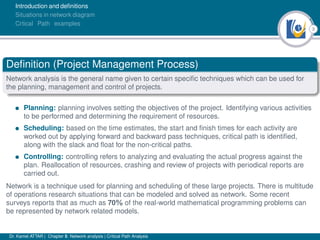
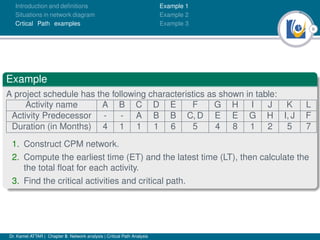
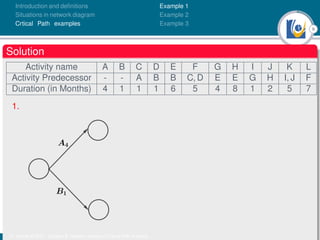
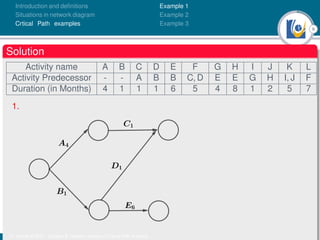
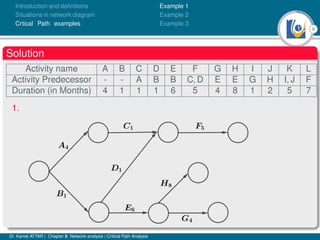
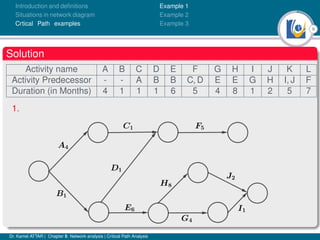
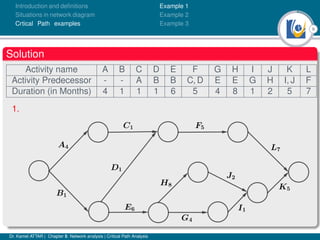
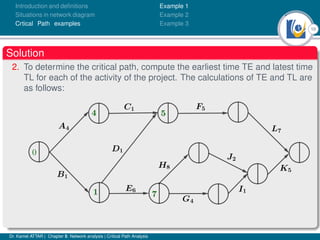
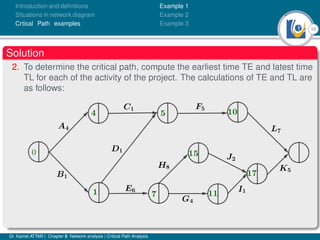
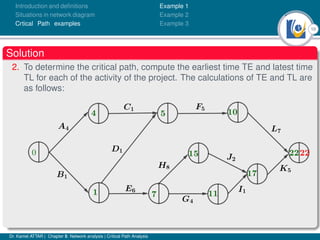
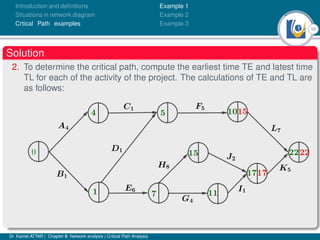
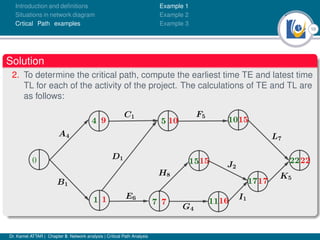
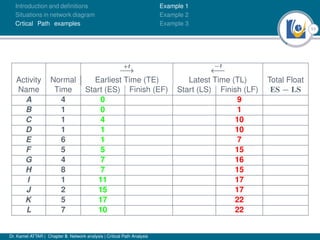
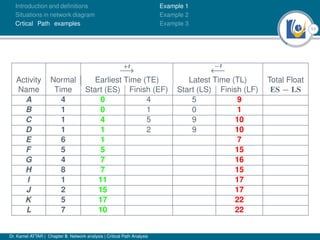
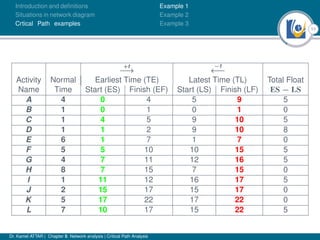
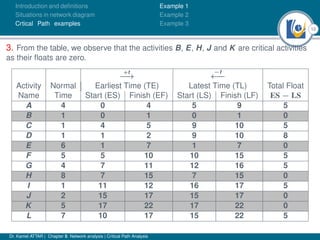
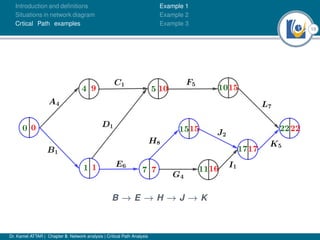
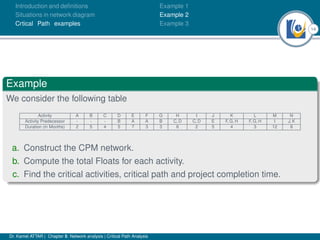
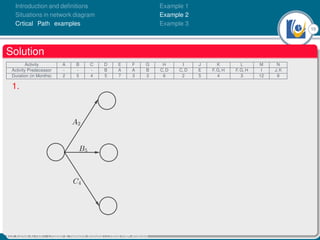
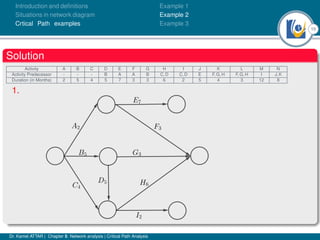
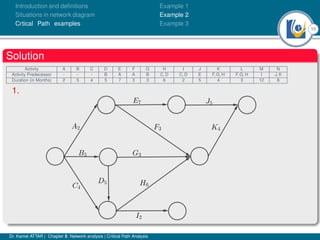
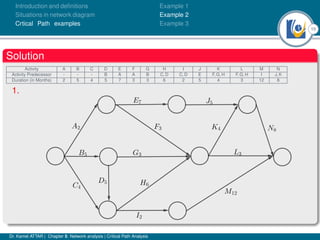
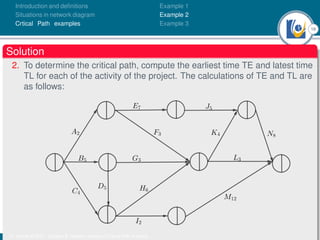
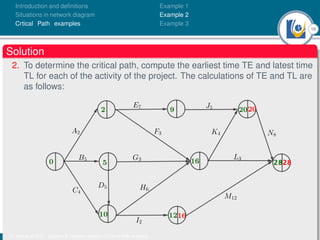
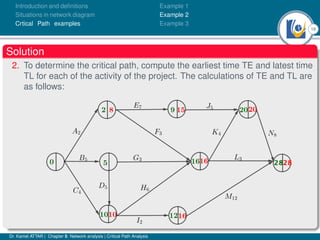
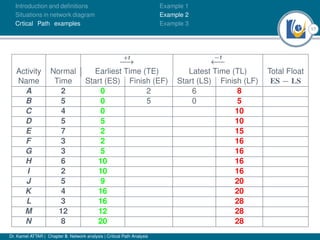
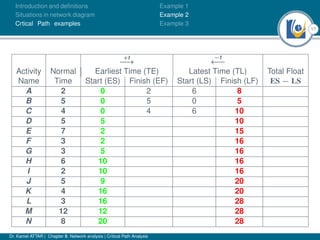
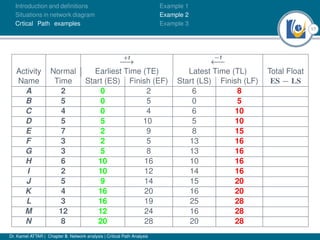
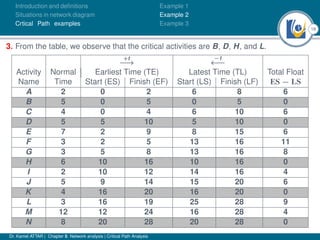
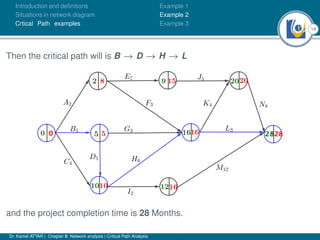
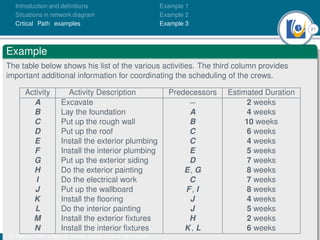
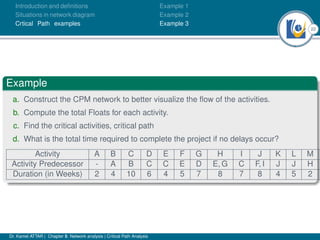
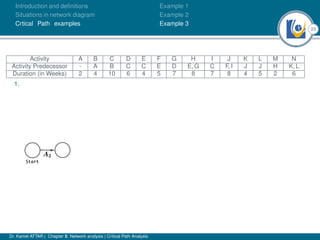
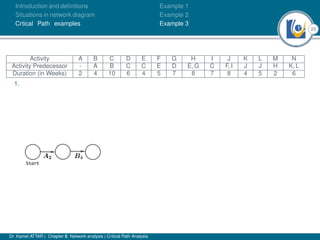
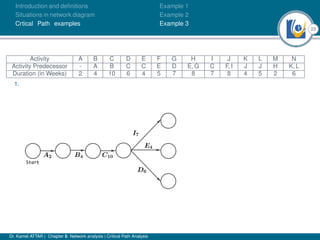
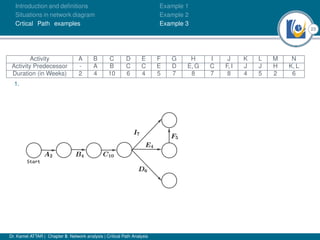
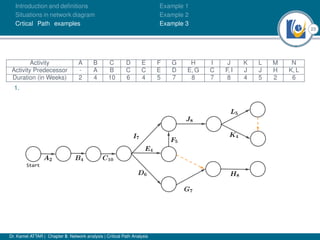
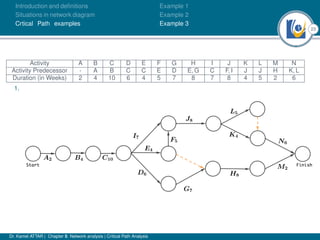
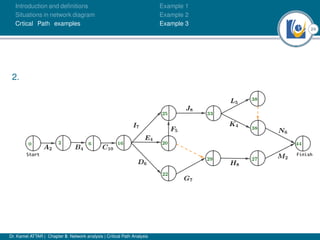
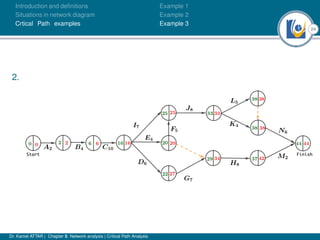
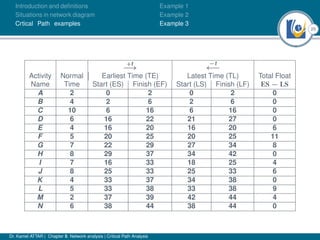
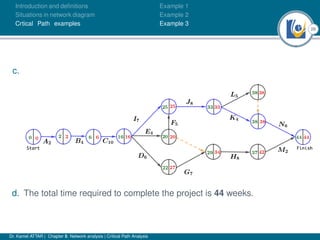
Faculty of Economics and Business Administration
Lebanese University
Chapter 5: Network analysis
Critical Path Analysis
Dr. Kamel ATTAR
attar.kamel@gmail.com
! 2020 !
1
Introduction and definitions
Situations in network diagram
Crtical Path examples
1 Introduction and definitions
2 Situations in network diagram
3 Crtical Path examples
Example 1
Example 2
Example 3
Dr. Kamel ATTAR | Chapter 5: Network analysis | Critical Path Analysis
2
Introduction and definitions
Situations in network diagram
Crtical Path examples
Definition (Activity)
An activity represents an action and consumption of resources (men, machines, materials, money,
time and energy) required to complete a portion of a project.
Definition (Project)
A project is defined as a combination of interrelated activities which must be executed in a certain
order in for its completion. We can say a project is defined by a set of activities.
The projects may be extremely large and complex such as construction of a housing, a highway, a
shopping complex, maintenance, fabrication, purchasing, computer system instantiation, research
and development planning etc.
It is required that managers must have a dynamic planning, scheduling and controlling system with
use of limited resources to produce the best possible results and also to react immediately to the
changing conditions and make necessary changes in the plan and schedule.
Dr. Kamel ATTAR | Chapter 5: Network analysis | Critical Path Analysis
3
Introduction and definitions
Situations in network diagram
Crtical Path examples
Definition (Project Management Process)
Network analysis is the general name given to certain specific techniques which can be used for
the planning, management and control of projects.
• Planning: planning involves setting the objectives of the project. Identifying various activities
to be performed and determining the requirement of resources.
• Scheduling: based on the time estimates, the start and finish times for each activity are
worked out by applying forward and backward pass techniques, critical path is identified,
along with the slack and float for the non-critical paths.
• Controlling: controlling refers to analyzing and evaluating the actual progress against the
plan. Reallocation of resources, crashing and review of projects with periodical reports are
carried out.
Network is a technique used for planning and scheduling of these large projects. There is multitude
of operations research situations that can be modeled and solved as network. Some recent
surveys reports that as much as 70% of the real-world mathematical programming problems can
be represented by network related models.
Dr. Kamel ATTAR | Chapter 5: Network analysis | Critical Path Analysis
4
Introduction and definitions
Situations in network diagram
Crtical Path examples
Definition (Network)
It is a graphical representation of logical and sequentially connected activities and events of a
project. Network is also called arrow diagram.
Network analysis is known by many names
• PERT (Program Evaluation and Review Technique) developed during 1950’s. the technique
was developed and used in conjunction with the planning and designing of the Polaris missile
project.
• CPM (Critical Path Method), which was developed by DuPont company and applied first to
the construction projects in the chemical industry.
• PEP (Program Evaluation Procedure),
• LCES (Least Cost Estimating and Scheduling),
• SCANS (Scheduling and Control by Automated Network System), etc
We will present the two most widely applied algorithms PERT and CPM. These techniques are
used in project management to help the manager answer questions like:
• When will the project be finished?
• When is each individual part of the project scheduled start and finish?
• Which activities must be finished on time to avoid making the entire project late?
• Is it possible to shift resources to critical parts from other numerical parts without affecting the
overall completion time?
Dr. Kamel ATTAR | Chapter 5: Network analysis | Critical Path Analysis
5
Introduction and definitions
Situations in network diagram
Crtical Path examples
Each activity is represented by an arrow. An event (or node) will always occur at the beginning and
end of an activity. The event has no resources and is represented by a circle. The ith event and jth
event are the tail event and head event respectively.
Activities are usually classified into four categories:
• Concurrent activities: activities operate or occur at the same time
• Predecessors activities: activities that must be completed before the activity can start.
• Successors activities: activities can start when the activity complete.
• Dummy activities: it indicates only precedence relationships and does not require any time
of effort.
Dr. Kamel ATTAR | Chapter 5: Network analysis | Critical Path Analysis
6
Introduction and definitions
Situations in network diagram
Crtical Path examples
Concurrent activities:
One or more activities can start and end si-
multaneously at an event
Predecessors and Successors Activities:
Activities performed before given events are known as Predecessors activities
Activities performed after given events are known as Successors activities
• A must finish before either B or C can
start.
• Both D and E must finish before F can
start.
• Both A and B must finish before either of C or D can start.
Dr. Kamel ATTAR | Chapter 5: Network analysis | Critical Path Analysis
7
Introduction and definitions
Situations in network diagram
Crtical Path examples
Dummy Activity: An imaginary activity which does not consume any resource and time is called a
dummy activity. Dummy activities are simply used to represent a connection between events in
order to maintain a logic in the network. It is represented by a dotted line in a network.
• Both A must finish before either B or C can start.
• C must finish before D can start.
• C and B must finish before F can start.
Errors to be Avoided in constructing a network:
Two activities starting from a tail event must not have a same en
event. To ensure this, it is absolutely necessary to introduce a
dummy activity, as shown in the figure
Looping error should not be formed in a network, as it represents
performance of activities repeatedly in a cyclic manner, as show in
the figure.
In a network, there should be only one start event and one ending event.
The direction of arrows should flow from left to right avoiding mixing of direction.
Dr. Kamel ATTAR | Chapter 5: Network analysis | Critical Path Analysis
8
Introduction and definitions
Situations in network diagram
Crtical Path examples
Example 1
Example 2
Example 3
Example
A project schedule has the following characteristics as shown in table:
Activity name A B C D E F G H I J K L
Activity Predecessor - - A B B C, D E E G H I, J F
Duration (in Months) 4 1 1 1 6 5 4 8 1 2 5 7
1. Construct CPM network.
2. Compute the earliest time (ET) and the latest time (LT), then calculate the
the total float for each activity.
3. Find the critical activities and critical path.
Dr. Kamel ATTAR | Chapter 5: Network analysis | Critical Path Analysis
9
Introduction and definitions
Situations in network diagram
Crtical Path examples
Example 1
Example 2
Example 3
Solution
Activity name A B C D E F G H I J K L
Activity Predecessor - - A B B C, D E E G H I, J F
Duration (in Months) 4 1 1 1 6 5 4 8 1 2 5 7
1.
Dr. Kamel ATTAR | Chapter 5: Network analysis | Critical Path Analysis
10
Introduction and definitions
Situations in network diagram
Crtical Path examples
Example 1
Example 2
Example 3
Solution
2. To determine the critical path, compute the earliest time TE and latest time
TL for each of the activity of the project. The calculations of TE and TL are
as follows:
Dr. Kamel ATTAR | Chapter 5: Network analysis | Critical Path Analysis
11
Introduction and definitions
Situations in network diagram
Crtical Path examples
Example 1
Example 2
Example 3
+t
−→
−t
←−
Activity Normal Earliest Time (TE) Latest Time (TL) Total Float
Name Time Start (ES) Finish (EF) Start (LS) Finish (LF) ES − LS
A 4 0 9
B 1 0 1
C 1 4 10
D 1 1 10
E 6 1 7
F 5 5 15
G 4 7 16
H 8 7 15
I 1 11 17
J 2 15 17
K 5 17 22
L 7 10 22
Dr. Kamel ATTAR | Chapter 5: Network analysis | Critical Path Analysis
11
Introduction and definitions
Situations in network diagram
Crtical Path examples
Example 1
Example 2
Example 3
+t
−→
−t
←−
Activity Normal Earliest Time (TE) Latest Time (TL) Total Float
Name Time Start (ES) Finish (EF) Start (LS) Finish (LF) ES − LS
A 4 0 4 5 9
B 1 0 1 0 1
C 1 4 5 9 10
D 1 1 2 9 10
E 6 1 7 1 7
F 5 5 10 10 15
G 4 7 11 12 16
H 8 7 15 7 15
I 1 11 12 16 17
J 2 15 17 15 17
K 5 17 22 17 22
L 7 10 17 15 22
Dr. Kamel ATTAR | Chapter 5: Network analysis | Critical Path Analysis
11
Introduction and definitions
Situations in network diagram
Crtical Path examples
Example 1
Example 2
Example 3
+t
−→
−t
←−
Activity Normal Earliest Time (TE) Latest Time (TL) Total Float
Name Time Start (ES) Finish (EF) Start (LS) Finish (LF) ES − LS
A 4 0 4 5 9 5
B 1 0 1 0 1 0
C 1 4 5 9 10 5
D 1 1 2 9 10 8
E 6 1 7 1 7 0
F 5 5 10 10 15 5
G 4 7 11 12 16 5
H 8 7 15 7 15 0
I 1 11 12 16 17 5
J 2 15 17 15 17 0
K 5 17 22 17 22 0
L 7 10 17 15 22 5
Dr. Kamel ATTAR | Chapter 5: Network analysis | Critical Path Analysis
12
Introduction and definitions
Situations in network diagram
Crtical Path examples
Example 1
Example 2
Example 3
3. From the table, we observe that the activities B, E, H, J and K are critical activities
as their floats are zero.
+t
−→
−t
←−
Activity Normal Earliest Time (TE) Latest Time (TL) Total Float
Name Time Start (ES) Finish (EF) Start (LS) Finish (LF) ES − LS
A 4 0 4 5 9 5
B 1 0 1 0 1 0
C 1 4 5 9 10 5
D 1 1 2 9 10 8
E 6 1 7 1 7 0
F 5 5 10 10 15 5
G 4 7 11 12 16 5
H 8 7 15 7 15 0
I 1 11 12 16 17 5
J 2 15 17 15 17 0
K 5 17 22 17 22 0
L 7 10 17 15 22 5
Dr. Kamel ATTAR | Chapter 5: Network analysis | Critical Path Analysis
13
Introduction and definitions
Situations in network diagram
Crtical Path examples
Example 1
Example 2
Example 3
B → E → H → J → K
Dr. Kamel ATTAR | Chapter 5: Network analysis | Critical Path Analysis
14
Introduction and definitions
Situations in network diagram
Crtical Path examples
Example 1
Example 2
Example 3
Example
We consider the following table
Activity A B C D E F G H I J K L M N
Activity Predecessor - - - B A A B C, D C, D E F, G, H F, G, H I J, K
Duration (in Months) 2 5 4 5 7 3 3 6 2 5 4 3 12 8
a. Construct the CPM network.
b. Compute the total Floats for each activity.
c. Find the critical activities, critical path and project completion time.
Dr. Kamel ATTAR | Chapter 5: Network analysis | Critical Path Analysis
15
Introduction and definitions
Situations in network diagram
Crtical Path examples
Example 1
Example 2
Example 3
Solution
Activity A B C D E F G H I J K L M N
Activity Predecessor - - - B A A B C, D C, D E F, G, H F, G, H I J, K
Duration (in Months) 2 5 4 5 7 3 3 6 2 5 4 3 12 8
1.
Dr. Kamel ATTAR | Chapter 5: Network analysis | Critical Path Analysis
16
Introduction and definitions
Situations in network diagram
Crtical Path examples
Example 1
Example 2
Example 3
Solution
2. To determine the critical path, compute the earliest time TE and latest time
TL for each of the activity of the project. The calculations of TE and TL are
as follows:
Dr. Kamel ATTAR | Chapter 5: Network analysis | Critical Path Analysis
17
Introduction and definitions
Situations in network diagram
Crtical Path examples
Example 1
Example 2
Example 3
+t
−→
−t
←−
Activity Normal Earliest Time (TE) Latest Time (TL) Total Float
Name Time Start (ES) Finish (EF) Start (LS) Finish (LF) ES − LS
A 2 0 8
B 5 0 5
C 4 0 10
D 5 5 10
E 7 2 15
F 3 2 16
G 3 5 16
H 6 10 16
I 2 10 16
J 5 9 20
K 4 16 20
L 3 16 28
M 12 12 28
N 8 20 28
Dr. Kamel ATTAR | Chapter 5: Network analysis | Critical Path Analysis
17
Introduction and definitions
Situations in network diagram
Crtical Path examples
Example 1
Example 2
Example 3
+t
−→
−t
←−
Activity Normal Earliest Time (TE) Latest Time (TL) Total Float
Name Time Start (ES) Finish (EF) Start (LS) Finish (LF) ES − LS
A 2 0 2 6 8
B 5 0 5 0 5
C 4 0 4 6 10
D 5 5 10 5 10
E 7 2 9 8 15
F 3 2 5 13 16
G 3 5 8 13 16
H 6 10 16 10 16
I 2 10 12 14 16
J 5 9 14 15 20
K 4 16 20 16 20
L 3 16 19 25 28
M 12 12 24 16 28
N 8 20 28 20 28
Dr. Kamel ATTAR | Chapter 5: Network analysis | Critical Path Analysis
17
Introduction and definitions
Situations in network diagram
Crtical Path examples
Example 1
Example 2
Example 3
+t
−→
−t
←−
Activity Normal Earliest Time (TE) Latest Time (TL) Total Float
Name Time Start (ES) Finish (EF) Start (LS) Finish (LF) ES − LS
A 2 0 2 6 8 6
B 5 0 5 0 5 0
C 4 0 4 6 10 6
D 5 5 10 5 10 0
E 7 2 9 8 15 6
F 3 2 5 13 16 11
G 3 5 8 13 16 8
H 6 10 16 10 16 0
I 2 10 12 14 16 4
J 5 9 14 15 20 6
K 4 16 20 16 20 0
L 3 16 19 25 28 9
M 12 12 24 16 28 4
N 8 20 28 20 28 0
Dr. Kamel ATTAR | Chapter 5: Network analysis | Critical Path Analysis
18
Introduction and definitions
Situations in network diagram
Crtical Path examples
Example 1
Example 2
Example 3
3. From the table, we observe that the critical activities are B, D, H, and L.
+t
−→
−t
←−
Activity Normal Earliest Time (TE) Latest Time (TL) Total Float
Name Time Start (ES) Finish (EF) Start (LS) Finish (LF) ES − LS
A 2 0 2 6 8 6
B 5 0 5 0 5 0
C 4 0 4 6 10 6
D 5 5 10 5 10 0
E 7 2 9 8 15 6
F 3 2 5 13 16 11
G 3 5 8 13 16 8
H 6 10 16 10 16 0
I 2 10 12 14 16 4
J 5 9 14 15 20 6
K 4 16 20 16 20 0
L 3 16 19 25 28 9
M 12 12 24 16 28 4
N 8 20 28 20 28 0
Dr. Kamel ATTAR | Chapter 5: Network analysis | Critical Path Analysis
19
Introduction and definitions
Situations in network diagram
Crtical Path examples
Example 1
Example 2
Example 3
Then the critical path will is B → D → H → L
and the project completion time is 28 Months.
Dr. Kamel ATTAR | Chapter 5: Network analysis | Critical Path Analysis
20
Introduction and definitions
Situations in network diagram
Crtical Path examples
Example 1
Example 2
Example 3
Example
The RELIABLE CONSTRUCTION COMPANY has just made the winning bid of 5.4$
million to construct a new plant for a major manufacturer. The manufacturer needs the
plant to go into operation within a year. Therefore, the contract includes the following
provisions:
• A penalty of 300, 000$ if Reliable has not completed construction by the deadline
47 weeks from now.
• To provide additional incentive for speedy construction, a bonus of 150, 000$ will
be paid to Reliable if the plant is completed within 40 weeks.
Reliable is assigning its best construction manager, kamel ATTAR, to this project to help
ensure that it stays on schedule. He looks forward to the challenge of bringing the
project in on schedule, and perhaps even finishing early. However, since he is doubtful
that it will be feasible to finish within 40 weeks without incurring excessive costs, he has
decided to focus his initial planning on meeting the deadline of 47 weeks. Mr. ATTAR will
need to arrange for a number of crews to perform the various construction activities at
different times.
Dr. Kamel ATTAR | Chapter 5: Network analysis | Critical Path Analysis
21
Introduction and definitions
Situations in network diagram
Crtical Path examples
Example 1
Example 2
Example 3
Example
The table below shows his list of the various activities. The third column provides
important additional information for coordinating the scheduling of the crews.
Activity Activity Description Predecessors Estimated Duration
A Excavate − 2 weeks
B Lay the foundation A 4 weeks
C Put up the rough wall B 10 weeks
D Put up the roof C 6 weeks
E Install the exterior plumbing C 4 weeks
F Install the interior plumbing E 5 weeks
G Put up the exterior siding D 7 weeks
H Do the exterior painting E, G 8 weeks
I Do the electrical work C 7 weeks
J Put up the wallboard F, I 8 weeks
K Install the flooring J 4 weeks
L Do the interior painting J 5 weeks
M Install the exterior fixtures H 2 weeks
N Install the interior fixtures K, L 6 weeks
Dr. Kamel ATTAR | Chapter 5: Network analysis | Critical Path Analysis
22
Introduction and definitions
Situations in network diagram
Crtical Path examples
Example 1
Example 2
Example 3
Example
a. Construct the CPM network to better visualize the flow of the activities.
b. Compute the total Floats for each activity.
c. Find the critical activities, critical path
d. What is the total time required to complete the project if no delays occur?
Activity A B C D E F G H I J K L M
Activity Predecessor - A B C C E D E, G C F, I J J H
Duration (in Weeks) 2 4 10 6 4 5 7 8 7 8 4 5 2
Dr. Kamel ATTAR | Chapter 5: Network analysis | Critical Path Analysis
23
Introduction and definitions
Situations in network diagram
Crtical Path examples
Example 1
Example 2
Example 3
Activity A B C D E F G H I J K L M N
Activity Predecessor - A B C C E D E, G C F, I J J H K, L
Duration (in Weeks) 2 4 10 6 4 5 7 8 7 8 4 5 2 6
1.
Dr. Kamel ATTAR | Chapter 5: Network analysis | Critical Path Analysis
24
Introduction and definitions
Situations in network diagram
Crtical Path examples
Example 1
Example 2
Example 3
2.
Dr. Kamel ATTAR | Chapter 5: Network analysis | Critical Path Analysis
24
Introduction and definitions
Situations in network diagram
Crtical Path examples
Example 1
Example 2
Example 3
2.
Dr. Kamel ATTAR | Chapter 5: Network analysis | Critical Path Analysis
24
Introduction and definitions
Situations in network diagram
Crtical Path examples
Example 1
Example 2
Example 3
2.
Dr. Kamel ATTAR | Chapter 5: Network analysis | Critical Path Analysis
25
Introduction and definitions
Situations in network diagram
Crtical Path examples
Example 1
Example 2
Example 3
+t
−→
−t
←−
Activity Normal Earliest Time (TE) Latest Time (TL) Total Float
Name Time Start (ES) Finish (EF) Start (LS) Finish (LF) ES − LS
A 2 0 2 0 2 0
B 4 2 6 2 6 0
C 10 6 16 6 16 0
D 6 16 22 21 27 0
E 4 16 20 16 20 6
F 5 20 25 20 25 11
G 7 22 29 27 34 8
H 8 29 37 34 42 0
I 7 16 33 18 25 4
J 8 25 33 25 33 6
K 4 33 37 34 38 0
L 5 33 38 33 38 9
M 2 37 39 42 44 4
N 6 38 44 38 44 0
Dr. Kamel ATTAR | Chapter 5: Network analysis | Critical Path Analysis
26
Introduction and definitions
Situations in network diagram
Crtical Path examples
Example 1
Example 2
Example 3
c.
d. The total time required to complete the project is 44 weeks.
Dr. Kamel ATTAR | Chapter 5: Network analysis | Critical Path Analysis
Thank you! Questions?

Operation research-Network analysis (Critical Path Method)

  • 1.
    Faculty of Economicsand Business Administration Lebanese University Chapter 5: Network analysis Critical Path Analysis Dr. Kamel ATTAR attar.kamel@gmail.com ! 2020 !
  • 2.
    1 Introduction and definitions Situationsin network diagram Crtical Path examples 1 Introduction and definitions 2 Situations in network diagram 3 Crtical Path examples Example 1 Example 2 Example 3 Dr. Kamel ATTAR | Chapter 5: Network analysis | Critical Path Analysis
  • 3.
    2 Introduction and definitions Situationsin network diagram Crtical Path examples Definition (Activity) An activity represents an action and consumption of resources (men, machines, materials, money, time and energy) required to complete a portion of a project. Definition (Project) A project is defined as a combination of interrelated activities which must be executed in a certain order in for its completion. We can say a project is defined by a set of activities. The projects may be extremely large and complex such as construction of a housing, a highway, a shopping complex, maintenance, fabrication, purchasing, computer system instantiation, research and development planning etc. It is required that managers must have a dynamic planning, scheduling and controlling system with use of limited resources to produce the best possible results and also to react immediately to the changing conditions and make necessary changes in the plan and schedule. Dr. Kamel ATTAR | Chapter 5: Network analysis | Critical Path Analysis
  • 4.
    3 Introduction and definitions Situationsin network diagram Crtical Path examples Definition (Project Management Process) Network analysis is the general name given to certain specific techniques which can be used for the planning, management and control of projects. • Planning: planning involves setting the objectives of the project. Identifying various activities to be performed and determining the requirement of resources. • Scheduling: based on the time estimates, the start and finish times for each activity are worked out by applying forward and backward pass techniques, critical path is identified, along with the slack and float for the non-critical paths. • Controlling: controlling refers to analyzing and evaluating the actual progress against the plan. Reallocation of resources, crashing and review of projects with periodical reports are carried out. Network is a technique used for planning and scheduling of these large projects. There is multitude of operations research situations that can be modeled and solved as network. Some recent surveys reports that as much as 70% of the real-world mathematical programming problems can be represented by network related models. Dr. Kamel ATTAR | Chapter 5: Network analysis | Critical Path Analysis
  • 5.
    4 Introduction and definitions Situationsin network diagram Crtical Path examples Definition (Network) It is a graphical representation of logical and sequentially connected activities and events of a project. Network is also called arrow diagram. Network analysis is known by many names • PERT (Program Evaluation and Review Technique) developed during 1950’s. the technique was developed and used in conjunction with the planning and designing of the Polaris missile project. • CPM (Critical Path Method), which was developed by DuPont company and applied first to the construction projects in the chemical industry. • PEP (Program Evaluation Procedure), • LCES (Least Cost Estimating and Scheduling), • SCANS (Scheduling and Control by Automated Network System), etc We will present the two most widely applied algorithms PERT and CPM. These techniques are used in project management to help the manager answer questions like: • When will the project be finished? • When is each individual part of the project scheduled start and finish? • Which activities must be finished on time to avoid making the entire project late? • Is it possible to shift resources to critical parts from other numerical parts without affecting the overall completion time? Dr. Kamel ATTAR | Chapter 5: Network analysis | Critical Path Analysis
  • 6.
    5 Introduction and definitions Situationsin network diagram Crtical Path examples Each activity is represented by an arrow. An event (or node) will always occur at the beginning and end of an activity. The event has no resources and is represented by a circle. The ith event and jth event are the tail event and head event respectively. Activities are usually classified into four categories: • Concurrent activities: activities operate or occur at the same time • Predecessors activities: activities that must be completed before the activity can start. • Successors activities: activities can start when the activity complete. • Dummy activities: it indicates only precedence relationships and does not require any time of effort. Dr. Kamel ATTAR | Chapter 5: Network analysis | Critical Path Analysis
  • 7.
    6 Introduction and definitions Situationsin network diagram Crtical Path examples Concurrent activities: One or more activities can start and end si- multaneously at an event Predecessors and Successors Activities: Activities performed before given events are known as Predecessors activities Activities performed after given events are known as Successors activities • A must finish before either B or C can start. • Both D and E must finish before F can start. • Both A and B must finish before either of C or D can start. Dr. Kamel ATTAR | Chapter 5: Network analysis | Critical Path Analysis
  • 8.
    7 Introduction and definitions Situationsin network diagram Crtical Path examples Dummy Activity: An imaginary activity which does not consume any resource and time is called a dummy activity. Dummy activities are simply used to represent a connection between events in order to maintain a logic in the network. It is represented by a dotted line in a network. • Both A must finish before either B or C can start. • C must finish before D can start. • C and B must finish before F can start. Errors to be Avoided in constructing a network: Two activities starting from a tail event must not have a same en event. To ensure this, it is absolutely necessary to introduce a dummy activity, as shown in the figure Looping error should not be formed in a network, as it represents performance of activities repeatedly in a cyclic manner, as show in the figure. In a network, there should be only one start event and one ending event. The direction of arrows should flow from left to right avoiding mixing of direction. Dr. Kamel ATTAR | Chapter 5: Network analysis | Critical Path Analysis
  • 9.
    8 Introduction and definitions Situationsin network diagram Crtical Path examples Example 1 Example 2 Example 3 Example A project schedule has the following characteristics as shown in table: Activity name A B C D E F G H I J K L Activity Predecessor - - A B B C, D E E G H I, J F Duration (in Months) 4 1 1 1 6 5 4 8 1 2 5 7 1. Construct CPM network. 2. Compute the earliest time (ET) and the latest time (LT), then calculate the the total float for each activity. 3. Find the critical activities and critical path. Dr. Kamel ATTAR | Chapter 5: Network analysis | Critical Path Analysis
  • 10.
    9 Introduction and definitions Situationsin network diagram Crtical Path examples Example 1 Example 2 Example 3 Solution Activity name A B C D E F G H I J K L Activity Predecessor - - A B B C, D E E G H I, J F Duration (in Months) 4 1 1 1 6 5 4 8 1 2 5 7 1. Dr. Kamel ATTAR | Chapter 5: Network analysis | Critical Path Analysis
  • 11.
    9 Introduction and definitions Situationsin network diagram Crtical Path examples Example 1 Example 2 Example 3 Solution Activity name A B C D E F G H I J K L Activity Predecessor - - A B B C, D E E G H I, J F Duration (in Months) 4 1 1 1 6 5 4 8 1 2 5 7 1. Dr. Kamel ATTAR | Chapter 5: Network analysis | Critical Path Analysis
  • 12.
    9 Introduction and definitions Situationsin network diagram Crtical Path examples Example 1 Example 2 Example 3 Solution Activity name A B C D E F G H I J K L Activity Predecessor - - A B B C, D E E G H I, J F Duration (in Months) 4 1 1 1 6 5 4 8 1 2 5 7 1. Dr. Kamel ATTAR | Chapter 5: Network analysis | Critical Path Analysis
  • 13.
    9 Introduction and definitions Situationsin network diagram Crtical Path examples Example 1 Example 2 Example 3 Solution Activity name A B C D E F G H I J K L Activity Predecessor - - A B B C, D E E G H I, J F Duration (in Months) 4 1 1 1 6 5 4 8 1 2 5 7 1. Dr. Kamel ATTAR | Chapter 5: Network analysis | Critical Path Analysis
  • 14.
    9 Introduction and definitions Situationsin network diagram Crtical Path examples Example 1 Example 2 Example 3 Solution Activity name A B C D E F G H I J K L Activity Predecessor - - A B B C, D E E G H I, J F Duration (in Months) 4 1 1 1 6 5 4 8 1 2 5 7 1. Dr. Kamel ATTAR | Chapter 5: Network analysis | Critical Path Analysis
  • 15.
    10 Introduction and definitions Situationsin network diagram Crtical Path examples Example 1 Example 2 Example 3 Solution 2. To determine the critical path, compute the earliest time TE and latest time TL for each of the activity of the project. The calculations of TE and TL are as follows: Dr. Kamel ATTAR | Chapter 5: Network analysis | Critical Path Analysis
  • 16.
    10 Introduction and definitions Situationsin network diagram Crtical Path examples Example 1 Example 2 Example 3 Solution 2. To determine the critical path, compute the earliest time TE and latest time TL for each of the activity of the project. The calculations of TE and TL are as follows: Dr. Kamel ATTAR | Chapter 5: Network analysis | Critical Path Analysis
  • 17.
    10 Introduction and definitions Situationsin network diagram Crtical Path examples Example 1 Example 2 Example 3 Solution 2. To determine the critical path, compute the earliest time TE and latest time TL for each of the activity of the project. The calculations of TE and TL are as follows: Dr. Kamel ATTAR | Chapter 5: Network analysis | Critical Path Analysis
  • 18.
    10 Introduction and definitions Situationsin network diagram Crtical Path examples Example 1 Example 2 Example 3 Solution 2. To determine the critical path, compute the earliest time TE and latest time TL for each of the activity of the project. The calculations of TE and TL are as follows: Dr. Kamel ATTAR | Chapter 5: Network analysis | Critical Path Analysis
  • 19.
    10 Introduction and definitions Situationsin network diagram Crtical Path examples Example 1 Example 2 Example 3 Solution 2. To determine the critical path, compute the earliest time TE and latest time TL for each of the activity of the project. The calculations of TE and TL are as follows: Dr. Kamel ATTAR | Chapter 5: Network analysis | Critical Path Analysis
  • 20.
    10 Introduction and definitions Situationsin network diagram Crtical Path examples Example 1 Example 2 Example 3 Solution 2. To determine the critical path, compute the earliest time TE and latest time TL for each of the activity of the project. The calculations of TE and TL are as follows: Dr. Kamel ATTAR | Chapter 5: Network analysis | Critical Path Analysis
  • 21.
    10 Introduction and definitions Situationsin network diagram Crtical Path examples Example 1 Example 2 Example 3 Solution 2. To determine the critical path, compute the earliest time TE and latest time TL for each of the activity of the project. The calculations of TE and TL are as follows: Dr. Kamel ATTAR | Chapter 5: Network analysis | Critical Path Analysis
  • 22.
    10 Introduction and definitions Situationsin network diagram Crtical Path examples Example 1 Example 2 Example 3 Solution 2. To determine the critical path, compute the earliest time TE and latest time TL for each of the activity of the project. The calculations of TE and TL are as follows: Dr. Kamel ATTAR | Chapter 5: Network analysis | Critical Path Analysis
  • 23.
    10 Introduction and definitions Situationsin network diagram Crtical Path examples Example 1 Example 2 Example 3 Solution 2. To determine the critical path, compute the earliest time TE and latest time TL for each of the activity of the project. The calculations of TE and TL are as follows: Dr. Kamel ATTAR | Chapter 5: Network analysis | Critical Path Analysis
  • 24.
    10 Introduction and definitions Situationsin network diagram Crtical Path examples Example 1 Example 2 Example 3 Solution 2. To determine the critical path, compute the earliest time TE and latest time TL for each of the activity of the project. The calculations of TE and TL are as follows: Dr. Kamel ATTAR | Chapter 5: Network analysis | Critical Path Analysis
  • 25.
    10 Introduction and definitions Situationsin network diagram Crtical Path examples Example 1 Example 2 Example 3 Solution 2. To determine the critical path, compute the earliest time TE and latest time TL for each of the activity of the project. The calculations of TE and TL are as follows: Dr. Kamel ATTAR | Chapter 5: Network analysis | Critical Path Analysis
  • 26.
    10 Introduction and definitions Situationsin network diagram Crtical Path examples Example 1 Example 2 Example 3 Solution 2. To determine the critical path, compute the earliest time TE and latest time TL for each of the activity of the project. The calculations of TE and TL are as follows: Dr. Kamel ATTAR | Chapter 5: Network analysis | Critical Path Analysis
  • 27.
    10 Introduction and definitions Situationsin network diagram Crtical Path examples Example 1 Example 2 Example 3 Solution 2. To determine the critical path, compute the earliest time TE and latest time TL for each of the activity of the project. The calculations of TE and TL are as follows: Dr. Kamel ATTAR | Chapter 5: Network analysis | Critical Path Analysis
  • 28.
    11 Introduction and definitions Situationsin network diagram Crtical Path examples Example 1 Example 2 Example 3 +t −→ −t ←− Activity Normal Earliest Time (TE) Latest Time (TL) Total Float Name Time Start (ES) Finish (EF) Start (LS) Finish (LF) ES − LS A 4 0 9 B 1 0 1 C 1 4 10 D 1 1 10 E 6 1 7 F 5 5 15 G 4 7 16 H 8 7 15 I 1 11 17 J 2 15 17 K 5 17 22 L 7 10 22 Dr. Kamel ATTAR | Chapter 5: Network analysis | Critical Path Analysis
  • 29.
    11 Introduction and definitions Situationsin network diagram Crtical Path examples Example 1 Example 2 Example 3 +t −→ −t ←− Activity Normal Earliest Time (TE) Latest Time (TL) Total Float Name Time Start (ES) Finish (EF) Start (LS) Finish (LF) ES − LS A 4 0 4 5 9 B 1 0 1 C 1 4 10 D 1 1 10 E 6 1 7 F 5 5 15 G 4 7 16 H 8 7 15 I 1 11 17 J 2 15 17 K 5 17 22 L 7 10 22 Dr. Kamel ATTAR | Chapter 5: Network analysis | Critical Path Analysis
  • 30.
    11 Introduction and definitions Situationsin network diagram Crtical Path examples Example 1 Example 2 Example 3 +t −→ −t ←− Activity Normal Earliest Time (TE) Latest Time (TL) Total Float Name Time Start (ES) Finish (EF) Start (LS) Finish (LF) ES − LS A 4 0 4 5 9 B 1 0 1 0 1 C 1 4 10 D 1 1 10 E 6 1 7 F 5 5 15 G 4 7 16 H 8 7 15 I 1 11 17 J 2 15 17 K 5 17 22 L 7 10 22 Dr. Kamel ATTAR | Chapter 5: Network analysis | Critical Path Analysis
  • 31.
    11 Introduction and definitions Situationsin network diagram Crtical Path examples Example 1 Example 2 Example 3 +t −→ −t ←− Activity Normal Earliest Time (TE) Latest Time (TL) Total Float Name Time Start (ES) Finish (EF) Start (LS) Finish (LF) ES − LS A 4 0 4 5 9 B 1 0 1 0 1 C 1 4 5 9 10 D 1 1 10 E 6 1 7 F 5 5 15 G 4 7 16 H 8 7 15 I 1 11 17 J 2 15 17 K 5 17 22 L 7 10 22 Dr. Kamel ATTAR | Chapter 5: Network analysis | Critical Path Analysis
  • 32.
    11 Introduction and definitions Situationsin network diagram Crtical Path examples Example 1 Example 2 Example 3 +t −→ −t ←− Activity Normal Earliest Time (TE) Latest Time (TL) Total Float Name Time Start (ES) Finish (EF) Start (LS) Finish (LF) ES − LS A 4 0 4 5 9 B 1 0 1 0 1 C 1 4 5 9 10 D 1 1 2 9 10 E 6 1 7 F 5 5 15 G 4 7 16 H 8 7 15 I 1 11 17 J 2 15 17 K 5 17 22 L 7 10 22 Dr. Kamel ATTAR | Chapter 5: Network analysis | Critical Path Analysis
  • 33.
    11 Introduction and definitions Situationsin network diagram Crtical Path examples Example 1 Example 2 Example 3 +t −→ −t ←− Activity Normal Earliest Time (TE) Latest Time (TL) Total Float Name Time Start (ES) Finish (EF) Start (LS) Finish (LF) ES − LS A 4 0 4 5 9 B 1 0 1 0 1 C 1 4 5 9 10 D 1 1 2 9 10 E 6 1 7 1 7 F 5 5 15 G 4 7 16 H 8 7 15 I 1 11 17 J 2 15 17 K 5 17 22 L 7 10 22 Dr. Kamel ATTAR | Chapter 5: Network analysis | Critical Path Analysis
  • 34.
    11 Introduction and definitions Situationsin network diagram Crtical Path examples Example 1 Example 2 Example 3 +t −→ −t ←− Activity Normal Earliest Time (TE) Latest Time (TL) Total Float Name Time Start (ES) Finish (EF) Start (LS) Finish (LF) ES − LS A 4 0 4 5 9 B 1 0 1 0 1 C 1 4 5 9 10 D 1 1 2 9 10 E 6 1 7 1 7 F 5 5 10 10 15 G 4 7 16 H 8 7 15 I 1 11 17 J 2 15 17 K 5 17 22 L 7 10 22 Dr. Kamel ATTAR | Chapter 5: Network analysis | Critical Path Analysis
  • 35.
    11 Introduction and definitions Situationsin network diagram Crtical Path examples Example 1 Example 2 Example 3 +t −→ −t ←− Activity Normal Earliest Time (TE) Latest Time (TL) Total Float Name Time Start (ES) Finish (EF) Start (LS) Finish (LF) ES − LS A 4 0 4 5 9 B 1 0 1 0 1 C 1 4 5 9 10 D 1 1 2 9 10 E 6 1 7 1 7 F 5 5 10 10 15 G 4 7 11 12 16 H 8 7 15 7 15 I 1 11 12 16 17 J 2 15 17 15 17 K 5 17 22 17 22 L 7 10 17 15 22 Dr. Kamel ATTAR | Chapter 5: Network analysis | Critical Path Analysis
  • 36.
    11 Introduction and definitions Situationsin network diagram Crtical Path examples Example 1 Example 2 Example 3 +t −→ −t ←− Activity Normal Earliest Time (TE) Latest Time (TL) Total Float Name Time Start (ES) Finish (EF) Start (LS) Finish (LF) ES − LS A 4 0 4 5 9 5 B 1 0 1 0 1 C 1 4 5 9 10 D 1 1 2 9 10 E 6 1 7 1 7 F 5 5 10 10 15 G 4 7 11 12 16 H 8 7 15 7 15 I 1 11 12 16 17 J 2 15 17 15 17 K 5 17 22 17 22 L 7 10 17 15 22 Dr. Kamel ATTAR | Chapter 5: Network analysis | Critical Path Analysis
  • 37.
    11 Introduction and definitions Situationsin network diagram Crtical Path examples Example 1 Example 2 Example 3 +t −→ −t ←− Activity Normal Earliest Time (TE) Latest Time (TL) Total Float Name Time Start (ES) Finish (EF) Start (LS) Finish (LF) ES − LS A 4 0 4 5 9 5 B 1 0 1 0 1 0 C 1 4 5 9 10 D 1 1 2 9 10 E 6 1 7 1 7 F 5 5 10 10 15 G 4 7 11 12 16 H 8 7 15 7 15 I 1 11 12 16 17 J 2 15 17 15 17 K 5 17 22 17 22 L 7 10 17 15 22 Dr. Kamel ATTAR | Chapter 5: Network analysis | Critical Path Analysis
  • 38.
    11 Introduction and definitions Situationsin network diagram Crtical Path examples Example 1 Example 2 Example 3 +t −→ −t ←− Activity Normal Earliest Time (TE) Latest Time (TL) Total Float Name Time Start (ES) Finish (EF) Start (LS) Finish (LF) ES − LS A 4 0 4 5 9 5 B 1 0 1 0 1 0 C 1 4 5 9 10 5 D 1 1 2 9 10 E 6 1 7 1 7 F 5 5 10 10 15 G 4 7 11 12 16 H 8 7 15 7 15 I 1 11 12 16 17 J 2 15 17 15 17 K 5 17 22 17 22 L 7 10 17 15 22 Dr. Kamel ATTAR | Chapter 5: Network analysis | Critical Path Analysis
  • 39.
    11 Introduction and definitions Situationsin network diagram Crtical Path examples Example 1 Example 2 Example 3 +t −→ −t ←− Activity Normal Earliest Time (TE) Latest Time (TL) Total Float Name Time Start (ES) Finish (EF) Start (LS) Finish (LF) ES − LS A 4 0 4 5 9 5 B 1 0 1 0 1 0 C 1 4 5 9 10 5 D 1 1 2 9 10 8 E 6 1 7 1 7 F 5 5 10 10 15 G 4 7 11 12 16 H 8 7 15 7 15 I 1 11 12 16 17 J 2 15 17 15 17 K 5 17 22 17 22 L 7 10 17 15 22 Dr. Kamel ATTAR | Chapter 5: Network analysis | Critical Path Analysis
  • 40.
    11 Introduction and definitions Situationsin network diagram Crtical Path examples Example 1 Example 2 Example 3 +t −→ −t ←− Activity Normal Earliest Time (TE) Latest Time (TL) Total Float Name Time Start (ES) Finish (EF) Start (LS) Finish (LF) ES − LS A 4 0 4 5 9 5 B 1 0 1 0 1 0 C 1 4 5 9 10 5 D 1 1 2 9 10 8 E 6 1 7 1 7 0 F 5 5 10 10 15 5 G 4 7 11 12 16 5 H 8 7 15 7 15 0 I 1 11 12 16 17 5 J 2 15 17 15 17 0 K 5 17 22 17 22 0 L 7 10 17 15 22 5 Dr. Kamel ATTAR | Chapter 5: Network analysis | Critical Path Analysis
  • 41.
    12 Introduction and definitions Situationsin network diagram Crtical Path examples Example 1 Example 2 Example 3 3. From the table, we observe that the activities B, E, H, J and K are critical activities as their floats are zero. +t −→ −t ←− Activity Normal Earliest Time (TE) Latest Time (TL) Total Float Name Time Start (ES) Finish (EF) Start (LS) Finish (LF) ES − LS A 4 0 4 5 9 5 B 1 0 1 0 1 0 C 1 4 5 9 10 5 D 1 1 2 9 10 8 E 6 1 7 1 7 0 F 5 5 10 10 15 5 G 4 7 11 12 16 5 H 8 7 15 7 15 0 I 1 11 12 16 17 5 J 2 15 17 15 17 0 K 5 17 22 17 22 0 L 7 10 17 15 22 5 Dr. Kamel ATTAR | Chapter 5: Network analysis | Critical Path Analysis
  • 42.
    13 Introduction and definitions Situationsin network diagram Crtical Path examples Example 1 Example 2 Example 3 B → E → H → J → K Dr. Kamel ATTAR | Chapter 5: Network analysis | Critical Path Analysis
  • 43.
    14 Introduction and definitions Situationsin network diagram Crtical Path examples Example 1 Example 2 Example 3 Example We consider the following table Activity A B C D E F G H I J K L M N Activity Predecessor - - - B A A B C, D C, D E F, G, H F, G, H I J, K Duration (in Months) 2 5 4 5 7 3 3 6 2 5 4 3 12 8 a. Construct the CPM network. b. Compute the total Floats for each activity. c. Find the critical activities, critical path and project completion time. Dr. Kamel ATTAR | Chapter 5: Network analysis | Critical Path Analysis
  • 44.
    15 Introduction and definitions Situationsin network diagram Crtical Path examples Example 1 Example 2 Example 3 Solution Activity A B C D E F G H I J K L M N Activity Predecessor - - - B A A B C, D C, D E F, G, H F, G, H I J, K Duration (in Months) 2 5 4 5 7 3 3 6 2 5 4 3 12 8 1. Dr. Kamel ATTAR | Chapter 5: Network analysis | Critical Path Analysis
  • 45.
    15 Introduction and definitions Situationsin network diagram Crtical Path examples Example 1 Example 2 Example 3 Solution Activity A B C D E F G H I J K L M N Activity Predecessor - - - B A A B C, D C, D E F, G, H F, G, H I J, K Duration (in Months) 2 5 4 5 7 3 3 6 2 5 4 3 12 8 1. Dr. Kamel ATTAR | Chapter 5: Network analysis | Critical Path Analysis
  • 46.
    15 Introduction and definitions Situationsin network diagram Crtical Path examples Example 1 Example 2 Example 3 Solution Activity A B C D E F G H I J K L M N Activity Predecessor - - - B A A B C, D C, D E F, G, H F, G, H I J, K Duration (in Months) 2 5 4 5 7 3 3 6 2 5 4 3 12 8 1. Dr. Kamel ATTAR | Chapter 5: Network analysis | Critical Path Analysis
  • 47.
    15 Introduction and definitions Situationsin network diagram Crtical Path examples Example 1 Example 2 Example 3 Solution Activity A B C D E F G H I J K L M N Activity Predecessor - - - B A A B C, D C, D E F, G, H F, G, H I J, K Duration (in Months) 2 5 4 5 7 3 3 6 2 5 4 3 12 8 1. Dr. Kamel ATTAR | Chapter 5: Network analysis | Critical Path Analysis
  • 48.
    16 Introduction and definitions Situationsin network diagram Crtical Path examples Example 1 Example 2 Example 3 Solution 2. To determine the critical path, compute the earliest time TE and latest time TL for each of the activity of the project. The calculations of TE and TL are as follows: Dr. Kamel ATTAR | Chapter 5: Network analysis | Critical Path Analysis
  • 49.
    16 Introduction and definitions Situationsin network diagram Crtical Path examples Example 1 Example 2 Example 3 Solution 2. To determine the critical path, compute the earliest time TE and latest time TL for each of the activity of the project. The calculations of TE and TL are as follows: Dr. Kamel ATTAR | Chapter 5: Network analysis | Critical Path Analysis
  • 50.
    16 Introduction and definitions Situationsin network diagram Crtical Path examples Example 1 Example 2 Example 3 Solution 2. To determine the critical path, compute the earliest time TE and latest time TL for each of the activity of the project. The calculations of TE and TL are as follows: Dr. Kamel ATTAR | Chapter 5: Network analysis | Critical Path Analysis
  • 51.
    16 Introduction and definitions Situationsin network diagram Crtical Path examples Example 1 Example 2 Example 3 Solution 2. To determine the critical path, compute the earliest time TE and latest time TL for each of the activity of the project. The calculations of TE and TL are as follows: Dr. Kamel ATTAR | Chapter 5: Network analysis | Critical Path Analysis
  • 52.
    16 Introduction and definitions Situationsin network diagram Crtical Path examples Example 1 Example 2 Example 3 Solution 2. To determine the critical path, compute the earliest time TE and latest time TL for each of the activity of the project. The calculations of TE and TL are as follows: Dr. Kamel ATTAR | Chapter 5: Network analysis | Critical Path Analysis
  • 53.
    16 Introduction and definitions Situationsin network diagram Crtical Path examples Example 1 Example 2 Example 3 Solution 2. To determine the critical path, compute the earliest time TE and latest time TL for each of the activity of the project. The calculations of TE and TL are as follows: Dr. Kamel ATTAR | Chapter 5: Network analysis | Critical Path Analysis
  • 54.
    16 Introduction and definitions Situationsin network diagram Crtical Path examples Example 1 Example 2 Example 3 Solution 2. To determine the critical path, compute the earliest time TE and latest time TL for each of the activity of the project. The calculations of TE and TL are as follows: Dr. Kamel ATTAR | Chapter 5: Network analysis | Critical Path Analysis
  • 55.
    16 Introduction and definitions Situationsin network diagram Crtical Path examples Example 1 Example 2 Example 3 Solution 2. To determine the critical path, compute the earliest time TE and latest time TL for each of the activity of the project. The calculations of TE and TL are as follows: Dr. Kamel ATTAR | Chapter 5: Network analysis | Critical Path Analysis
  • 56.
    16 Introduction and definitions Situationsin network diagram Crtical Path examples Example 1 Example 2 Example 3 Solution 2. To determine the critical path, compute the earliest time TE and latest time TL for each of the activity of the project. The calculations of TE and TL are as follows: Dr. Kamel ATTAR | Chapter 5: Network analysis | Critical Path Analysis
  • 57.
    17 Introduction and definitions Situationsin network diagram Crtical Path examples Example 1 Example 2 Example 3 +t −→ −t ←− Activity Normal Earliest Time (TE) Latest Time (TL) Total Float Name Time Start (ES) Finish (EF) Start (LS) Finish (LF) ES − LS A 2 0 8 B 5 0 5 C 4 0 10 D 5 5 10 E 7 2 15 F 3 2 16 G 3 5 16 H 6 10 16 I 2 10 16 J 5 9 20 K 4 16 20 L 3 16 28 M 12 12 28 N 8 20 28 Dr. Kamel ATTAR | Chapter 5: Network analysis | Critical Path Analysis
  • 58.
    17 Introduction and definitions Situationsin network diagram Crtical Path examples Example 1 Example 2 Example 3 +t −→ −t ←− Activity Normal Earliest Time (TE) Latest Time (TL) Total Float Name Time Start (ES) Finish (EF) Start (LS) Finish (LF) ES − LS A 2 0 2 6 8 B 5 0 5 C 4 0 10 D 5 5 10 E 7 2 15 F 3 2 16 G 3 5 16 H 6 10 16 I 2 10 16 J 5 9 20 K 4 16 20 L 3 16 28 M 12 12 28 N 8 20 28 Dr. Kamel ATTAR | Chapter 5: Network analysis | Critical Path Analysis
  • 59.
    17 Introduction and definitions Situationsin network diagram Crtical Path examples Example 1 Example 2 Example 3 +t −→ −t ←− Activity Normal Earliest Time (TE) Latest Time (TL) Total Float Name Time Start (ES) Finish (EF) Start (LS) Finish (LF) ES − LS A 2 0 2 6 8 B 5 0 5 0 5 C 4 0 10 D 5 5 10 E 7 2 15 F 3 2 16 G 3 5 16 H 6 10 16 I 2 10 16 J 5 9 20 K 4 16 20 L 3 16 28 M 12 12 28 N 8 20 28 Dr. Kamel ATTAR | Chapter 5: Network analysis | Critical Path Analysis
  • 60.
    17 Introduction and definitions Situationsin network diagram Crtical Path examples Example 1 Example 2 Example 3 +t −→ −t ←− Activity Normal Earliest Time (TE) Latest Time (TL) Total Float Name Time Start (ES) Finish (EF) Start (LS) Finish (LF) ES − LS A 2 0 2 6 8 B 5 0 5 0 5 C 4 0 4 6 10 D 5 5 10 E 7 2 15 F 3 2 16 G 3 5 16 H 6 10 16 I 2 10 16 J 5 9 20 K 4 16 20 L 3 16 28 M 12 12 28 N 8 20 28 Dr. Kamel ATTAR | Chapter 5: Network analysis | Critical Path Analysis
  • 61.
    17 Introduction and definitions Situationsin network diagram Crtical Path examples Example 1 Example 2 Example 3 +t −→ −t ←− Activity Normal Earliest Time (TE) Latest Time (TL) Total Float Name Time Start (ES) Finish (EF) Start (LS) Finish (LF) ES − LS A 2 0 2 6 8 B 5 0 5 0 5 C 4 0 4 6 10 D 5 5 10 5 10 E 7 2 15 F 3 2 16 G 3 5 16 H 6 10 16 I 2 10 16 J 5 9 20 K 4 16 20 L 3 16 28 M 12 12 28 N 8 20 28 Dr. Kamel ATTAR | Chapter 5: Network analysis | Critical Path Analysis
  • 62.
    17 Introduction and definitions Situationsin network diagram Crtical Path examples Example 1 Example 2 Example 3 +t −→ −t ←− Activity Normal Earliest Time (TE) Latest Time (TL) Total Float Name Time Start (ES) Finish (EF) Start (LS) Finish (LF) ES − LS A 2 0 2 6 8 B 5 0 5 0 5 C 4 0 4 6 10 D 5 5 10 5 10 E 7 2 9 8 15 F 3 2 16 G 3 5 16 H 6 10 16 I 2 10 16 J 5 9 20 K 4 16 20 L 3 16 28 M 12 12 28 N 8 20 28 Dr. Kamel ATTAR | Chapter 5: Network analysis | Critical Path Analysis
  • 63.
    17 Introduction and definitions Situationsin network diagram Crtical Path examples Example 1 Example 2 Example 3 +t −→ −t ←− Activity Normal Earliest Time (TE) Latest Time (TL) Total Float Name Time Start (ES) Finish (EF) Start (LS) Finish (LF) ES − LS A 2 0 2 6 8 B 5 0 5 0 5 C 4 0 4 6 10 D 5 5 10 5 10 E 7 2 9 8 15 F 3 2 5 13 16 G 3 5 16 H 6 10 16 I 2 10 16 J 5 9 20 K 4 16 20 L 3 16 28 M 12 12 28 N 8 20 28 Dr. Kamel ATTAR | Chapter 5: Network analysis | Critical Path Analysis
  • 64.
    17 Introduction and definitions Situationsin network diagram Crtical Path examples Example 1 Example 2 Example 3 +t −→ −t ←− Activity Normal Earliest Time (TE) Latest Time (TL) Total Float Name Time Start (ES) Finish (EF) Start (LS) Finish (LF) ES − LS A 2 0 2 6 8 B 5 0 5 0 5 C 4 0 4 6 10 D 5 5 10 5 10 E 7 2 9 8 15 F 3 2 5 13 16 G 3 5 8 13 16 H 6 10 16 10 16 I 2 10 12 14 16 J 5 9 14 15 20 K 4 16 20 16 20 L 3 16 19 25 28 M 12 12 24 16 28 N 8 20 28 20 28 Dr. Kamel ATTAR | Chapter 5: Network analysis | Critical Path Analysis
  • 65.
    17 Introduction and definitions Situationsin network diagram Crtical Path examples Example 1 Example 2 Example 3 +t −→ −t ←− Activity Normal Earliest Time (TE) Latest Time (TL) Total Float Name Time Start (ES) Finish (EF) Start (LS) Finish (LF) ES − LS A 2 0 2 6 8 6 B 5 0 5 0 5 C 4 0 4 6 10 D 5 5 10 5 10 E 7 2 9 8 15 F 3 2 5 13 16 G 3 5 8 13 16 H 6 10 16 10 16 I 2 10 12 14 16 J 5 9 14 15 20 K 4 16 20 16 20 L 3 16 19 25 28 M 12 12 24 16 28 N 8 20 28 20 28 Dr. Kamel ATTAR | Chapter 5: Network analysis | Critical Path Analysis
  • 66.
    17 Introduction and definitions Situationsin network diagram Crtical Path examples Example 1 Example 2 Example 3 +t −→ −t ←− Activity Normal Earliest Time (TE) Latest Time (TL) Total Float Name Time Start (ES) Finish (EF) Start (LS) Finish (LF) ES − LS A 2 0 2 6 8 6 B 5 0 5 0 5 0 C 4 0 4 6 10 D 5 5 10 5 10 E 7 2 9 8 15 F 3 2 5 13 16 G 3 5 8 13 16 H 6 10 16 10 16 I 2 10 12 14 16 J 5 9 14 15 20 K 4 16 20 16 20 L 3 16 19 25 28 M 12 12 24 16 28 N 8 20 28 20 28 Dr. Kamel ATTAR | Chapter 5: Network analysis | Critical Path Analysis
  • 67.
    17 Introduction and definitions Situationsin network diagram Crtical Path examples Example 1 Example 2 Example 3 +t −→ −t ←− Activity Normal Earliest Time (TE) Latest Time (TL) Total Float Name Time Start (ES) Finish (EF) Start (LS) Finish (LF) ES − LS A 2 0 2 6 8 6 B 5 0 5 0 5 0 C 4 0 4 6 10 6 D 5 5 10 5 10 E 7 2 9 8 15 F 3 2 5 13 16 G 3 5 8 13 16 H 6 10 16 10 16 I 2 10 12 14 16 J 5 9 14 15 20 K 4 16 20 16 20 L 3 16 19 25 28 M 12 12 24 16 28 N 8 20 28 20 28 Dr. Kamel ATTAR | Chapter 5: Network analysis | Critical Path Analysis
  • 68.
    17 Introduction and definitions Situationsin network diagram Crtical Path examples Example 1 Example 2 Example 3 +t −→ −t ←− Activity Normal Earliest Time (TE) Latest Time (TL) Total Float Name Time Start (ES) Finish (EF) Start (LS) Finish (LF) ES − LS A 2 0 2 6 8 6 B 5 0 5 0 5 0 C 4 0 4 6 10 6 D 5 5 10 5 10 0 E 7 2 9 8 15 F 3 2 5 13 16 G 3 5 8 13 16 H 6 10 16 10 16 I 2 10 12 14 16 J 5 9 14 15 20 K 4 16 20 16 20 L 3 16 19 25 28 M 12 12 24 16 28 N 8 20 28 20 28 Dr. Kamel ATTAR | Chapter 5: Network analysis | Critical Path Analysis
  • 69.
    17 Introduction and definitions Situationsin network diagram Crtical Path examples Example 1 Example 2 Example 3 +t −→ −t ←− Activity Normal Earliest Time (TE) Latest Time (TL) Total Float Name Time Start (ES) Finish (EF) Start (LS) Finish (LF) ES − LS A 2 0 2 6 8 6 B 5 0 5 0 5 0 C 4 0 4 6 10 6 D 5 5 10 5 10 0 E 7 2 9 8 15 6 F 3 2 5 13 16 11 G 3 5 8 13 16 8 H 6 10 16 10 16 0 I 2 10 12 14 16 4 J 5 9 14 15 20 6 K 4 16 20 16 20 0 L 3 16 19 25 28 9 M 12 12 24 16 28 4 N 8 20 28 20 28 0 Dr. Kamel ATTAR | Chapter 5: Network analysis | Critical Path Analysis
  • 70.
    18 Introduction and definitions Situationsin network diagram Crtical Path examples Example 1 Example 2 Example 3 3. From the table, we observe that the critical activities are B, D, H, and L. +t −→ −t ←− Activity Normal Earliest Time (TE) Latest Time (TL) Total Float Name Time Start (ES) Finish (EF) Start (LS) Finish (LF) ES − LS A 2 0 2 6 8 6 B 5 0 5 0 5 0 C 4 0 4 6 10 6 D 5 5 10 5 10 0 E 7 2 9 8 15 6 F 3 2 5 13 16 11 G 3 5 8 13 16 8 H 6 10 16 10 16 0 I 2 10 12 14 16 4 J 5 9 14 15 20 6 K 4 16 20 16 20 0 L 3 16 19 25 28 9 M 12 12 24 16 28 4 N 8 20 28 20 28 0 Dr. Kamel ATTAR | Chapter 5: Network analysis | Critical Path Analysis
  • 71.
    19 Introduction and definitions Situationsin network diagram Crtical Path examples Example 1 Example 2 Example 3 Then the critical path will is B → D → H → L and the project completion time is 28 Months. Dr. Kamel ATTAR | Chapter 5: Network analysis | Critical Path Analysis
  • 72.
    20 Introduction and definitions Situationsin network diagram Crtical Path examples Example 1 Example 2 Example 3 Example The RELIABLE CONSTRUCTION COMPANY has just made the winning bid of 5.4$ million to construct a new plant for a major manufacturer. The manufacturer needs the plant to go into operation within a year. Therefore, the contract includes the following provisions: • A penalty of 300, 000$ if Reliable has not completed construction by the deadline 47 weeks from now. • To provide additional incentive for speedy construction, a bonus of 150, 000$ will be paid to Reliable if the plant is completed within 40 weeks. Reliable is assigning its best construction manager, kamel ATTAR, to this project to help ensure that it stays on schedule. He looks forward to the challenge of bringing the project in on schedule, and perhaps even finishing early. However, since he is doubtful that it will be feasible to finish within 40 weeks without incurring excessive costs, he has decided to focus his initial planning on meeting the deadline of 47 weeks. Mr. ATTAR will need to arrange for a number of crews to perform the various construction activities at different times. Dr. Kamel ATTAR | Chapter 5: Network analysis | Critical Path Analysis
  • 73.
    21 Introduction and definitions Situationsin network diagram Crtical Path examples Example 1 Example 2 Example 3 Example The table below shows his list of the various activities. The third column provides important additional information for coordinating the scheduling of the crews. Activity Activity Description Predecessors Estimated Duration A Excavate − 2 weeks B Lay the foundation A 4 weeks C Put up the rough wall B 10 weeks D Put up the roof C 6 weeks E Install the exterior plumbing C 4 weeks F Install the interior plumbing E 5 weeks G Put up the exterior siding D 7 weeks H Do the exterior painting E, G 8 weeks I Do the electrical work C 7 weeks J Put up the wallboard F, I 8 weeks K Install the flooring J 4 weeks L Do the interior painting J 5 weeks M Install the exterior fixtures H 2 weeks N Install the interior fixtures K, L 6 weeks Dr. Kamel ATTAR | Chapter 5: Network analysis | Critical Path Analysis
  • 74.
    22 Introduction and definitions Situationsin network diagram Crtical Path examples Example 1 Example 2 Example 3 Example a. Construct the CPM network to better visualize the flow of the activities. b. Compute the total Floats for each activity. c. Find the critical activities, critical path d. What is the total time required to complete the project if no delays occur? Activity A B C D E F G H I J K L M Activity Predecessor - A B C C E D E, G C F, I J J H Duration (in Weeks) 2 4 10 6 4 5 7 8 7 8 4 5 2 Dr. Kamel ATTAR | Chapter 5: Network analysis | Critical Path Analysis
  • 75.
    23 Introduction and definitions Situationsin network diagram Crtical Path examples Example 1 Example 2 Example 3 Activity A B C D E F G H I J K L M N Activity Predecessor - A B C C E D E, G C F, I J J H K, L Duration (in Weeks) 2 4 10 6 4 5 7 8 7 8 4 5 2 6 1. Dr. Kamel ATTAR | Chapter 5: Network analysis | Critical Path Analysis
  • 76.
    23 Introduction and definitions Situationsin network diagram Crtical Path examples Example 1 Example 2 Example 3 Activity A B C D E F G H I J K L M N Activity Predecessor - A B C C E D E, G C F, I J J H K, L Duration (in Weeks) 2 4 10 6 4 5 7 8 7 8 4 5 2 6 1. Dr. Kamel ATTAR | Chapter 5: Network analysis | Critical Path Analysis
  • 77.
    23 Introduction and definitions Situationsin network diagram Crtical Path examples Example 1 Example 2 Example 3 Activity A B C D E F G H I J K L M N Activity Predecessor - A B C C E D E, G C F, I J J H K, L Duration (in Weeks) 2 4 10 6 4 5 7 8 7 8 4 5 2 6 1. Dr. Kamel ATTAR | Chapter 5: Network analysis | Critical Path Analysis
  • 78.
    23 Introduction and definitions Situationsin network diagram Crtical Path examples Example 1 Example 2 Example 3 Activity A B C D E F G H I J K L M N Activity Predecessor - A B C C E D E, G C F, I J J H K, L Duration (in Weeks) 2 4 10 6 4 5 7 8 7 8 4 5 2 6 1. Dr. Kamel ATTAR | Chapter 5: Network analysis | Critical Path Analysis
  • 79.
    23 Introduction and definitions Situationsin network diagram Crtical Path examples Example 1 Example 2 Example 3 Activity A B C D E F G H I J K L M N Activity Predecessor - A B C C E D E, G C F, I J J H K, L Duration (in Weeks) 2 4 10 6 4 5 7 8 7 8 4 5 2 6 1. Dr. Kamel ATTAR | Chapter 5: Network analysis | Critical Path Analysis
  • 80.
    23 Introduction and definitions Situationsin network diagram Crtical Path examples Example 1 Example 2 Example 3 Activity A B C D E F G H I J K L M N Activity Predecessor - A B C C E D E, G C F, I J J H K, L Duration (in Weeks) 2 4 10 6 4 5 7 8 7 8 4 5 2 6 1. Dr. Kamel ATTAR | Chapter 5: Network analysis | Critical Path Analysis
  • 81.
    23 Introduction and definitions Situationsin network diagram Crtical Path examples Example 1 Example 2 Example 3 Activity A B C D E F G H I J K L M N Activity Predecessor - A B C C E D E, G C F, I J J H K, L Duration (in Weeks) 2 4 10 6 4 5 7 8 7 8 4 5 2 6 1. Dr. Kamel ATTAR | Chapter 5: Network analysis | Critical Path Analysis
  • 82.
    24 Introduction and definitions Situationsin network diagram Crtical Path examples Example 1 Example 2 Example 3 2. Dr. Kamel ATTAR | Chapter 5: Network analysis | Critical Path Analysis
  • 83.
    24 Introduction and definitions Situationsin network diagram Crtical Path examples Example 1 Example 2 Example 3 2. Dr. Kamel ATTAR | Chapter 5: Network analysis | Critical Path Analysis
  • 84.
    24 Introduction and definitions Situationsin network diagram Crtical Path examples Example 1 Example 2 Example 3 2. Dr. Kamel ATTAR | Chapter 5: Network analysis | Critical Path Analysis
  • 85.
    25 Introduction and definitions Situationsin network diagram Crtical Path examples Example 1 Example 2 Example 3 +t −→ −t ←− Activity Normal Earliest Time (TE) Latest Time (TL) Total Float Name Time Start (ES) Finish (EF) Start (LS) Finish (LF) ES − LS A 2 0 2 0 2 0 B 4 2 6 2 6 0 C 10 6 16 6 16 0 D 6 16 22 21 27 0 E 4 16 20 16 20 6 F 5 20 25 20 25 11 G 7 22 29 27 34 8 H 8 29 37 34 42 0 I 7 16 33 18 25 4 J 8 25 33 25 33 6 K 4 33 37 34 38 0 L 5 33 38 33 38 9 M 2 37 39 42 44 4 N 6 38 44 38 44 0 Dr. Kamel ATTAR | Chapter 5: Network analysis | Critical Path Analysis
  • 86.
    26 Introduction and definitions Situationsin network diagram Crtical Path examples Example 1 Example 2 Example 3 c. d. The total time required to complete the project is 44 weeks. Dr. Kamel ATTAR | Chapter 5: Network analysis | Critical Path Analysis
  • 87.