The document outlines the steps for using network techniques to plan, schedule, and monitor projects. It describes planning the project by analyzing activities, showing their sequence on a network diagram, estimating activity durations, and identifying the critical path. It also discusses scheduling the project based on the critical path and updating the schedule during project execution. Sample work breakdown structures, precedence relationships, network diagrams, and activity time estimates are provided as examples.


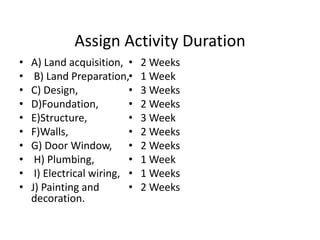


![• Expected Time = [(Optimistic Time + 4 x Most
likely Time + Pessimistic Time)]/6
• σ2 = [(Pessimistic Time - Optimistic Time)/6]2](https://image.slidesharecdn.com/networkscheduling-160312210908/85/Network-scheduling-14-320.jpg)


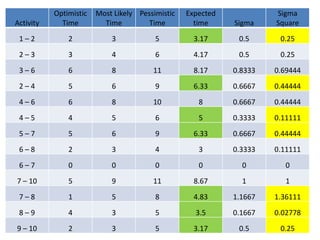
![• Expected Time = [(Optimistic Time + 4 x Most
likely Time + Pessimistic Time)]/6
• σ2 = [(Pessimistic Time - Optimistic Time)/6]2](https://image.slidesharecdn.com/networkscheduling-160312210908/85/Network-scheduling-19-320.jpg)


![Project Feasibility [DECEMBER 2006]](https://cdn.slidesharecdn.com/ss_thumbnails/projectfeasibilitydecember2006-130516112918-phpapp02-thumbnail.jpg?width=640&height=640&fit=bounds)


