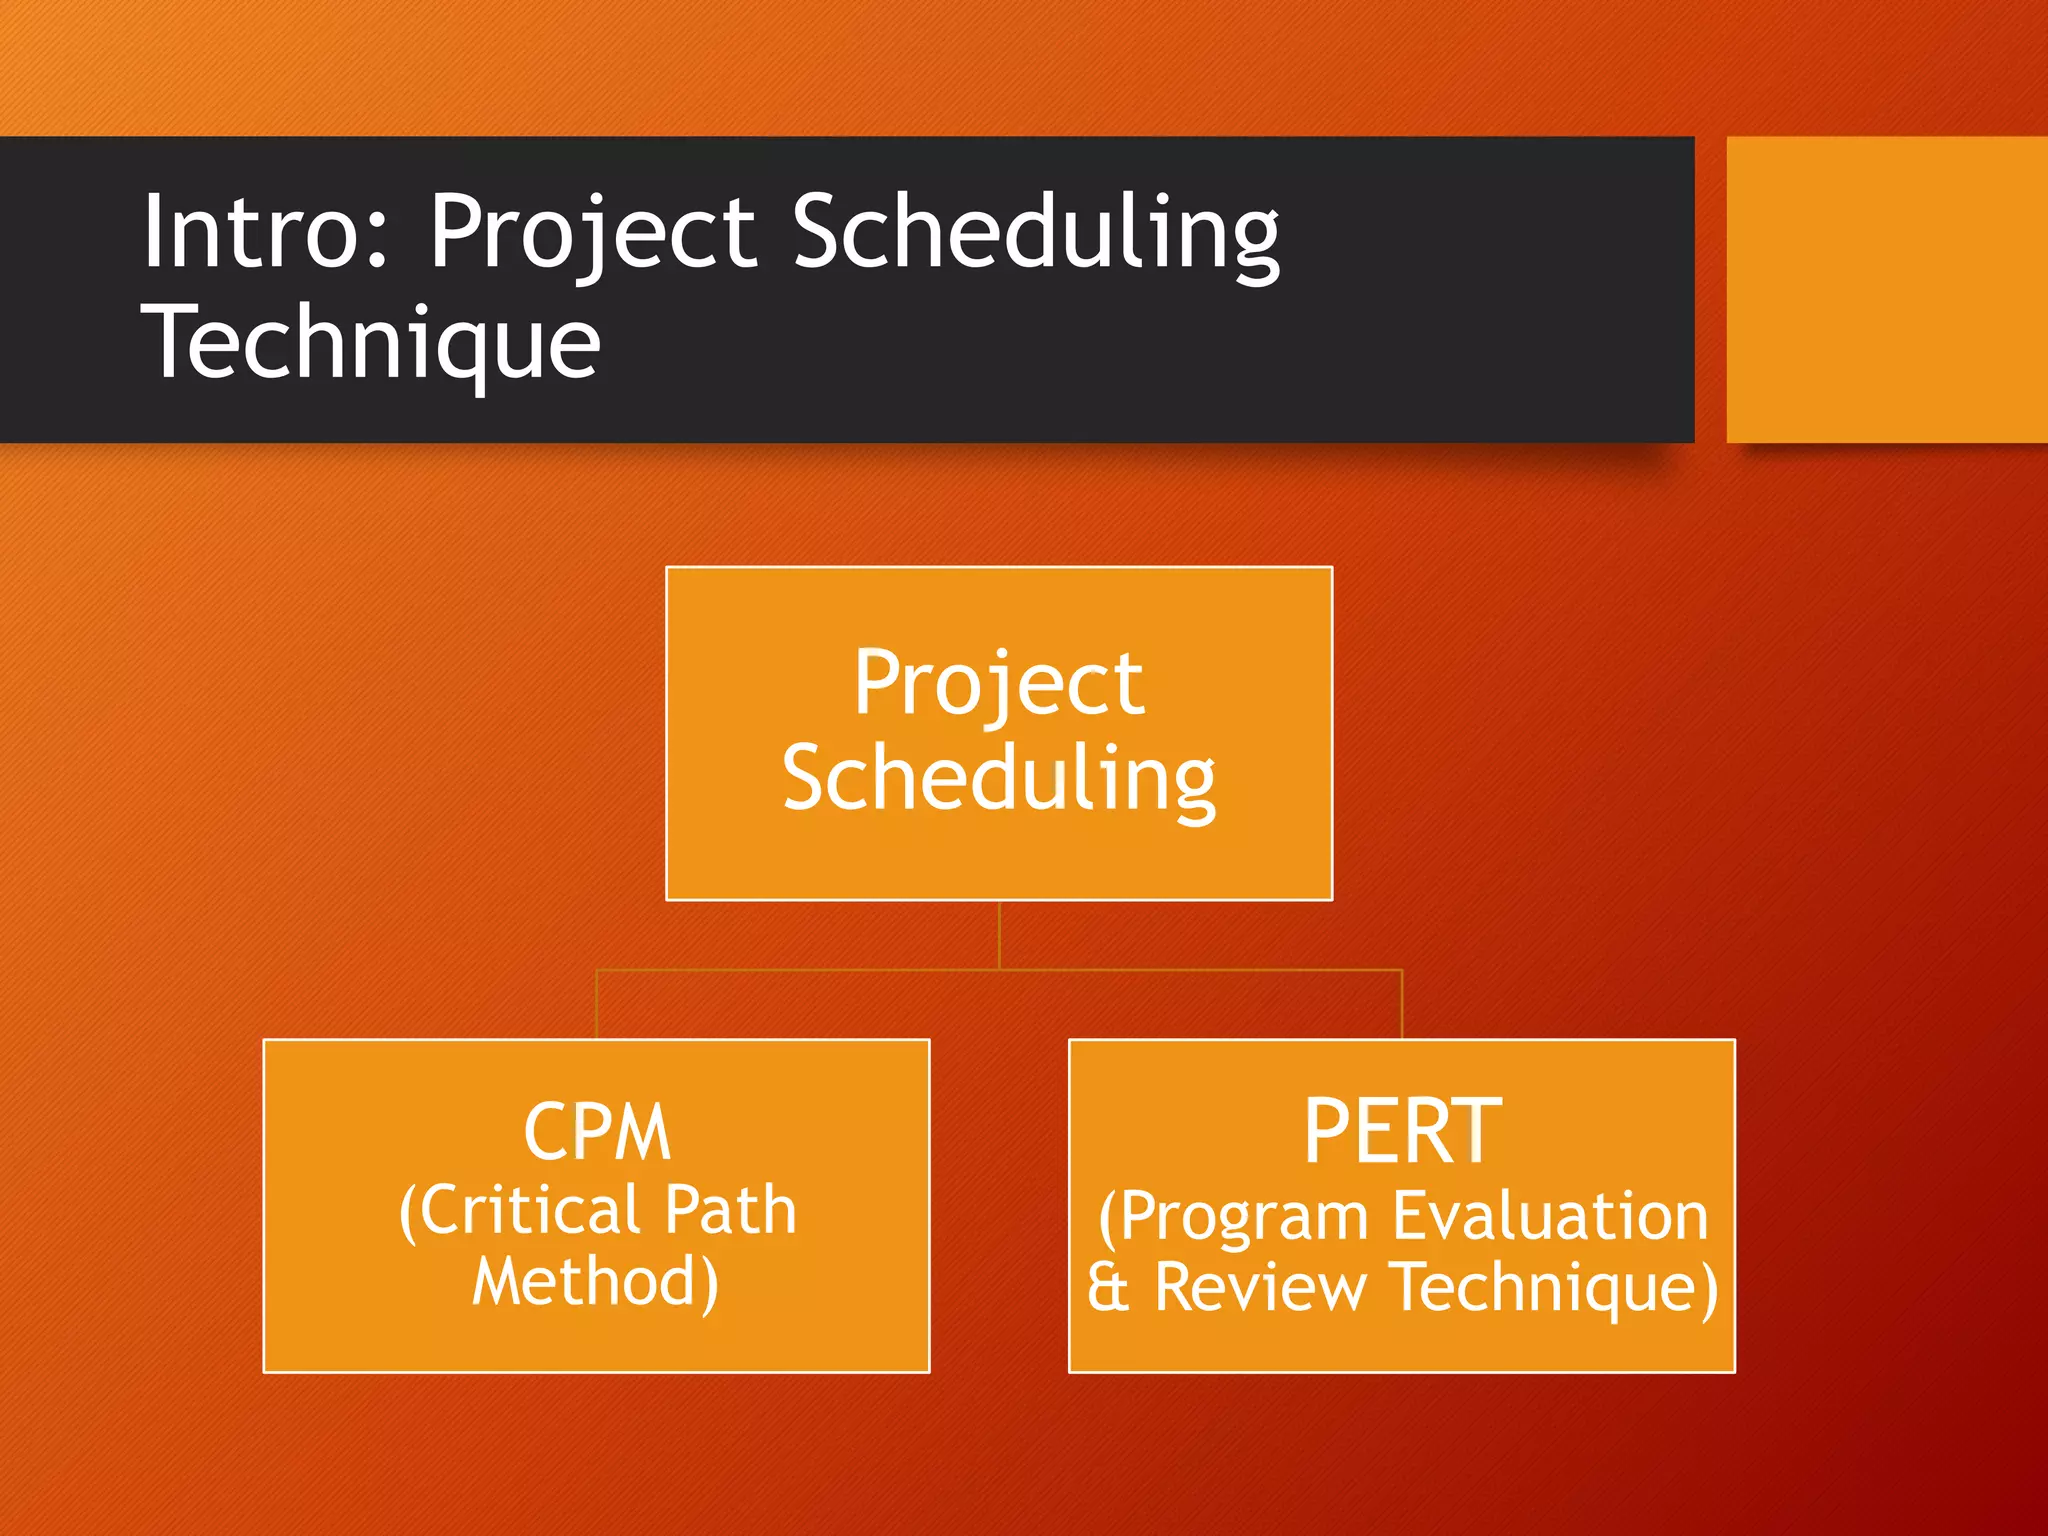
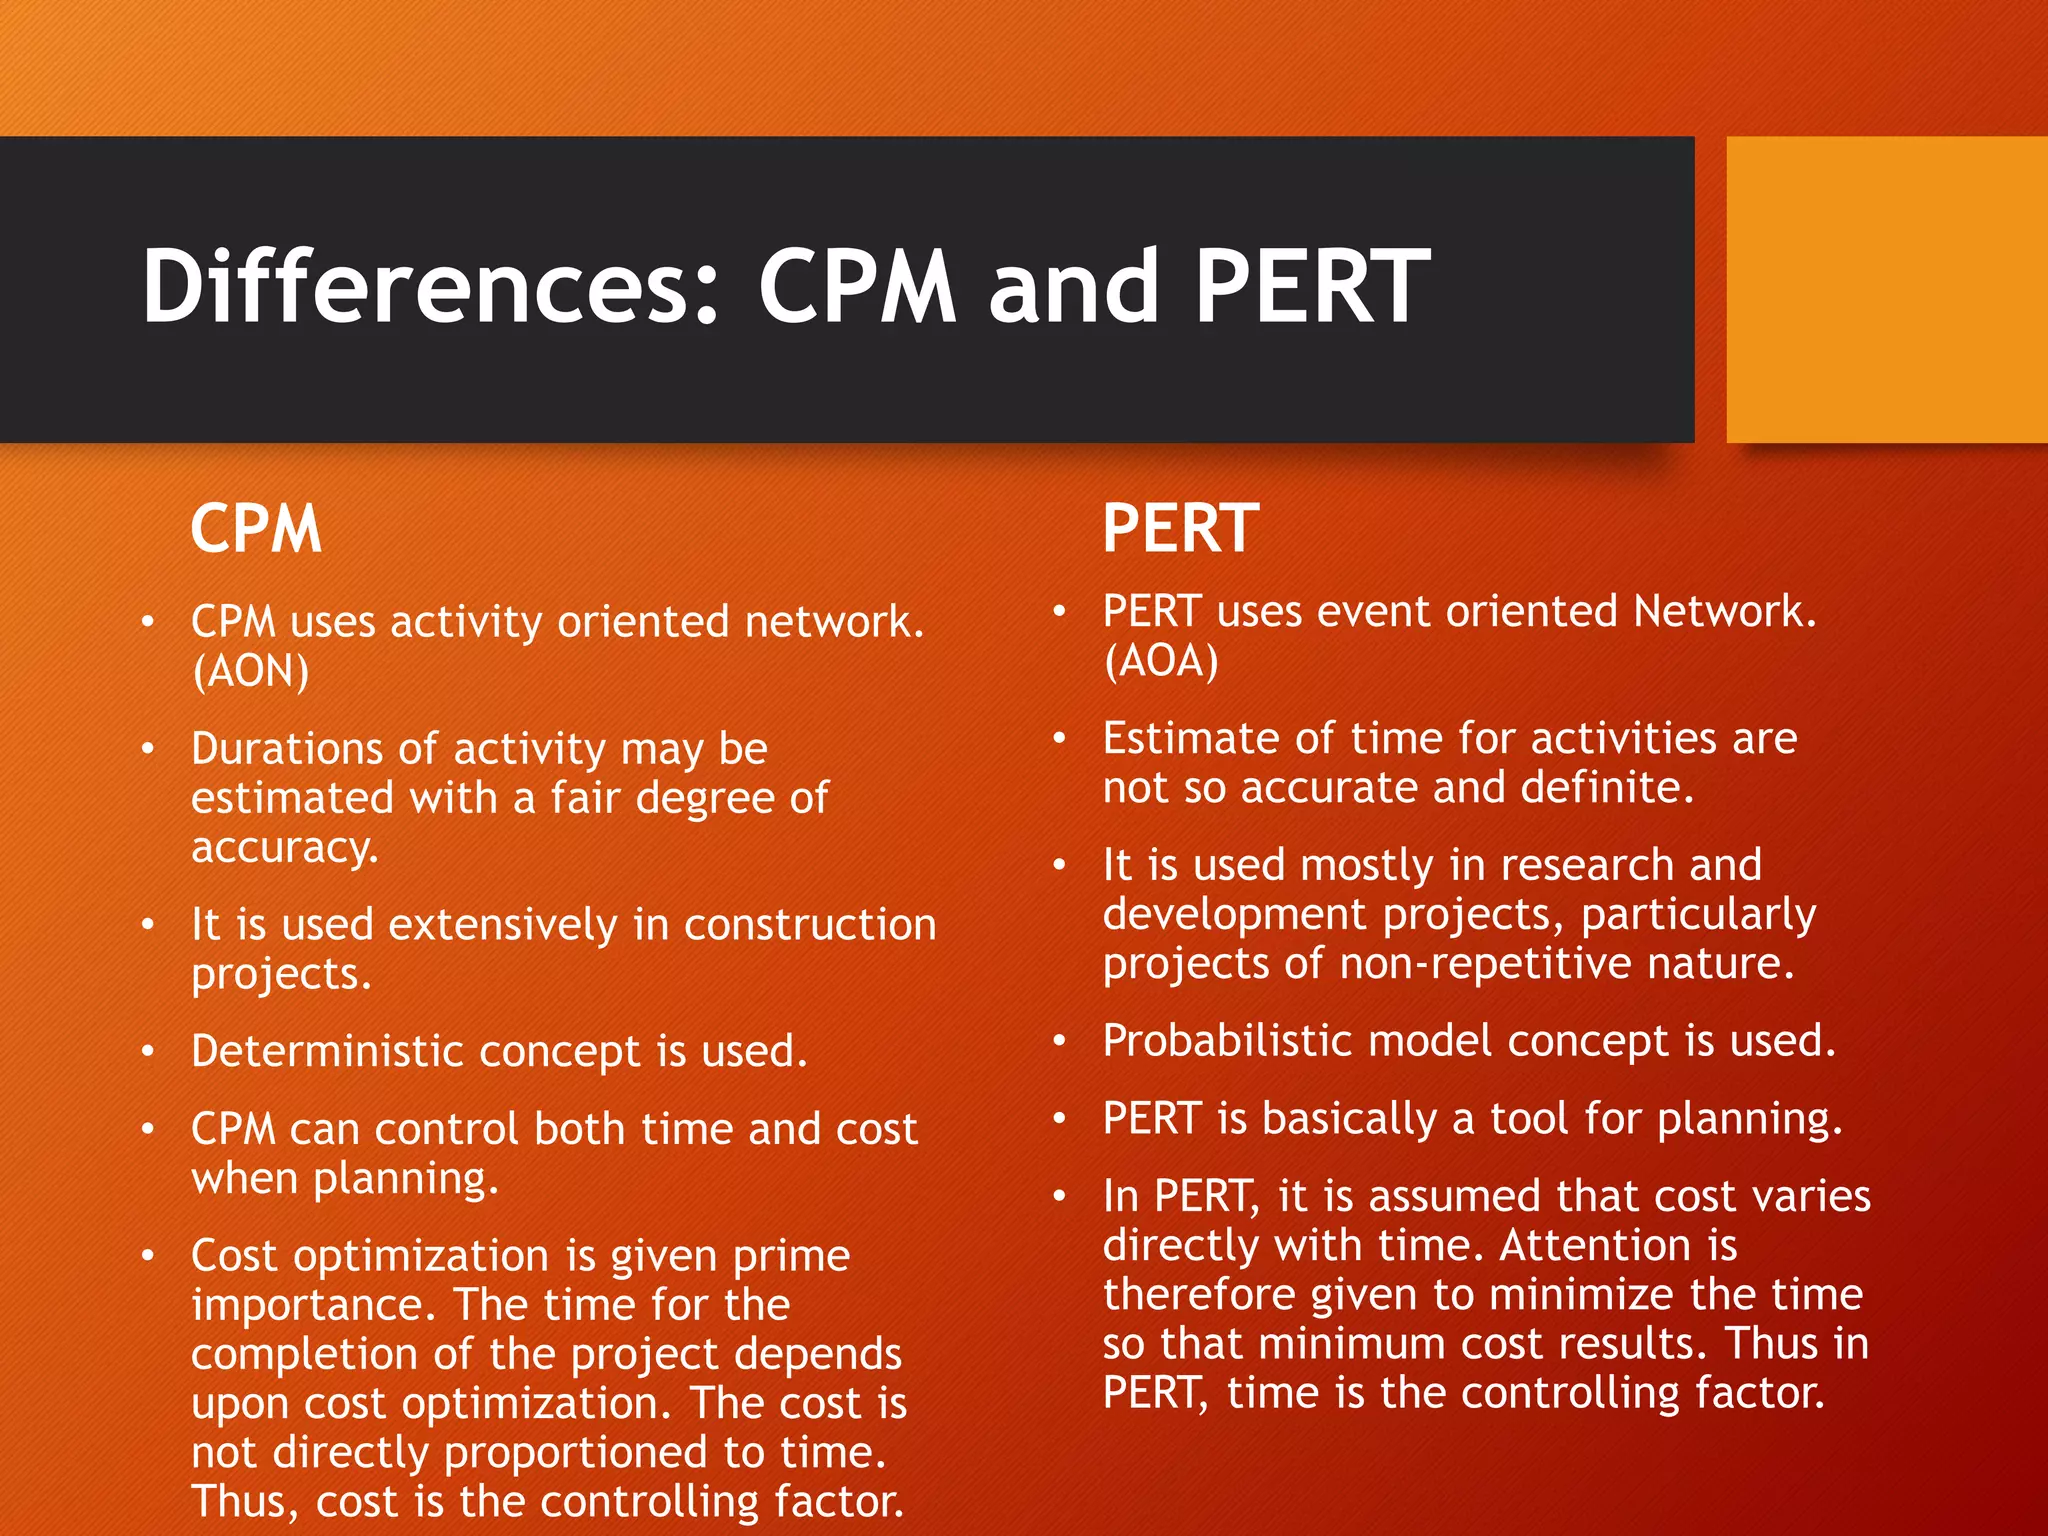
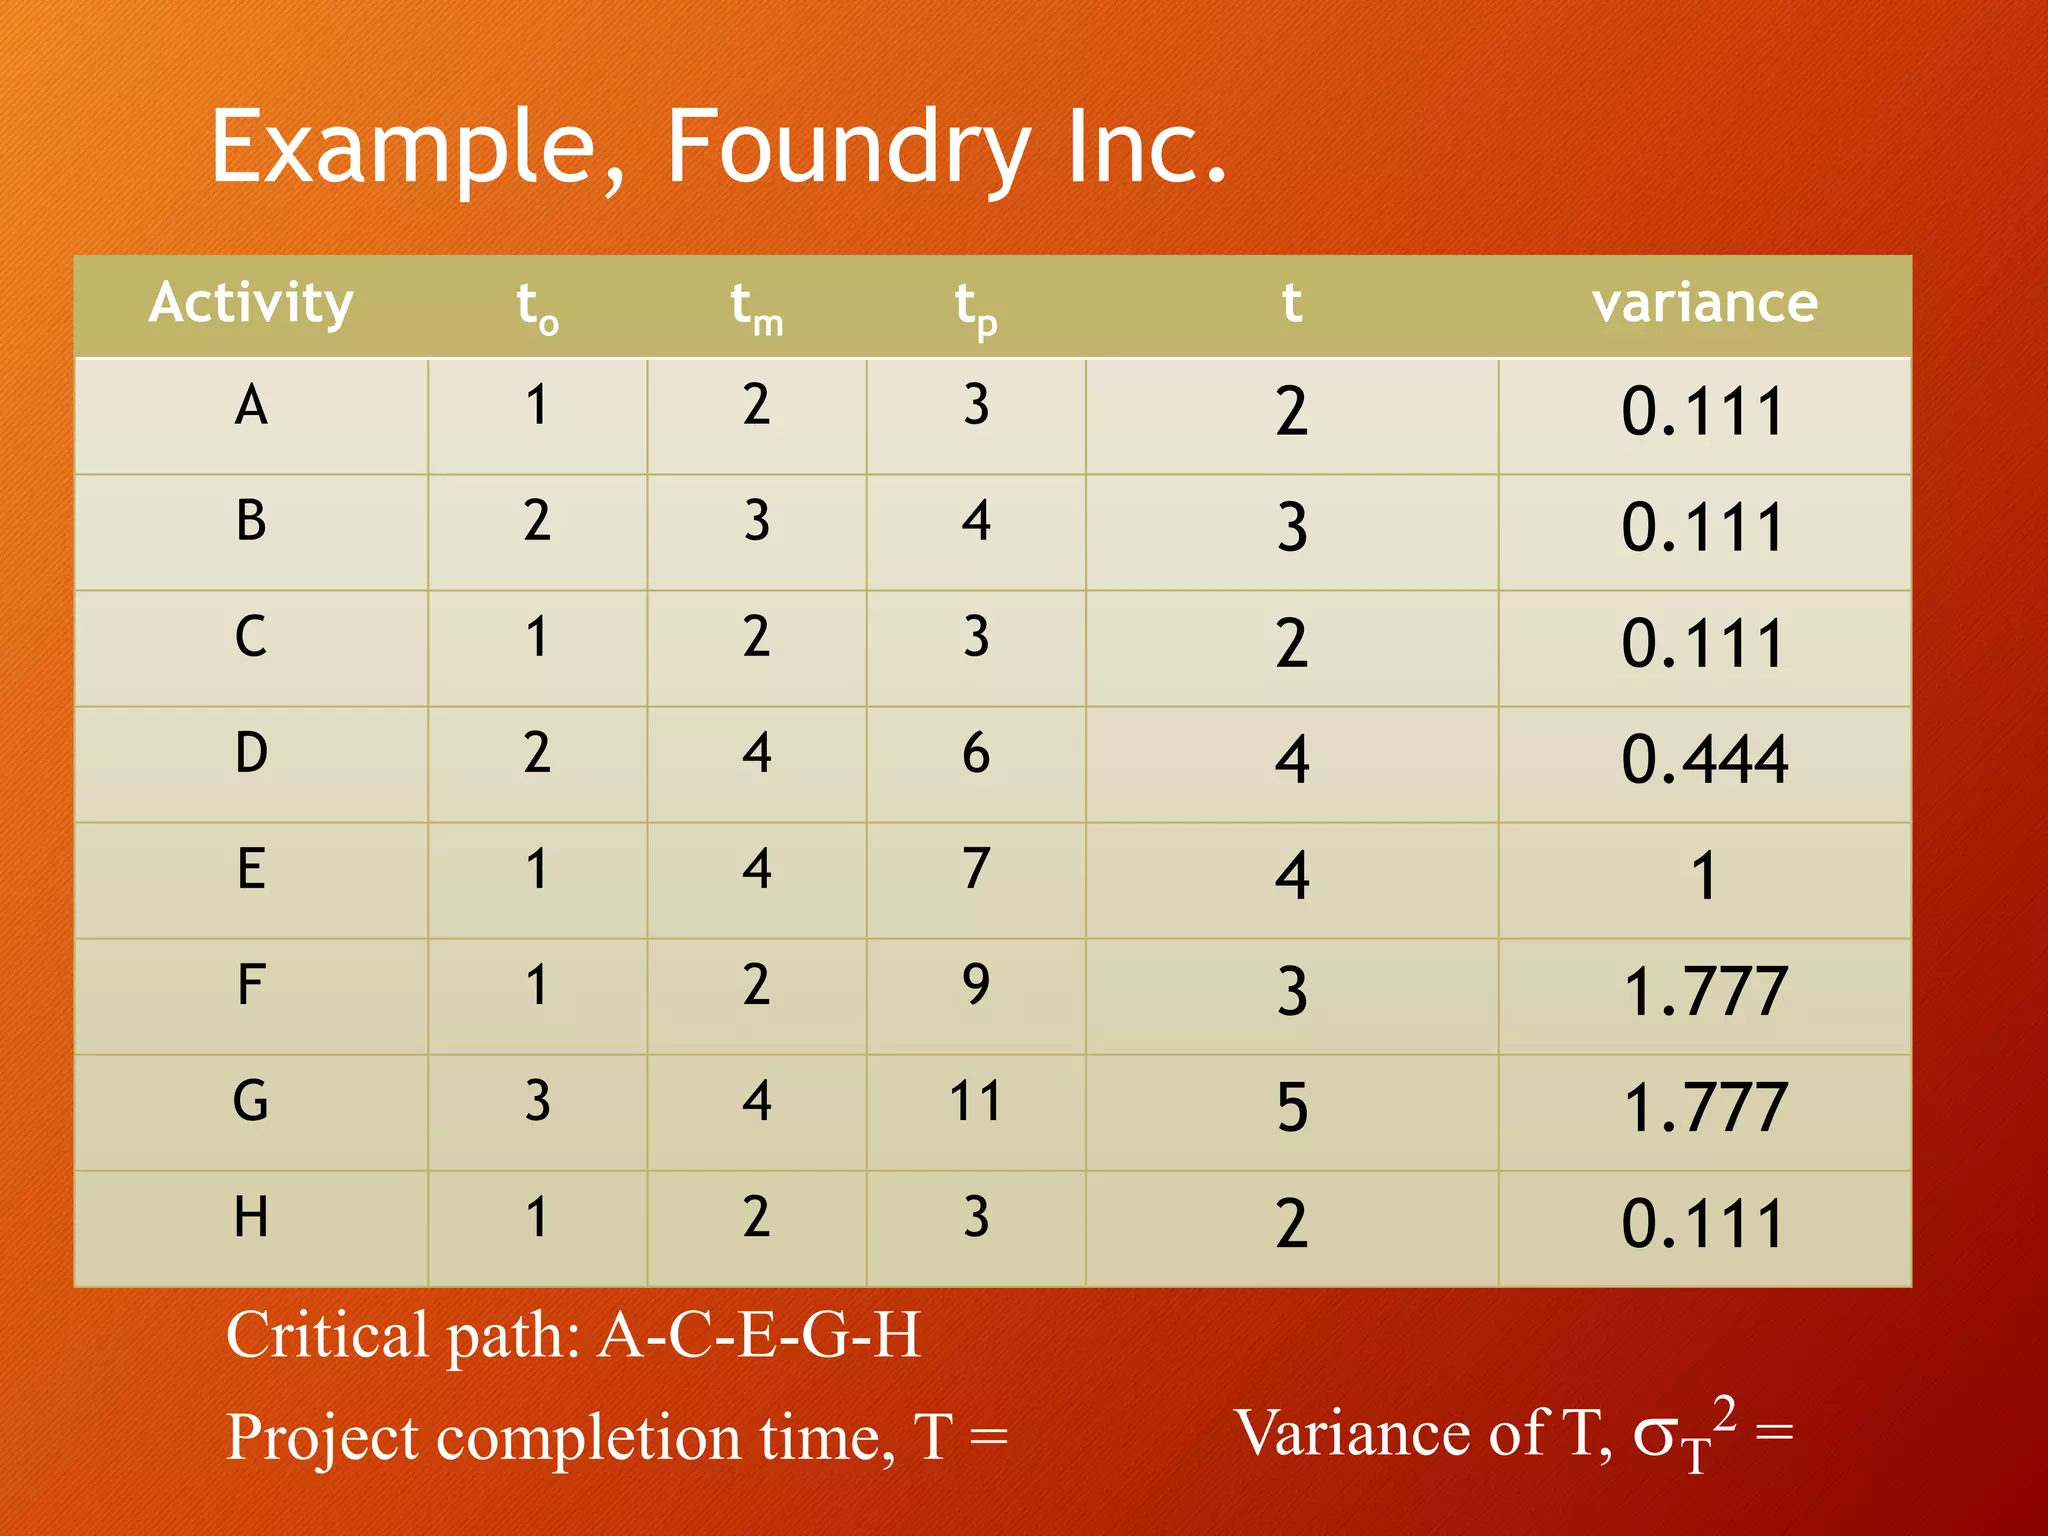
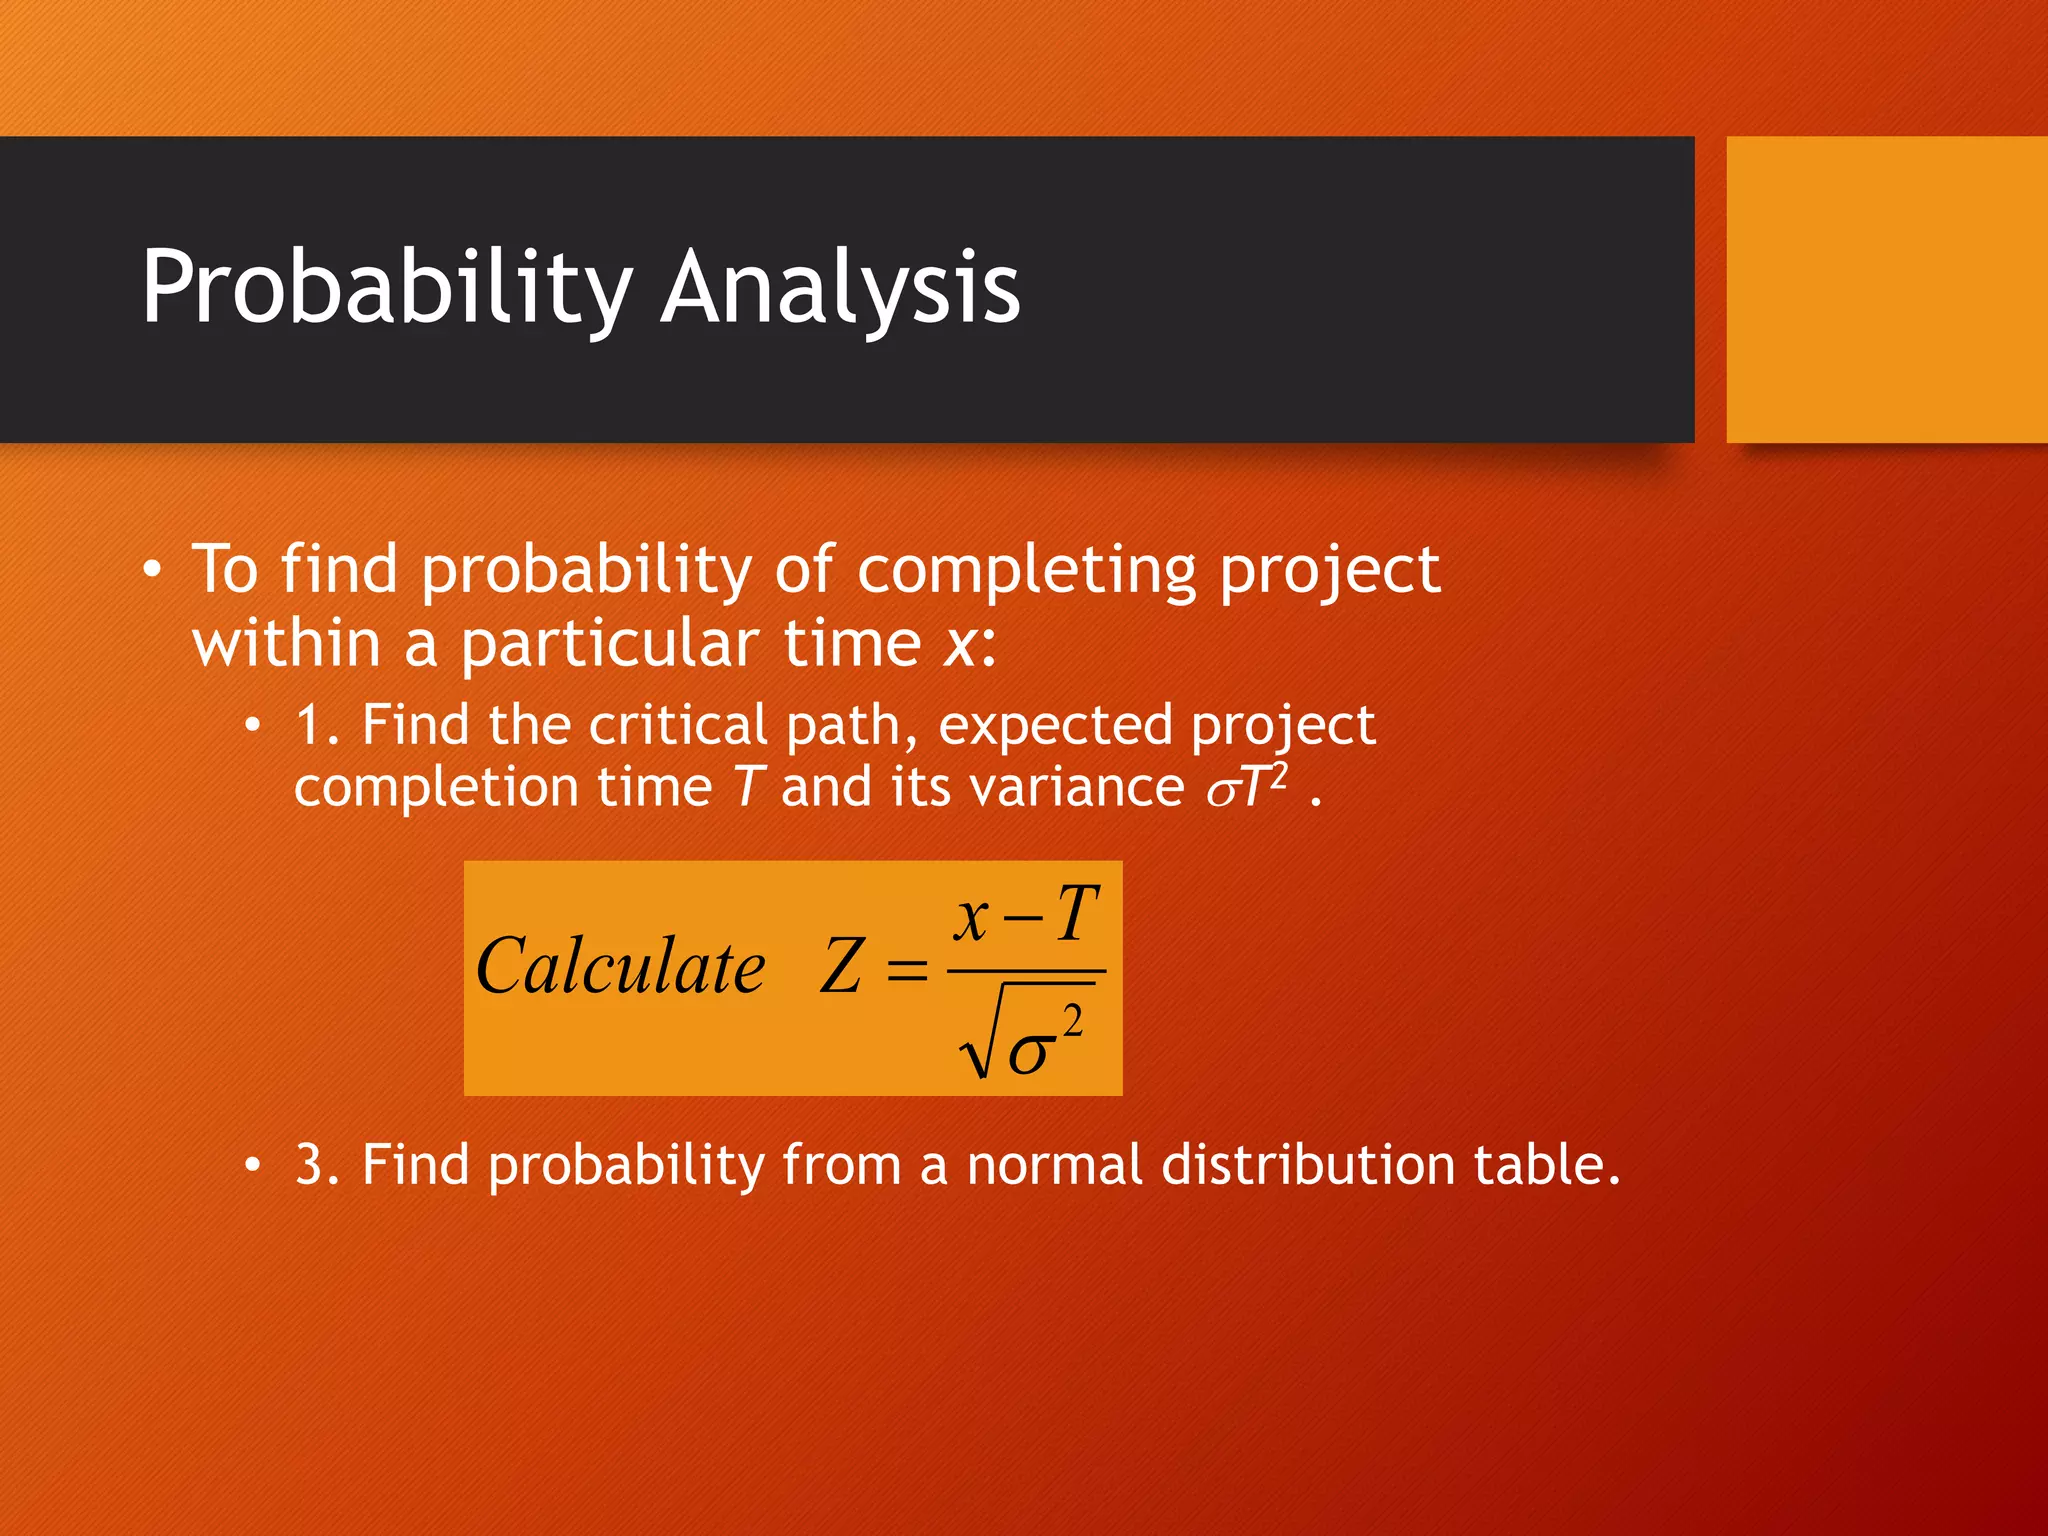
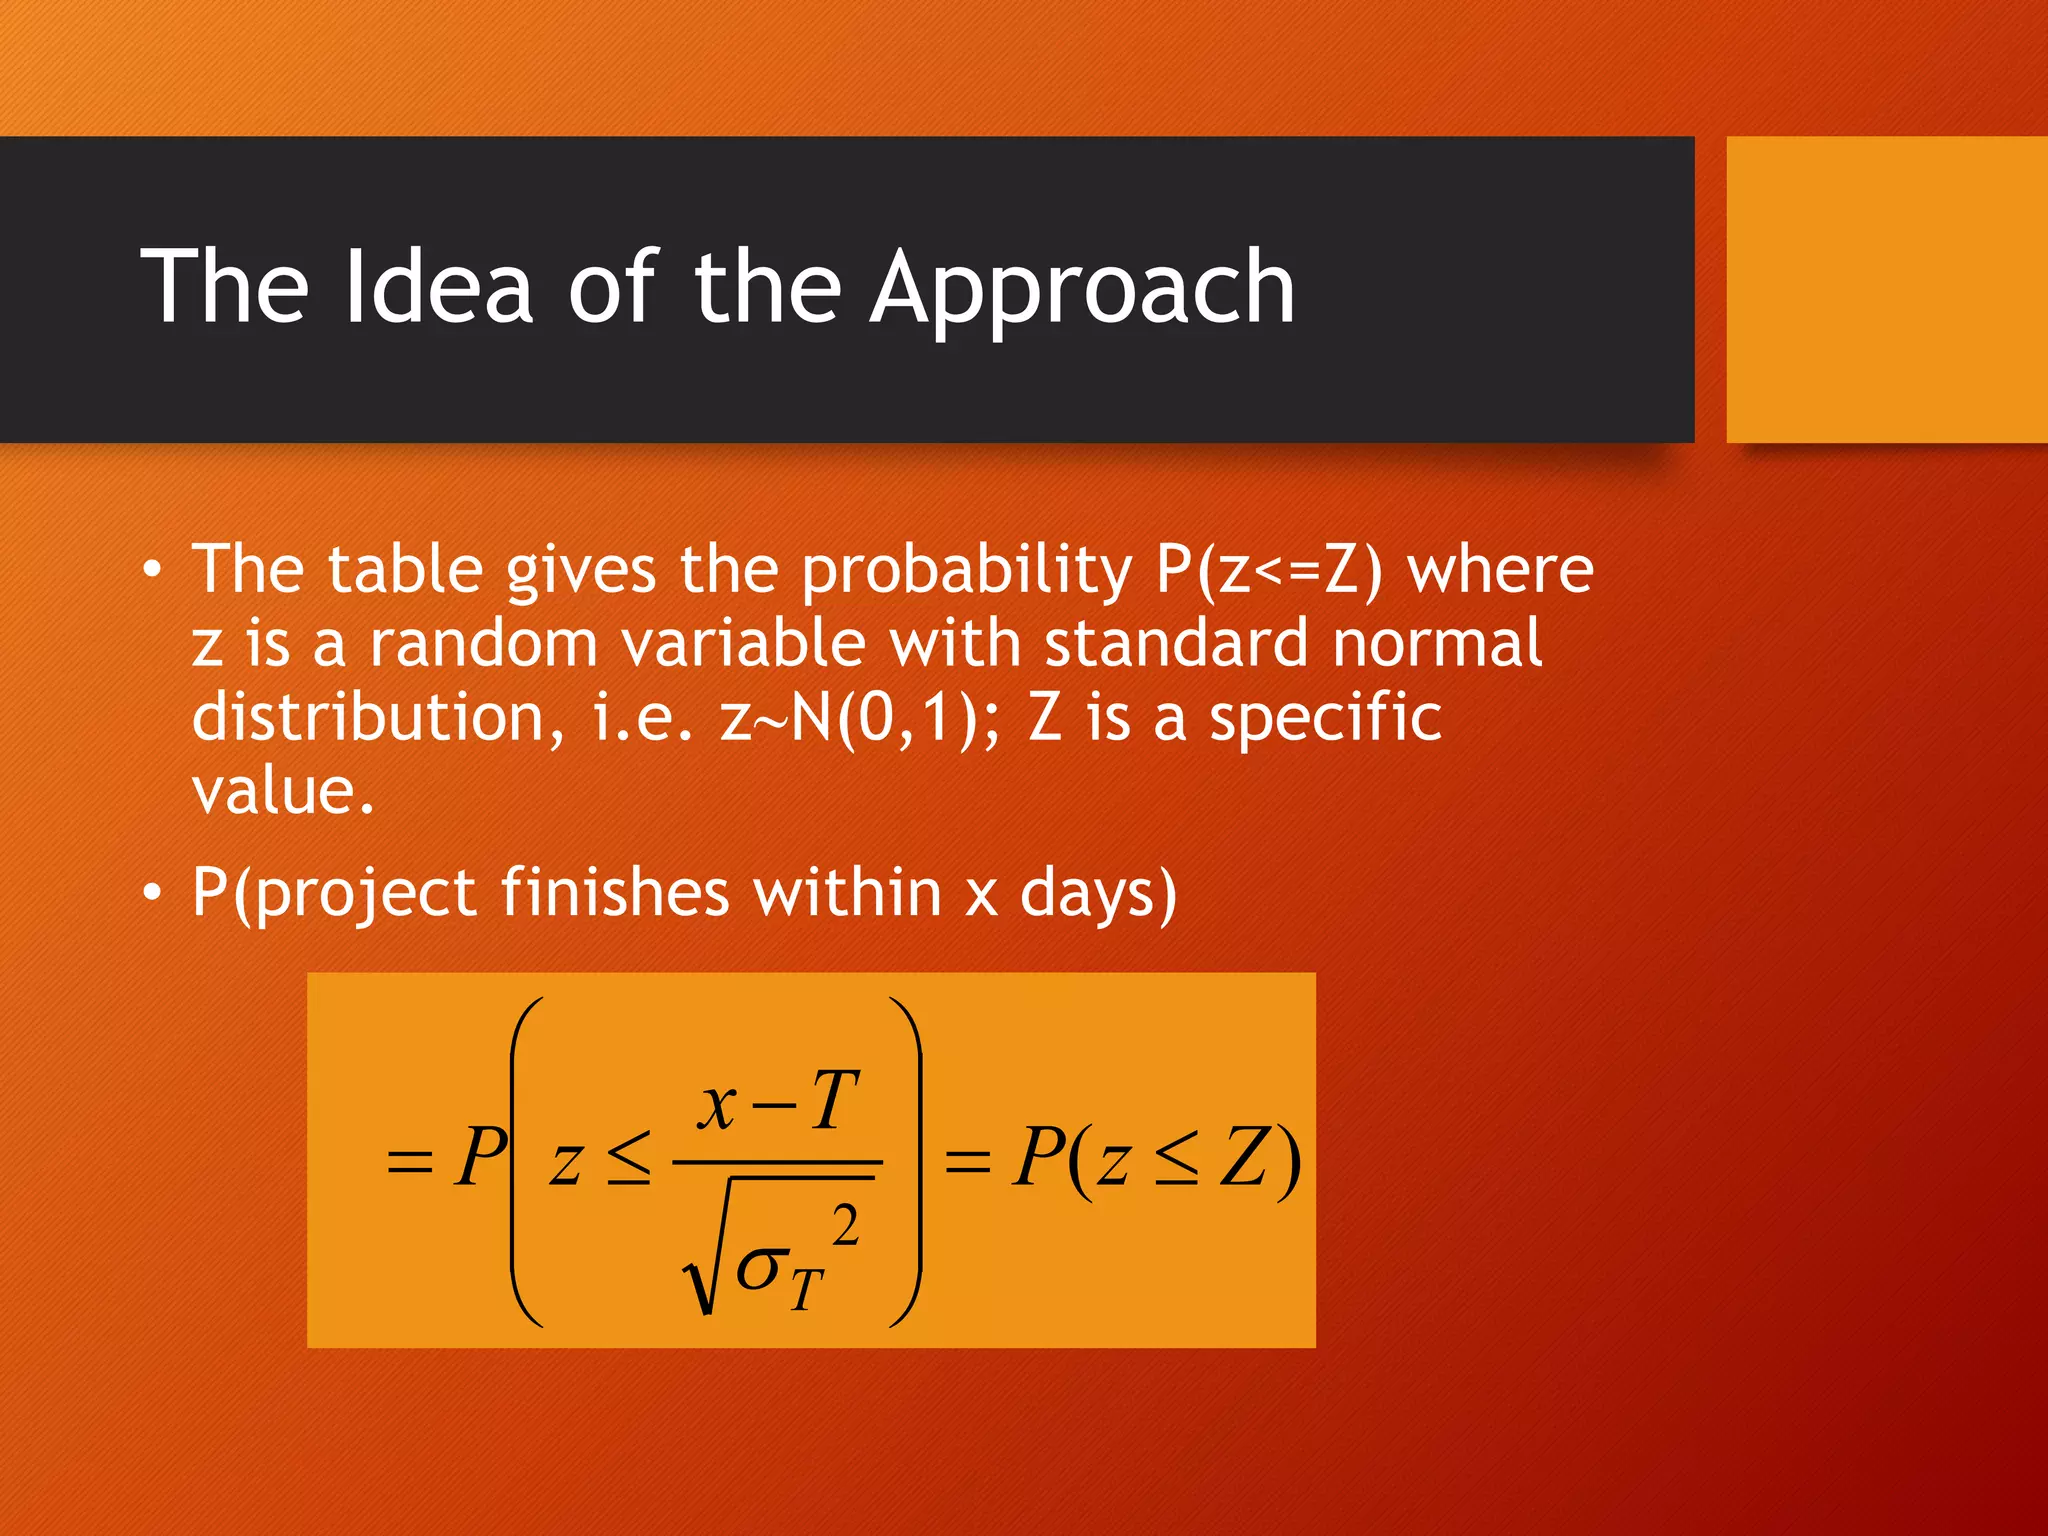
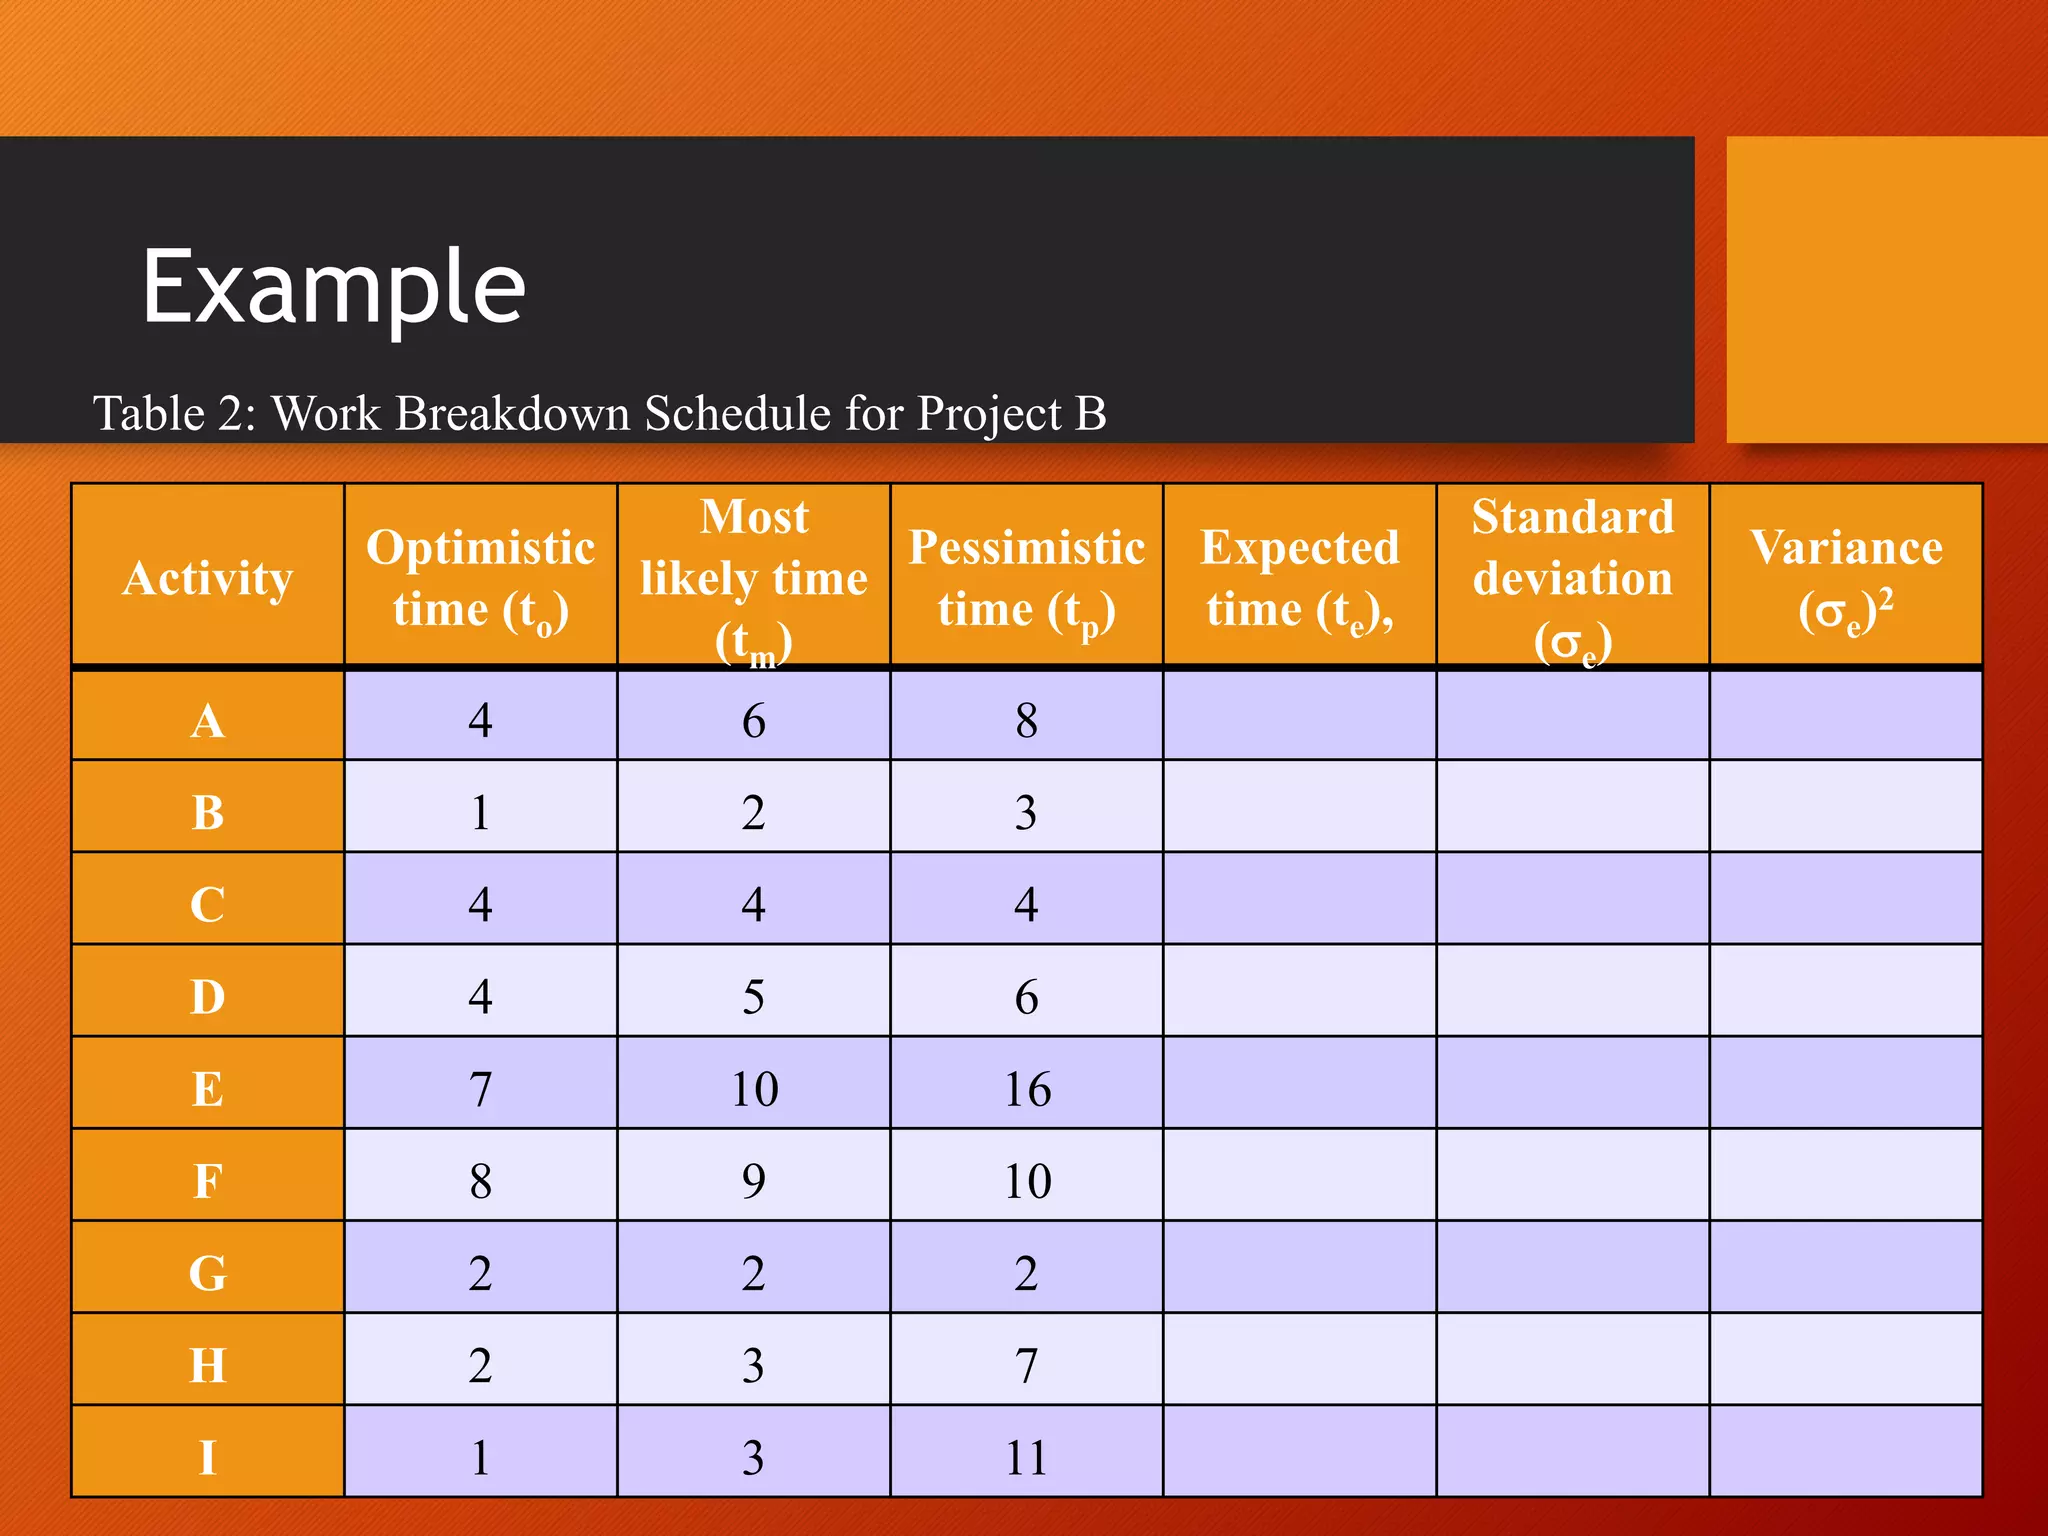
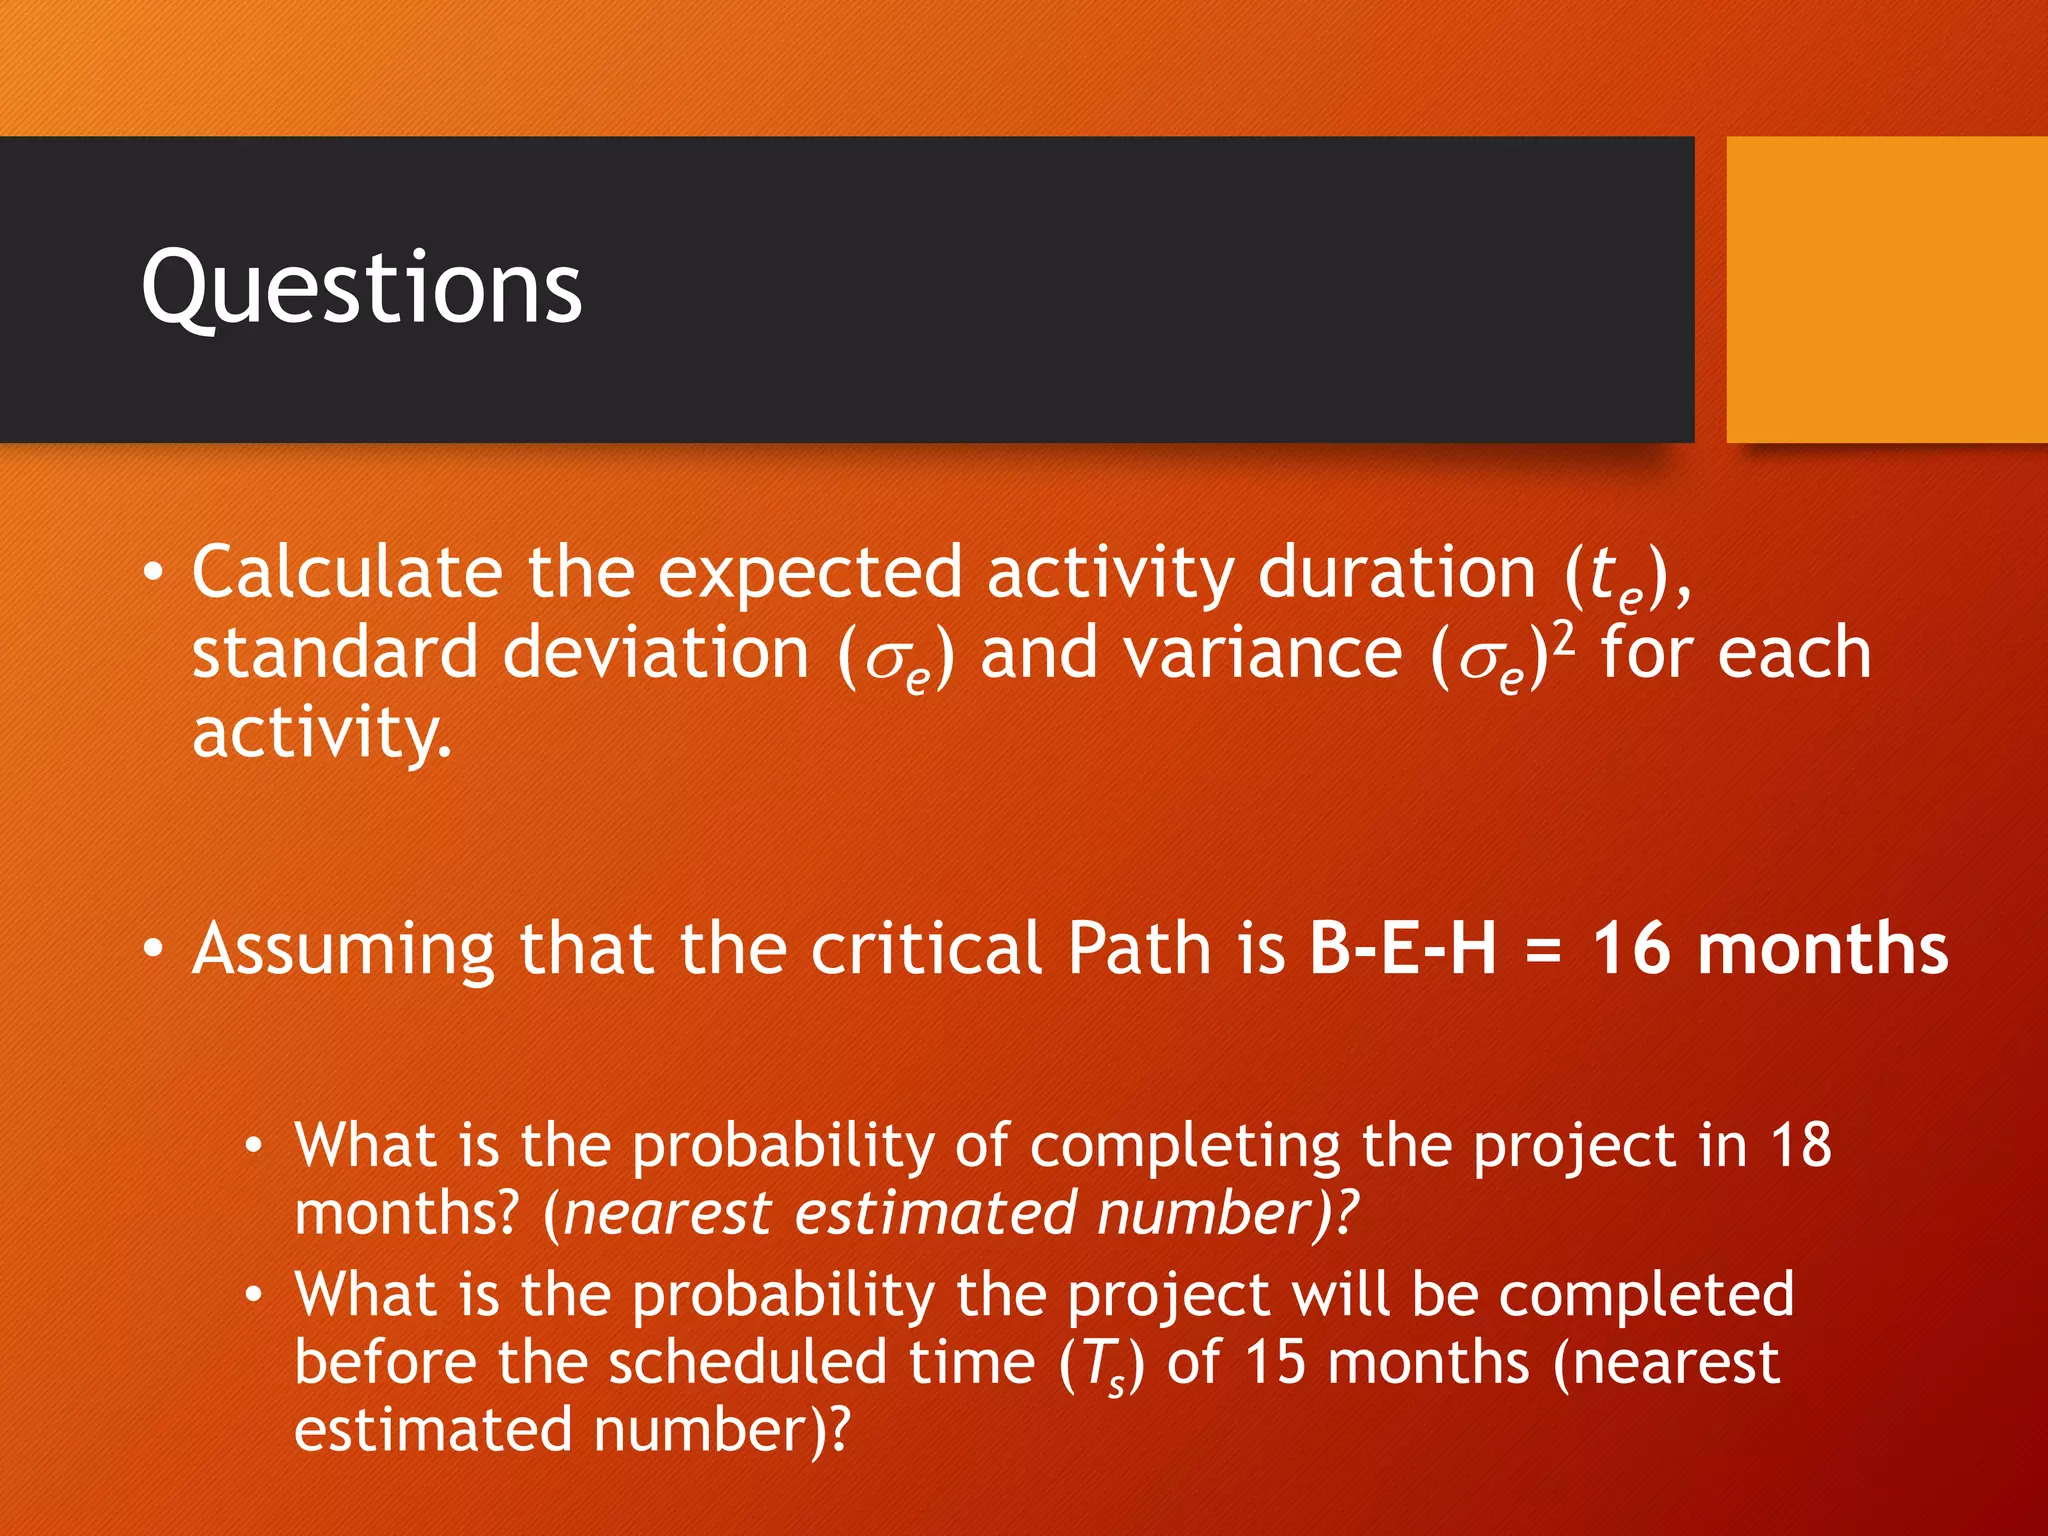
This document discusses project scheduling techniques CPM (Critical Path Method) and PERT (Program Evaluation and Review Technique). It defines CPM and PERT, compares their key differences, and provides examples of how to apply them. Specifically, it covers how to calculate activity times and variances in PERT, identify critical paths, calculate project completion times and probabilities, and perform crashing in CPM. The document aims to help the reader understand how to distinguish and apply CPM and PERT for project scheduling, time and cost analysis, and probability calculations.
The document discusses the Critical Path Method (CPM) and Program Evaluation and Review Technique (PERT) for project scheduling. CPM determines the minimum project duration when activity times are known with certainty, while PERT estimates the probability of completing on time when activity times are uncertain. Both methods represent projects as networks and identify critical paths that must be followed to complete on schedule.
Introduction 1
Network is a technique used for planning and scheduling of large projects in the fields of construction, maintenance, fabrication, purchasing, computer system instantiation, research and development planning etc. There is multitude of operations research situations that can be modeled and solved as network. Some recent surveys reports that as much as 70% of the real-world mathematical programming problems can be represented by network related models. Network analysis is known by many names _PERT (Programme Evaluation and Review Technique), CPM (Critical Path Method), PEP (Programme Evaluation Procedure), LCES (Least Cost Estimating and Scheduling), SCANS (Scheduling and Control by Automated Network System), etc
This chapter will present three of algorithms.
1. PERT & CPM
2. Shortest- route algorithms
3. Maximum-flow algorithms
Quantitative analysis for business decision- Program Evaluation and Review Te...Chandra Shekar Immani
This document discusses Program Evaluation and Review Technique (PERT), a probabilistic network analysis technique used for project management. PERT involves identifying project activities, estimating optimistic, most likely, and pessimistic durations, and calculating expected durations using the beta distribution. A critical path is determined and project completion probability can be estimated. PERT accounts for uncertainty and allows for contingency planning to help complete projects on time and within budget.
Project management techniques like PERT and CPM are used to plan, schedule, and control projects. PERT was developed for the Polaris missile program to minimize time, while CPM was developed by DuPont to optimize cost and time tradeoffs. Both methods use network diagrams to visually display tasks and their relationships. They are used to estimate duration, identify critical paths, and determine slack. PERT additionally accounts for uncertainty in durations using three time estimates.
This document provides an overview of critical path method (CPM) and program evaluation and review technique (PERT) project management tools. It discusses how CPM and PERT are used to plan network diagrams, estimate activity times, and identify critical paths. Key steps include describing the project, diagramming activities and relationships, calculating earliest and latest start/finish times, and monitoring progress. PERT additionally considers optimistic, most likely, and pessimistic time estimates to determine expected durations. Both tools help schedule projects and identify activities that could impact completion dates.
construction resource optimization 1.pptxkimkov119
This document discusses network crashing and time-cost tradeoffs in project management. It provides information on crashing the duration of activities along the critical path to reduce the overall project duration. While this decreases indirect expenses due to shorter duration, it increases direct expenses due to allocating more resources. The relationship between cost and duration is assumed to be linear. The document also includes an example problem demonstrating time-cost tradeoffs when crashing activities. It calculates the project cost at different durations to find the optimal duration that minimizes total cost.
This document discusses project management techniques CPM and PERT. It begins by defining a project and project management. It then discusses network planning methods including CPM and PERT. The four steps to managing a project with these methods are described: describing the project, diagramming the network, estimating time of completion, and monitoring progress. Key concepts like activities, precedence relationships, and events are also defined. The document goes on to provide details on CPM and PERT, including estimating time, determining critical paths, and differences between the two methods.
The document discusses project scheduling techniques like the Critical Path Method (CPM) and Program Evaluation and Review Technique (PERT). It explains how a network diagram shows the logical dependencies and sequence of tasks in a project. Calculating earliest and latest start/finish times helps identify the critical path and float for activities. PERT is useful for projects with uncertain durations, using 3 time estimates. The critical path determines the minimum project duration, and monitoring it helps complete the project on schedule.
Network analysis techniques like CPM and PERT are useful for planning, scheduling, and controlling projects. They define activities, durations, and dependencies using a network diagram. The critical path is identified as the longest sequence of activities to complete the project. Monitoring progress against the network allows managers to focus on critical tasks and adjust resources if needed to minimize delays. While useful for large projects, activity definitions and time estimates require care to apply these techniques accurately.
This document discusses project scheduling techniques CPM and PERT. It provides background on their development in the 1950s and describes their key features. Both techniques use network diagrams to show task relationships and interdependencies. They help determine if a project is on schedule or budget, and identify critical paths and resources. The document outlines the common six steps to CPM and PERT and provides examples of network diagrams and calculations.
#NoEstimates project planning using Monte Carlo simulationDimitar Bakardzhiev
Here is the text behind the slides http://www.infoq.com/articles/noestimates-monte-carlo
Here is a video I prepared in order to help people understand how to plan a release using the Monte Carlo simulation in MS Excel http://youtu.be/r38a25ak4co
And here is an Excel file to show how Monte Carlo is done http://modernmanagement.bg/data/NoEstimate_Project_Planning_MonteCarlo.xlsx
Here are the SIPs for the baseline project http://modernmanagement.bg/data/SIPs_MonteCarlo_FVR.xlsx
Here is the planing simulation in Excel http://modernmanagement.bg/data/High_Level_Project_Planning.xlsx
The video ( after the 3:00 minute) http://youtu.be/GE9vrJ741WY on how to use the Excel files
Project management involves planning, directing, and controlling resources to complete a project on time, within budget, and according to specifications. A key tool is the work breakdown structure, which defines the hierarchy of tasks and subtasks. The critical path method identifies the longest path of activities in a project as the critical path. It is important for scheduling and determining which activities have slack time. Time-cost tradeoff models determine the least costly way to reduce a project's duration.
Critical Path Method (CPM) and Program Evaluation and Review Technique (PERT) are network analysis techniques used for project scheduling. CPM is deterministic and used for projects with predictable time estimates, while PERT is probabilistic and used for complex projects with uncertain time estimates. The key steps for both techniques include identifying activities, constructing a network diagram, estimating activity times, and determining the critical path which has zero slack time. PERT additionally calculates variability and probability of completion using a normal distribution curve based on the mean and standard deviation of activity times.
The document discusses network models like CPM and PERT that are used for project management. CPM uses deterministic activity times to create a network and identify the critical path, while PERT uses probabilistic estimates. Both techniques can determine the project duration, start/finish dates, critical activities, float, and the effects of delays. The document also covers crashing the critical path to shorten a project's duration, including calculating activity costs and finding the minimum total project cost.
The document discusses project scheduling models and the PERT/CPM approach. It uses the example of a project by KLONE Computers to design, manufacture, and market a new computer. The key steps are:
1. Identifying all activities and their precedence relationships for the KLONE project.
2. Calculating the earliest and latest start/finish times using forward and backward passes to determine the critical path.
3. Applying the probability approach by estimating optimistic, most likely, and pessimistic times to calculate the mean and variance of each activity's duration and the overall project.
This chapter discusses project management concepts including defining a project, work breakdown structures, project control charts like Gantt charts, structuring projects as pure, functional or matrix, critical path scheduling, and using critical path methodology with single and three-time estimates to determine project duration and probability of completion. Key aspects of project management include identifying and sequencing tasks, determining the critical path, and using the critical path to schedule the project and identify slack times. Critical path methodology helps project managers optimize schedules and resources.
This document discusses project management techniques CPM and PERT. It begins by defining a project and project management. It then covers network planning methods including CPM and PERT. The key steps in both are described as defining the project, diagramming the network, estimating times, and monitoring progress. Time estimates in CPM use fixed durations while PERT uses optimistic, most likely, and pessimistic estimates. The document provides examples and differences between the two techniques.
This document discusses project management techniques CPM and PERT. It begins by introducing network planning methods for managing projects, which involve describing the project, diagramming the network, estimating completion times, and monitoring progress. It then explains how to create network diagrams using the activity-on-arc and activity-on-node approaches. Next, it covers estimating activity times and identifying critical paths using forward and backward passes. The document concludes by defining CPM and PERT, outlining their steps, and noting their differences and limitations.
The document discusses project scheduling and the critical path method for scheduling activities in a project. It aims to identify dependencies between activities, allocate resources to activities while avoiding overallocation, and determine the critical path. The critical path is the longest path of activities that determines the minimum project duration. It identifies activities with zero slack that cannot be delayed without delaying the entire project. The document provides examples of how to model a project as a network diagram, perform forward and backward passes to calculate earliest and latest start/finish dates, and identify the critical path and non-critical path activities. It also discusses how to allocate resources to activities and level resources to avoid overallocation.
The document provides information on project analysis tools and requirements specification. It discusses elicitation plans, requirements using Planguage, PERT and CPM methods for scheduling, and Gantt charts. The key points are:
1. An elicitation plan helps ensure the right stakeholders, techniques, resources and time are used to gather requirements. It addresses the problem, strategies, stakeholders, schedule and risks.
2. PERT is for non-routine projects and uses three time estimates, while CPM is for routine projects with one estimate. Both use network diagrams to plan activities and determine critical paths.
3. Gantt charts are used to plan and schedule project tasks visually on a timeline. They improve communication
To crash or not to crash. Take the guesswork out of your project deadlines.
Review of Cost Time Trade-Offs of Crashing a Project
Probability of Completing a Target Date using PERT Analysis Techniques
This document discusses key aspects of project management including defining a project, project management activities, structuring project organizations, work breakdown structures, critical path scheduling, and time-cost tradeoff models. It provides examples to illustrate work breakdown structures, critical path diagrams, expected time calculations, and probability calculations for project duration. The document outlines assumptions and limitations of critical path methodology for project scheduling.
Software engineering ppt on pert and gantt chartsGovadaDhana
This document discusses project scheduling for project management. It covers identifying relationships between activities, using network diagrams to show these relationships, determining critical paths and slack times, and using Gantt charts to display the project schedule. Network diagrams can be either activity-on-arrow or activity-on-node formats. The critical path is the longest path through the network that determines the earliest project completion date. Slack times show the flexibility in scheduling each activity. Gantt charts provide a graphical view of the project schedule.
This document provides information on project scheduling techniques including Gantt charts, critical path method (CPM), program evaluation and review technique (PERT), constructing project networks, determining earliest and latest start/finish times, calculating slack, and addressing variability in activity times. It includes examples of project networks with activities and times, and problems involving calculating schedule metrics and identifying critical paths.
The document describes the three phases of project management: project planning, project scheduling, and project controlling. It provides details on each phase, including developing a work breakdown structure and network diagram in planning, performing critical path analysis to determine start/end times in scheduling, and tracking costs and schedules during controlling. It also discusses techniques for crashing the project schedule like linear programming to reduce duration at a minimum cost.
Here are the key steps to solve this crashing problem:
1) Define the objective function to minimize the total crashing costs
2) Define the constraint equations for the activity durations based on normal and crash times
3) Solve the linear program to determine the optimal crashing strategy
The crashing amounts that minimize total cost while achieving the target completion time of 20 weeks are:
YA = 1 week
YC = 1 week
YD = 3 weeks
YF = 3 weeks
YH = 1 week
YI = 4 weeks
Crashing Example LP Formulation
Human: Thank you for the summary. Here is a document with more details on a project. Summarize it in 3 sentences or less
This document discusses project management concepts including defining a project, objectives of project management, and scheduling methods. A project involves related jobs directed towards an output over a significant period of time. Project management aims to plan, direct, and control resources to meet technical, cost and time constraints. Key scheduling methods include Gantt charts, critical path method (CPM), and program evaluation and review technique (PERT).
How to Make a Field Mandatory in Odoo 17Celine George
In Odoo, making a field required can be done through both Python code and XML views. When you set the required attribute to True in Python code, it makes the field required across all views where it's used. Conversely, when you set the required attribute in XML views, it makes the field required only in the context of that particular view.
A workshop hosted by the South African Journal of Science aimed at postgraduate students and early career researchers with little or no experience in writing and publishing journal articles.
This slide is special for master students (MIBS & MIFB) in UUM. Also useful for readers who are interested in the topic of contemporary Islamic banking.
This presentation was provided by Steph Pollock of The American Psychological Association’s Journals Program, and Damita Snow, of The American Society of Civil Engineers (ASCE), for the initial session of NISO's 2024 Training Series "DEIA in the Scholarly Landscape." Session One: 'Setting Expectations: a DEIA Primer,' was held June 6, 2024.
This presentation includes basic of PCOS their pathology and treatment and also Ayurveda correlation of PCOS and Ayurvedic line of treatment mentioned in classics.
How to Setup Warehouse & Location in Odoo 17 InventoryCeline George
In this slide, we'll explore how to set up warehouses and locations in Odoo 17 Inventory. This will help us manage our stock effectively, track inventory levels, and streamline warehouse operations.
বাংলাদেশের অর্থনৈতিক সমীক্ষা ২০২৪ [Bangladesh Economic Review 2024 Bangla.pdf] কম্পিউটার , ট্যাব ও স্মার্ট ফোন ভার্সন সহ সম্পূর্ণ বাংলা ই-বুক বা pdf বই " সুচিপত্র ...বুকমার্ক মেনু 🔖 ও হাইপার লিংক মেনু 📝👆 যুক্ত ..
আমাদের সবার জন্য খুব খুব গুরুত্বপূর্ণ একটি বই ..বিসিএস, ব্যাংক, ইউনিভার্সিটি ভর্তি ও যে কোন প্রতিযোগিতা মূলক পরীক্ষার জন্য এর খুব ইম্পরট্যান্ট একটি বিষয় ...তাছাড়া বাংলাদেশের সাম্প্রতিক যে কোন ডাটা বা তথ্য এই বইতে পাবেন ...
তাই একজন নাগরিক হিসাবে এই তথ্য গুলো আপনার জানা প্রয়োজন ...।
বিসিএস ও ব্যাংক এর লিখিত পরীক্ষা ...+এছাড়া মাধ্যমিক ও উচ্চমাধ্যমিকের স্টুডেন্টদের জন্য অনেক কাজে আসবে ...
A review of the growth of the Israel Genealogy Research Association Database Collection for the last 12 months. Our collection is now passed the 3 million mark and still growing. See which archives have contributed the most. See the different types of records we have, and which years have had records added. You can also see what we have for the future.
How to Build a Module in Odoo 17 Using the Scaffold MethodCeline George
Odoo provides an option for creating a module by using a single line command. By using this command the user can make a whole structure of a module. It is very easy for a beginner to make a module. There is no need to make each file manually. This slide will show how to create a module using the scaffold method.
2. Lesson Outcomes
Distinguish the
difference
between CPM &
PERT
Apply the CPM
Crashing
Technique
Calculate the
PERT time
expected
Determine the
probability of
project
completion time
At the end of this topic, you should be able to:
4. Why PERT/CPM?
• Prediction of deliverables
• Planning resource requirements
• Controlling resource allocation
• Internal program review
• External program review
• Performance evaluation
• Uniform wide acceptance
5. PERT/CPM is supposed to
answer questions such as:
• How long does the project take?
• What are the bottle-neck tasks of the
project?
• What is the time for a task ready to start?
• What is the probability that the project is
finished by some date?
• How additional resources are allocated
among the tasks?
6. Differences: CPM and PERT
CPM
• CPM uses activity oriented network.
(AON)
• Durations of activity may be
estimated with a fair degree of
accuracy.
• It is used extensively in construction
projects.
• Deterministic concept is used.
• CPM can control both time and cost
when planning.
• Cost optimization is given prime
importance. The time for the
completion of the project depends
upon cost optimization. The cost is
not directly proportioned to time.
Thus, cost is the controlling factor.
PERT
• PERT uses event oriented Network.
(AOA)
• Estimate of time for activities are
not so accurate and definite.
• It is used mostly in research and
development projects, particularly
projects of non-repetitive nature.
• Probabilistic model concept is used.
• PERT is basically a tool for planning.
• In PERT, it is assumed that cost varies
directly with time. Attention is
therefore given to minimize the time
so that minimum cost results. Thus in
PERT, time is the controlling factor.
8. Problem: Crashing
Activity Precedence Duration, Periods
(normal, crash)
Cost
(normal, crash)
Slope
(Cost / Period)
A
B
C
D
E
F
G
-
A
A
A
B
C,D
E,F
4,3
6,4
10,9
11,7
8,6
5,4
4,4
RM 30,40
RM 40,80
RM 30, 45
RM 25, 75
RM 50, 80
RM 20, 35
RM 40,40
10/-1 = - 10
40/-2 = - 20
15/-1 = - 15
50/-4 = - 12.5
30/-2 = - 15
15/-1 = - 15
-
Table 1: CPM (Normal & Crash, duration in day)
a) Reduce the total project duration by three (3) days.
b) Calculate the total new cost of the project?
9. Solution steps: Crashing
1. Develop AON complete with duration and
cost.
2. Determine critical activity.
3. Crashing rules: Crash the critical activity
with the lowest cost by a day.
4. Repeat step 2 and 3.
11. PERT Network:
• It is a directed network.
• Each activity is represented by a node.
• An arc from task X to task Y if task Y follows
task X.
• A ‘start’ node and a ‘finish’ node are added to
show project start and project finish.
• Every node must have at least one out-going
arc except the ‘finish’ node.
12. Performance Time t of an
Activity
• t is calculated as follows:
where
• to = optimistic time,
• tp = pessimistic time,
• tm = most likely time.
• Note: t is also called the expected performance
time of an activity.
6
)
*
4
( p
m
o t
t
t
t
13. Variance of Activity Time t
• If to, tm, and tp are given for the optimistic, most
likely, and pessimistic estimations of activity k,
variance k2 is calculated by the formula
2
2
6
)
(
o
p
k
t
t
Variance
𝑆𝑡𝑎𝑛𝑑𝑎𝑟𝑑 𝐷𝑒𝑣𝑖𝑎𝑡𝑖𝑜𝑛 𝜎 =
𝑡𝑝 − 𝑡𝑜
6
14. Variance, a Measure of Variation
• Variance is a measure of variation of possible
values around the expected value.
• The larger the variance, the more spread-out
the random values.
• The square root of variance is called standard
deviation.
15. Problem: Calculate the Critical
Path
Activity to tm tp Immediate predecessor
A 1 2 3 -
B 2 3 4 -
C 4 5 6 A
D 8 9 10 B
E 2 5 8 C, D
F 4 5 6 B
G 1 2 3 E
16. Steps for Solving 13-1&2
1. Calculate activity performance time t for
each activity;
2. Draw the PERT network;
3. Calculate ES, EF, LS, LF and slack of each
activity on PERT network;
4. Identify the critical path.
17. Probabilities in PERT
• Since the performance time t of an activity is
from estimations, its actual performance time
may deviate from t;
• And the actual project completion time may
vary.
18. Probabilistic Information for
Management
• The expected project finish time and the
variance of project finish time;
• Probability the project is finished by a certain
date.
19. Project Completion Time and its
Variance
• The expected project completion time T:
• T = earliest completion time of the project.
• The variance of T, T2 :
• T2 = (variances of activities on the critical path)
20. Example, Foundry Inc.
Activity to tm tp t variance
A 1 2 3 2 0.111
B 2 3 4 3 0.111
C 1 2 3 2 0.111
D 2 4 6 4 0.444
E 1 4 7 4 1
F 1 2 9 3 1.777
G 3 4 11 5 1.777
H 1 2 3 2 0.111
Critical path: A-C-E-G-H
Project completion time, T = Variance of T, T
2 =
21. Probability Analysis
• To find probability of completing project
within a particular time x:
• 1. Find the critical path, expected project
completion time T and its variance T2 .
• 3. Find probability from a normal distribution table.
2
T
x
Z
Calculate
22.
23. The Idea of the Approach
• The table gives the probability P(z<=Z) where
z is a random variable with standard normal
distribution, i.e. zN(0,1); Z is a specific
value.
• P(project finishes within x days)
)
(
2
Z
z
P
T
x
z
P
T
24. Notes (1)
• P(project is finished within x days)
= P(z<=Z)
• P(project is not finished within x days)
= 1P(project finishes within x days)
= 1P(z<=Z)
25. Notes (2)
• If x<T, then Z is a negative number.
• But the table is only for positive Z values.
• For example, Z= 1.5, per to the symmetry
feature of the normal curve,
P(z<=1.5) = P(z>=1.5) = 1P(z<=1.5)
26.
27. Example of Foundry Inc. p.530-
531
• Project completion time T=15 weeks.
• Variance of project time, T2=3.111.
• We want to find the probability that project is finished
within 16 weeks. Here, x=16, and
• So, P(project is finished within 16 weeks)
• = P(z<=Z) = P(z<=0.57) = 0.71566.
57
.
0
76
.
1
1
111
.
3
15
16
2
T
T
x
Z
28. Examples of probability analysis
• If a project’s expected completing time is T=246 days
with its variance T2=25, then what is the probability
that the project:
• is actually completed within 246 days?
• is actually completed within 240 days?
• is actually completed within 256 days?
• is not completed by the 256th day?
29. A Comprehensive Example
• Given the data of a project as in the next slide, answer
the following questions:
• What is PERT network like for this project?
• What is the critical path?
• Activity E will be subcontracted out. What is earliest time it
can be started? What is time it must start so that it will not
delay the project?
• What is probability that the project can be finished within 10
weeks?
• What is the probability that the project is not yet finished
after 12 weeks?
34. Questions
• Calculate the expected activity duration (te),
standard deviation (e) and variance (e)2 for each
activity.
• Assuming that the critical Path is B-E-H = 16 months
• What is the probability of completing the project in 18
months? (nearest estimated number)?
• What is the probability the project will be completed
before the scheduled time (Ts) of 15 months (nearest
estimated number)?