Download as PDF, PPTX

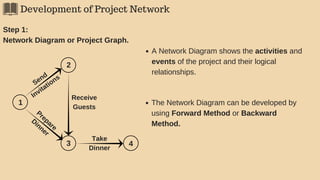
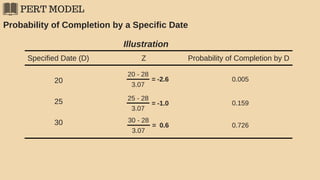
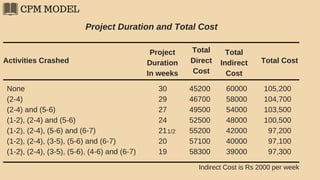
![Determination of the Critical Path
Step 3
Determining Critical Path/s, event slacks and activity floats.
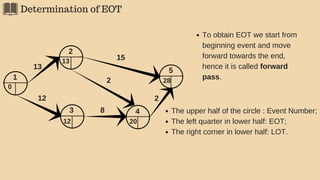
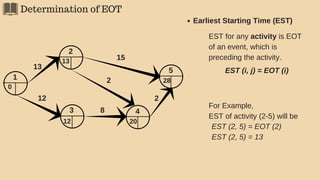
3(1). Earliest Occurrence Time (EOT)
The EOT of an event is the duration of the longest path (from beginning event
whose EOT is set at 0) leading to that event.
Hence, EOT of the end event represents the minimum time required for completing
the project.
General formula for EOT is:
EOT (i) = Max [ EOT (k) + d(k, i) ] Where,
EOT (i)= EOT of i event;
EOT (k)= EOT of k event (k precedes i);
d (k, i)= duration of activity (k, i)
th
th](https://image.slidesharecdn.com/networktechniquespmppt-180516044834/85/Network-Techniques-for-Project-Management-7-320.jpg)
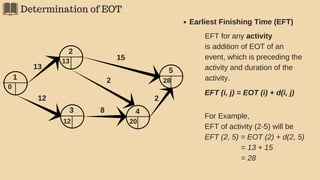
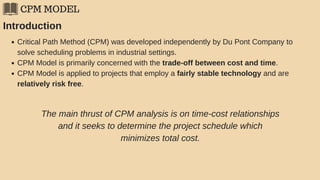
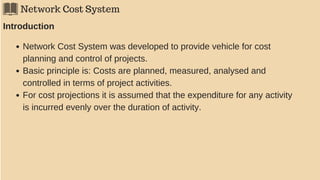
![Determination of EOT
5
2
43 8
2
15
2
1
13
12
0
13
12
EOT (i) = Max [ EOT (k) + d(k, i)]
EOT (4)
= Max [ ]
[ EOT (3) + d(3, 4)] [ EOT (2) + d(2, 4)]
= [12 + 8] = [13 + 2]
= [20] = [15]
EOT (4) = 20](https://image.slidesharecdn.com/networktechniquespmppt-180516044834/85/Network-Techniques-for-Project-Management-8-320.jpg)
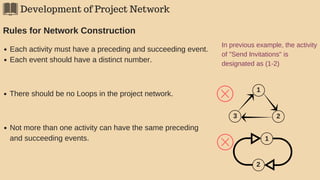
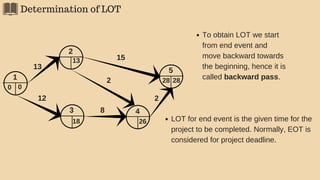
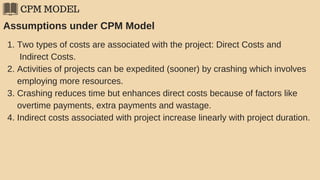
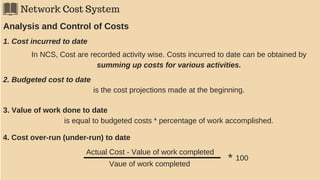
![Determination of the Critical Path
3(2). Latest Occurrence Time (LOT)
The EOT of an event is the latest allowable time by which the event can occur, given
the time that is allowed for completion of the project (occurence of end event).
Hence, LOT of the an event represents the latest time by which the event should
occur to enable the project to be completed in given time.
General formula for LOT is:
LOT (i) = Min [ LOT (j) - d(i, j) ] Where,
LOT (i)= LOT of i event;
LOT (j)= LOT of j event (j follows i);
d (i, j)= duration of activity (i, j)
th
th](https://image.slidesharecdn.com/networktechniquespmppt-180516044834/85/Network-Techniques-for-Project-Management-12-320.jpg)
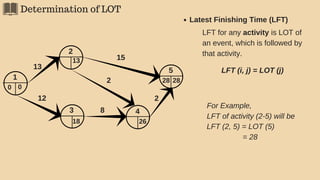
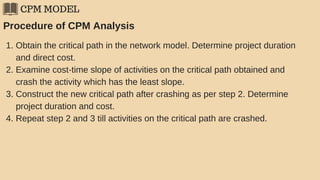
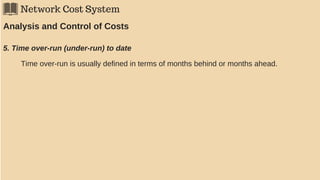
![Determination of LOT
5
2
43 8
2
15
2
1
13
12
28
LOT (i) = Min [ LOT (j) - d(i, j)]
LOT (2)
= MIN [ ]
[ LOT (4) - d(2, 4)] [ LOT (5) - d(2, 5)]
= [26 - 2] = [28 - 15]
= [24] = [13]
LOT (2) = 13
26](https://image.slidesharecdn.com/networktechniquespmppt-180516044834/85/Network-Techniques-for-Project-Management-13-320.jpg)

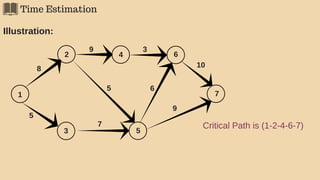
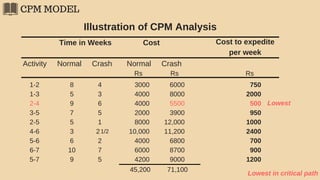
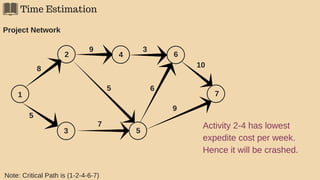

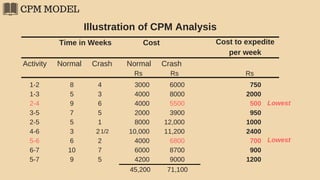


The document discusses project management techniques focusing on developing project networks using diagrams and time estimation methods. It outlines steps for determining critical paths, estimating time values for project activities, and assessing activity floats while considering risk through PERT and cost-time trade-offs with CPM. The purpose is to effectively manage schedules, resources, and project completion timelines.