Download to read offline


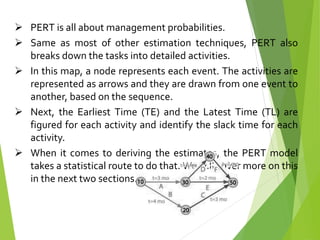
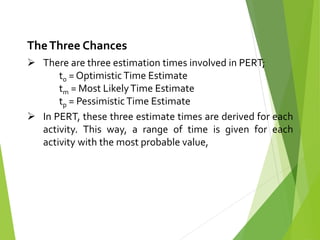
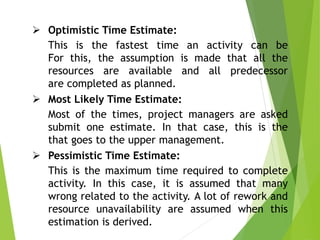

This document discusses PERT (Program Evaluation and Review Technique), which is a successful method for estimating project timelines. PERT breaks projects down into detailed tasks and estimates optimistic, most likely, and pessimistic time estimates for each task. It uses a beta probability distribution to calculate expected task times and project variance. The expected times are combined to estimate overall project completion time, while variances are used to calculate a standard deviation and confidence intervals for finishing the project on schedule. PERT allows estimating project timelines statistically while accounting for uncertainty in task durations.