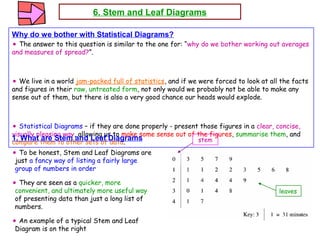
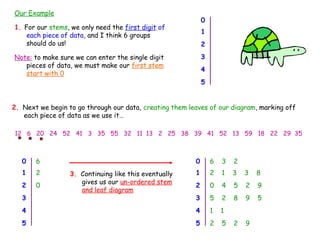
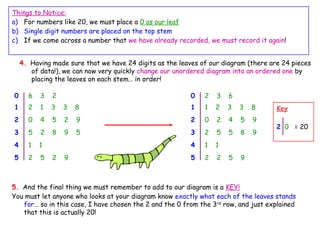
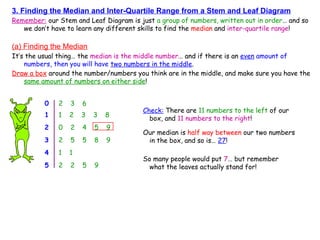
Box and whisker plot is a statistical measure to show the distribution of data. It is also called as Five Number Summary box as it consists of the median, the quartiles (lower and upper) and smallest and greatest values in distribution.
Descriptive statistics, central tendency, measures of variability, measures of dispersion, skewness, kurtosis, range, standard deviation, mean, median, mode, variance, normal distribution
This presentation covers statistics, its importance, its applications, branches of statistics, basic concepts used in statistics, data sampling, types of sampling,types of data and collection of data.
Turning from discrete to continuous distributions, in this section we discuss the normal distribution. This is the most important continuous distribution because in applications many random variables are normal random variables (that is, they have a normal distribution) or they are approximately normal or can be transformed into normal random variables in a relatively simple fashion. Furthermore, the normal distribution is a useful approximation of more complicated distributions, and it also occurs in the proofs of various statistical tests.
Normal Distribution, also called Gaussian Distribution, is one of the widely used continuous distributions existing which is used to model a number of scenarios such as marks of students, heights of people, salaries of working people etc.
Each binomial distribution is defined by n, the number of trials and p, the probability of success in any one trial.
Each Poisson distribution is defined by its mean.
In the same way, each Normal distribution is identified by two defining characteristics or parameters: its mean and standard deviation.
The Normal distribution has three distinguishing features:
• It is unimodal, in other words there is a single peak.
• It is symmetrical, one side is the mirror image of the other.
• It is asymptotic, that is, it tails off very gradually on each side but the line representing the distribution never quite meets the horizontal axis
definition of survey
survey and its type
its purpose and uses.
sampling
approaches
survey methods
research designs
probability and non probability
population
cross sectional design
longitudinal design
successive independent sampling design
This presentation includes an introduction to statistics, introduction to sampling methods, collection of data, classification and tabulation, frequency distribution, graphs and measures of central tendency.
done by : ( ABCD'S &G )
alaa ba-jafar
abrar alshahranii
sahab filfilan
nada alharbi
shahd rajab
Ghadeer suwaimil
I hope that you enjoy and you benefit❤
From Square Numbers to Square Roots (Lesson 2) jacob_lingley
Students will use their understanding of square numbers to evaluate square roots. Remember, square roots, quite literally mean going from square numbers, back to the root - the number which you multiplied in the first place to get the square number. Example: The square root of 49 is 7.
Welcome to TechSoup New Member Orientation and Q&A (May 2024).pdfTechSoup
In this webinar you will learn how your organization can access TechSoup's wide variety of product discount and donation programs. From hardware to software, we'll give you a tour of the tools available to help your nonprofit with productivity, collaboration, financial management, donor tracking, security, and more.
Macroeconomics- Movie Location
This will be used as part of your Personal Professional Portfolio once graded.
Objective:
Prepare a presentation or a paper using research, basic comparative analysis, data organization and application of economic information. You will make an informed assessment of an economic climate outside of the United States to accomplish an entertainment industry objective.
June 3, 2024 Anti-Semitism Letter Sent to MIT President Kornbluth and MIT Cor...Levi Shapiro
Letter from the Congress of the United States regarding Anti-Semitism sent June 3rd to MIT President Sally Kornbluth, MIT Corp Chair, Mark Gorenberg
Dear Dr. Kornbluth and Mr. Gorenberg,
The US House of Representatives is deeply concerned by ongoing and pervasive acts of antisemitic
harassment and intimidation at the Massachusetts Institute of Technology (MIT). Failing to act decisively to ensure a safe learning environment for all students would be a grave dereliction of your responsibilities as President of MIT and Chair of the MIT Corporation.
This Congress will not stand idly by and allow an environment hostile to Jewish students to persist. The House believes that your institution is in violation of Title VI of the Civil Rights Act, and the inability or
unwillingness to rectify this violation through action requires accountability.
Postsecondary education is a unique opportunity for students to learn and have their ideas and beliefs challenged. However, universities receiving hundreds of millions of federal funds annually have denied
students that opportunity and have been hijacked to become venues for the promotion of terrorism, antisemitic harassment and intimidation, unlawful encampments, and in some cases, assaults and riots.
The House of Representatives will not countenance the use of federal funds to indoctrinate students into hateful, antisemitic, anti-American supporters of terrorism. Investigations into campus antisemitism by the Committee on Education and the Workforce and the Committee on Ways and Means have been expanded into a Congress-wide probe across all relevant jurisdictions to address this national crisis. The undersigned Committees will conduct oversight into the use of federal funds at MIT and its learning environment under authorities granted to each Committee.
• The Committee on Education and the Workforce has been investigating your institution since December 7, 2023. The Committee has broad jurisdiction over postsecondary education, including its compliance with Title VI of the Civil Rights Act, campus safety concerns over disruptions to the learning environment, and the awarding of federal student aid under the Higher Education Act.
• The Committee on Oversight and Accountability is investigating the sources of funding and other support flowing to groups espousing pro-Hamas propaganda and engaged in antisemitic harassment and intimidation of students. The Committee on Oversight and Accountability is the principal oversight committee of the US House of Representatives and has broad authority to investigate “any matter” at “any time” under House Rule X.
• The Committee on Ways and Means has been investigating several universities since November 15, 2023, when the Committee held a hearing entitled From Ivory Towers to Dark Corners: Investigating the Nexus Between Antisemitism, Tax-Exempt Universities, and Terror Financing. The Committee followed the hearing with letters to those institutions on January 10, 202
Acetabularia Information For Class 9 .docxvaibhavrinwa19
Acetabularia acetabulum is a single-celled green alga that in its vegetative state is morphologically differentiated into a basal rhizoid and an axially elongated stalk, which bears whorls of branching hairs. The single diploid nucleus resides in the rhizoid.
Francesca Gottschalk - How can education support child empowerment.pptxEduSkills OECD
Francesca Gottschalk from the OECD’s Centre for Educational Research and Innovation presents at the Ask an Expert Webinar: How can education support child empowerment?
Introduction to AI for Nonprofits with Tapp NetworkTechSoup
Dive into the world of AI! Experts Jon Hill and Tareq Monaur will guide you through AI's role in enhancing nonprofit websites and basic marketing strategies, making it easy to understand and apply.
Model Attribute Check Company Auto PropertyCeline George
In Odoo, the multi-company feature allows you to manage multiple companies within a single Odoo database instance. Each company can have its own configurations while still sharing common resources such as products, customers, and suppliers.
Unit 8 - Information and Communication Technology (Paper I).pdfThiyagu K
This slides describes the basic concepts of ICT, basics of Email, Emerging Technology and Digital Initiatives in Education. This presentations aligns with the UGC Paper I syllabus.
Unit 8 - Information and Communication Technology (Paper I).pdf
stem and leaf diagrams
1. Mr Barton’s Maths Notes
Stats and Probability
6. Stem and Leaf Diagrams
www.mrbartonmaths.com
2. 6. Stem and Leaf Diagrams
Why do we bother with Statistical Diagrams?
•The answer to this question is similar to the one for: “why do we bother working out averages
and measures of spread?”.
•We live in a world jam-packed full of statistics, and if we were forced to look at all the facts
and figures in their raw, untreated form, not only would we probably not be able to make any
sense out of them, but there is also a very good chance our heads would explode.
•Statistical Diagrams – if they are done properly - present those figures in a clear, concise,
visually pleasing way, allowing us to make some sense out of the figures, summarise them, and
compare them to other sets of data.
1. What are Stem and Leaf Diagrams
•To be honest, Stem and Leaf Diagrams are
just a fancy way of listing a fairly large
group of numbers in order
•They are seen as a quicker, more
convenient, and ultimately more useful way
of presenting data than just a long list of
numbers.
•An example of a typical Stem and Leaf
Diagram is on the right
stem
leaves
3. 2. Constructing a Stem and Leaf Diagram
1. Decide on your stems – these are the digits which go down the left hand side of your
diagram. You should choose them in a way so that you have between 4 and 10 groups, and so
that each of your leaves is only one digit!
2. Go through your data, in the order in which it is written, and add it to the correct stem on
your diagram. I would mark each piece of data once it has been entered, so you don’t loose
your spot!
3. When completed, this is your un-ordered stem and leaf diagram
4. Now draw yourself another stem and leaf diagram, but this time put the leaves in order!
Note: Everyone seems to want to jump straight to the ordered stem and leaf diagram, but I
promise you this way is quicker and a lot safer in terms of mistakes!
Big Example
Here are the times (in minutes) that it takes Mr Barton to actually get out of bed after his
alarm has sounded on a Monday morning:
12 6 20 24 52 41 3 35 55 32 11 13 2 25 38 39 41 52 13 59 18 22 29 35
Use the data to construct a Stem and Leaf Diagram, and then calculate the Median and
Inter-Quartile Range
4. Our Example
1. For our stems, we only need the first digit of
each piece of data, and I think 6 groups
should do us!
Note: to make sure we can enter the single digit
pieces of data, we must make our first stem
start with 0
0
1
2
3
4
5
2. Next we begin to go through our data, creating them leaves of our diagram, marking off
each piece of data as we use it…
12 6 20 24 52 41 3 35 55 32 11 13 2 25 38 39 41 52 13 59 18 22 29 35
0 6
1 2
2 0
3
4
5
3. Continuing like this eventually
gives us our un-ordered stem
and leaf diagram
0 6 3 2
1 2 1 3 3 8
2 0 4 5 2 9
3 5 2 8 9 5
4 1 1
5 2 5 2 9
5. Things to Notice:
a) For numbers like 20, we must place a 0 as our leaf
b) Single digit numbers are placed on the top stem
c) If we come across a number that we have already recorded, we must record it again!
0 6 3 2
1 2 1 3 3 8
2 0 4 5 2 9
3 5 2 8 9 5
4 1 1
5 2 5 2 9
Key
2 0 = 20
0 2 3 6
1 1 2 3 3 8
2 0 2 4 5 9
3 2 5 5 8 9
4 1 1
5 2 2 5 9
5. And the final thing we must remember to add to our diagram is a KEY!
You must let anyone who looks at your diagram know exactly what each of the leaves stands
for… so in this case, I have chosen the 2 and the 0 from the 3rd
row, and just explained
that this is actually 20!
4. Having made sure that we have 24 digits as the leaves of our diagram (there are 24 pieces
of data!), we can now very quickly change our unordered diagram into an ordered one by
placing the leaves on each stem… in order!
6. 3. Finding the Median and Inter-Quartile Range from a Stem and Leaf Diagram
Remember: our Stem and Leaf Diagram is just a group of numbers, written out in order… and so
we don’t have to learn any different skills to find the median and inter-quartile range!
(a) Finding the Median
It’s the usual thing… the median is the middle number… and if there is an even amount of
numbers, then you will have two numbers in the middle.
Draw a box around the number/numbers you think are in the middle, and make sure you have the
same amount of numbers on either side!
0 2 3 6
1 1 2 3 3 8
2 0 2 4 5 9
3 2 5 5 8 9
4 1 1
5 2 2 5 9
Check: There are 11 numbers to the left of our
box, and 11 numbers to the right!
Our median is half way between our two numbers
in the box, and so is… 27!
So many people would put 7… but remember
what the leaves actually stand for!
7. (b) Finding the Inter-Quartile Range
Remember: Inter-Quartile Range = Upper Quartile – Lower Quartile
The way I do this is to think of the Lower Quartile as being the median of the lower half of
numbers… and the Upper Quartile as the median of the upper half of numbers.
And I just find these values the same old way… using my boxes, and making sure there are the
same amount of numbers on either side!
0 2 3 6
1 1 2 3 3 8
2 0 2 4 5 9
3 2 5 5 8 9
4 1 1
5 2 2 5 9
Lower Quartile = 13
(5 numbers either side in the lower half)
Upper Quartile = 40
(5 numbers either side in the upper half)
Inter-Quartile Range = 40 – 13
= 27
13 13
1
2
3
+
=
39 41
4
2
0
+
=
8. 4. What’s GOOD about Stem and Leaf Diagrams?
•Well, the major advantage over things like bar charts and histograms, is that no information
is lost – the stem and leaf diagram keeps and allows you to see each original piece of data
•It is also quite an effective way of ordering and displaying relatively small sets of data
5. What’s BAD about Stem and Leaf Diagrams?
•Well, it’s quite time consuming, and impractical for large data sets. Imagine how long it would
take to sort over 300 pieces of data, and how complicated the final diagram would look!