Downloaded 516 times
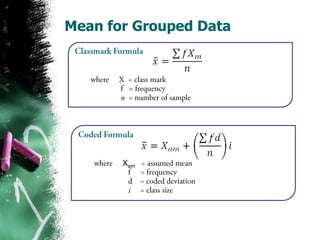
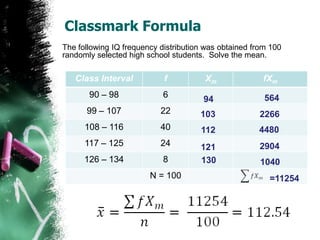
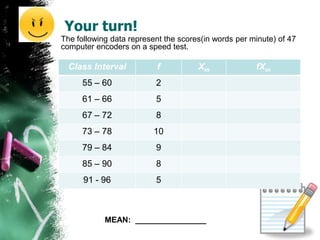
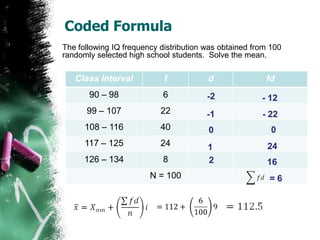
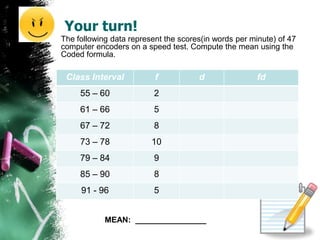
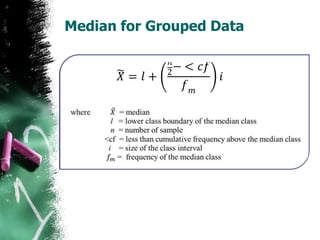
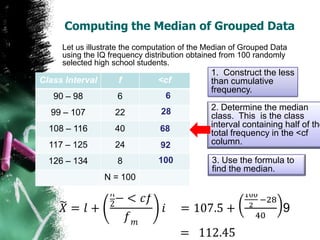
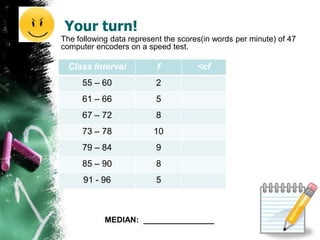
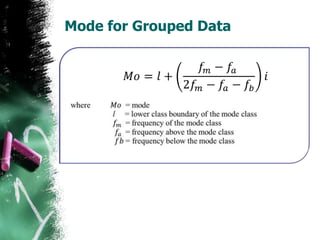
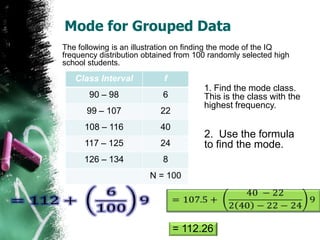
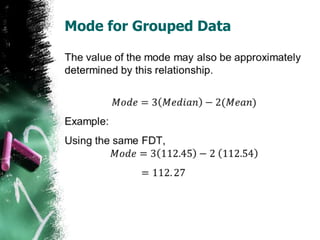
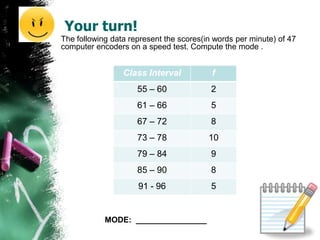

This document discusses measures of central tendency - mean, median, and mode - for grouped data. It provides examples of calculating the mean, median, and mode using frequency distributions with class intervals and frequencies. The mean is calculated using the class midpoint formula or coded formula. The median is found by determining the median class based on the cumulative frequency. The mode is the class with the highest frequency.