Downloaded 127 times
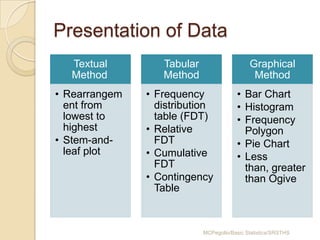

1. The document discusses different methods for presenting data, including textual, tabular, and graphical methods. 2. It provides examples of how to prepare a stem-and-leaf plot, construct a frequency distribution table, and define key terms related to grouped and ungrouped data presentation. 3. The objectives are to describe how to prepare a stem-and-leaf plot, describe data textually, construct a frequency distribution table, create graphs, and interpret graphs and tables.