Download as PDF, PPTX


![Carbon isotope ratios are usually expressed in parts per thousand (or per mil, ‰) relative to a standard, using the common notation
ä13C = [(Rsample–Rstandard) /Rstandard]x 1000
where
R =13C/12C
is the ratio of the heavier to the lighter stable isotope of carbon. The common reference for ä13C was obtained from a cretaceous marine fossil, Belemnitella americana, from the Pee Dee formation in South Carolina.
This material had an anomalously high 13C:12C ratio (0.0112372), and was established as δ13C value of zero. All original supplies of PDB have been essentially exhausted and replaced by secondary carbonate standards calibrated against those prepared by the U.S. National
Institute of Standards and Technology (NIST) .](https://image.slidesharecdn.com/presentation1-141121021050-conversion-gate01/85/Cavity-Ring-Down-Spectroscopy-CRDS-Principle-Instrumentation-and-Results-19-320.jpg)


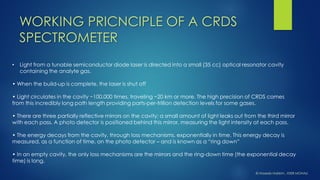
The document summarizes the principles and applications of cavity ring down spectroscopy (CRDS). It describes how CRDS works by using an optical cavity to greatly increase the effective path length of light, enabling precise measurements of weak absorptions. Key applications mentioned include environmental monitoring, emissions monitoring, and trace gas analysis.


