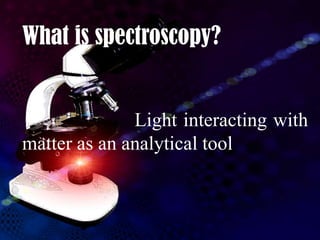
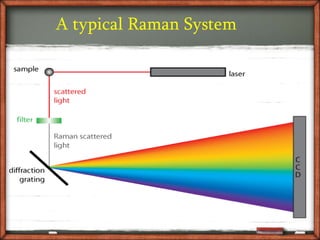
RAMAN SPECTROSCOPY


Created by ,
               Swaminathan. P
               St. George's College . Aruvithura
               swaminathanpadmakumar@gmail.com
Some ideas about Spectroscopy


Raman Spectroscopy


Laser Raman Spectrometer
What is spectroscopy?


              Light interacting with
matter as an analytical tool
“when we look at the
universe in a different „light‟
i.e., at „non visible‟ wave
length, we probe different
kinds of physical conditions
and we can see new kinds of
objects”
Electromagnetic Spectrum
Spectroscopic data is often represented by a spectrum, a plot of
the intensity of radiation as a function of wavelength or frequency.


Spectrum of Benzene molecule
Introduction to Raman
     spectroscopy
Sir Chandrasekhara Venkata Raman

                . November 7, 1888 - November 21, 1970
                . Won the Nobel prize in 1930 for Physics
                . Discovered the “Raman effect”
                . Besides discovering the Raman effect he
                  studied extensively in X-ray Diffractions,

                  Acoustics, Optics, Dielectrics and Colloidal
                  solutions.
When a monochromatic radiation of frequency ʋ is passed
through a non absorbing medium,it is found that most of it is
transmitted without any change, and some of it is scattered. If
the scattered energy is analyzed by means of a
spectrometer, the bulk of the energy is found at the frequency
of the incident beam ʋ˳ but a small portion of the scattered
energy will be
found at frequencies ʋ =ʋ˳ . The scattering of radiation
with change of frequency is called Raman scattering.
In Raman spectroscopy, by varying the frequency of
the radiation, a spectrum can be produced, showing the
intensity of the exiting radiation for each frequency.
This spectrum will show which frequencies of
radiation have been absorbed by the molecule to raise
it to higher vibrational energy states.
When Light hits a sample, It is Excited, and is
forced to vibrate and move. It is these vibrations
which we are measuring.
   Atoms are at a certain energy level at any
    given time.
   As a laser light hits the atom, it is excited
    and reaches a higher level of energy, and
    then is brought back down.
   If an atom is at a given energy level, it can
    be excited then fall below the original
    level.
   Anti-stokes spectrum are mirror spectrums
    of Stokes Raman Spectrums
Energy Scheme for Photon Scattering

                             Virtual
                              State

                                                                 h   0   h 0+h
                         h        h                h                     m
Energy


                              0        0                0
                                                   h    m
                                                                                 E0+h   m

                                                                                 E0
             IR           Rayleigh          Stokes             Anti-Stokes
          Absorption     Scattering        Scattering           Scattering
                          (elastic)
                                                         Raman
                                                       (inelastic)

                  The Raman effect comprises a very small fraction,
                       about 1 in 107 of the incident photons.
Raman Spectrum
A Raman spectrum is a plot of the intensity of Raman
scattered radiation as a function of its frequency
difference from the incident radiation (usually in units
of wavenumbers, cm-1). This difference is called the
Raman shift.
Laser Raman spectrometer
A typical Raman System
Raman Instruments
A modern Raman spectrometer
Days before Laser..

Commonly used sources were 435.8nm and 253.6nm
emission lines of mercury vapour

Disadvantages
  the source is an extended one and the brightness available per unit area is very
  small
   the relatively high frequency of mercury radiation often causes the sample to
   fluorescence
   as colored samples absorb in this high frequency region, it is not possible to record
   their spectra
With the discovery of lasers …
Advantages
  excellent monochromaticity
  good beam focusing capabilities and small
  line widths
  the second order Raman spectra can be
  recorded
  the broadening due to Doppler effect can be
  minimized
Working
Lasers using in Raman spectroscopy
Laser sources for Raman spectroscopy include laser
diodes, diode-pumped lasers and ion lasers.


The Innova 300C and 70C series of small-frame argon or
krypton ion lasers are also well suited for Raman
experiments in the visible region of the spectrum.


 Innova 70C Spectrum is a mixed gas lasers that can generate
a number of laser lines from the UV to the near IR
Laser wavelengths ranging from ultra-violet through
visible to near infra-red can be used for Raman
spectroscopy.
Typical examples include,

Ultra-violet: 244 nm, 257 nm, 325 nm, 364 nm

Visible: 457 nm, 473 nm, 488 nm, 514 nm, 532
nm, 633 nm, 660 nm

Near infra-red: 785 nm, 830 nm, 980 nm, 1064 nm
The Invictus 785-nm NIR laser is the excitation laser
of choice for the majority of Raman spectroscopy
applications from pharmaceutical to polymers.


The Invictus 830-nm NIR laser has been developed
for biomedical applications of Raman spectroscopy
where sample absorption characteristics require longer
excitation wavelengths and reduced spectral range.


The Invictus 532-nm VIS laser is used for specific
classes of Raman spectroscopy including gas phase
measurements.
The choice of laser wavelength has an
important impact on experimental capabilities:

Sensitivity


Spatial resolution


Optimisation of resulting based on sample
behaviour.
Laser filters using in Raman spectroscopy


Optical filters

Edge


Holographic notch
Gratings using in Raman spectroscopy
Typical gratings used for Raman vary from perhaps 300gr/mm
(low resolution) through to 1800gr/mm (high resolution) – more
specialised gratings (including 2400gr/mm and 3600gr/mm) are
also available, but have certain limitations, and should not be
considered general purpose.

Raman spectrometers typically use holographic gratings, which
normally have much less manufacturing defects in their
structure than ruled gratings. Stray light produced by
holographic gratings is about an order of magnitude less intense
than from the ruled gratings of the same groove density.
Detectors used in Raman spectroscopy
Charge Coupled Device (CCD) detector is the “camera” used
to detect the Raman spectrum. A CCD detector is a two
dimensional array of very low noise, silicon detectors.


       Typical CCD chip.
Single-Channel Detectors

   Photomultiplier Tubes
Photodiodes

Array Detectors

     Photographic Emulsion

     Photodiode Arrays

Non-Silicon Array Detectors
Applications of Raman spectroscopy
Raman spectroscopy is commonly used in chemistry, since vibrational
information is specific to the chemical bonds and symmetry of
molecules. Therefore, it provides a fingerprint by which the molecule
can be identified.

In solid-state physics, spontaneous Raman spectroscopy is used
to, characterize materials, measure temperature, and find the
crystallographic orientation of a sample.

Raman spectroscopy can be used to observe other low frequency
excitations of the solid, such as plasmons, magnons, and
superconducting gap excitations
Spatially-offset Raman spectroscopy (SORS), which is less
sensitive to surface layers than conventional Raman, can be used to
discover counterfeit drugs without opening their packaging, and for
non-invasive monitoring of biological tissue


 Raman spectroscopy can be used to investigate the chemical
composition of historical documents such as and contribute to
knowledge of the social and economic conditions at the time the
documents were produced.


 Raman spectroscopy is being investigated as a means to detect
explosives for airport security.
Raman spectroscopy can be used as a technique
for identification of seafloor hydrothermal and
cold seep minerals

Used to discriminate between healthy and
unhealthy tissues, or to determine the degree of
progress of a certain disease.

Used in medicine , aiming to the development of
new therapeutic drugs and in the diagnosis of
arteriosclerosis and cancer.
References

      Colin N. Banwell, Elaine M.McCash, 1994.
Fundamentals of Spectroscopy, Tata McGraw-Hill
Publishing Company Limited, New Delhi, 308p.

      B B Laud, 1991.Lasers and non linear
optics, New age International(P) Limited, New
Delhi,261p.

     H S Randhawa, 2003. Modern Molecular
Spectroscopy, Macmillan India LTD, New
Delhi,584p.
Thank you..

Raman spectroscopy

  • 1.
    RAMAN SPECTROSCOPY Created by, Swaminathan. P St. George's College . Aruvithura swaminathanpadmakumar@gmail.com
  • 2.
    Some ideas aboutSpectroscopy Raman Spectroscopy Laser Raman Spectrometer
  • 3.
    What is spectroscopy? Light interacting with matter as an analytical tool
  • 4.
    “when we lookat the universe in a different „light‟ i.e., at „non visible‟ wave length, we probe different kinds of physical conditions and we can see new kinds of objects”
  • 5.
  • 6.
    Spectroscopic data isoften represented by a spectrum, a plot of the intensity of radiation as a function of wavelength or frequency. Spectrum of Benzene molecule
  • 7.
  • 8.
    Sir Chandrasekhara VenkataRaman . November 7, 1888 - November 21, 1970 . Won the Nobel prize in 1930 for Physics . Discovered the “Raman effect” . Besides discovering the Raman effect he studied extensively in X-ray Diffractions, Acoustics, Optics, Dielectrics and Colloidal solutions.
  • 9.
    When a monochromaticradiation of frequency ʋ is passed through a non absorbing medium,it is found that most of it is transmitted without any change, and some of it is scattered. If the scattered energy is analyzed by means of a spectrometer, the bulk of the energy is found at the frequency of the incident beam ʋ˳ but a small portion of the scattered energy will be found at frequencies ʋ =ʋ˳ . The scattering of radiation with change of frequency is called Raman scattering.
  • 10.
    In Raman spectroscopy,by varying the frequency of the radiation, a spectrum can be produced, showing the intensity of the exiting radiation for each frequency. This spectrum will show which frequencies of radiation have been absorbed by the molecule to raise it to higher vibrational energy states.
  • 11.
    When Light hitsa sample, It is Excited, and is forced to vibrate and move. It is these vibrations which we are measuring.
  • 12.
    Atoms are at a certain energy level at any given time.  As a laser light hits the atom, it is excited and reaches a higher level of energy, and then is brought back down.  If an atom is at a given energy level, it can be excited then fall below the original level.  Anti-stokes spectrum are mirror spectrums of Stokes Raman Spectrums
  • 13.
    Energy Scheme forPhoton Scattering Virtual State h 0 h 0+h h h h m Energy 0 0 0 h m E0+h m E0 IR Rayleigh Stokes Anti-Stokes Absorption Scattering Scattering Scattering (elastic) Raman (inelastic) The Raman effect comprises a very small fraction, about 1 in 107 of the incident photons.
  • 14.
    Raman Spectrum A Ramanspectrum is a plot of the intensity of Raman scattered radiation as a function of its frequency difference from the incident radiation (usually in units of wavenumbers, cm-1). This difference is called the Raman shift.
  • 15.
  • 16.
  • 17.
  • 18.
    A modern Ramanspectrometer
  • 19.
    Days before Laser.. Commonlyused sources were 435.8nm and 253.6nm emission lines of mercury vapour Disadvantages the source is an extended one and the brightness available per unit area is very small the relatively high frequency of mercury radiation often causes the sample to fluorescence as colored samples absorb in this high frequency region, it is not possible to record their spectra
  • 20.
    With the discoveryof lasers … Advantages excellent monochromaticity good beam focusing capabilities and small line widths the second order Raman spectra can be recorded the broadening due to Doppler effect can be minimized
  • 21.
  • 22.
    Lasers using inRaman spectroscopy Laser sources for Raman spectroscopy include laser diodes, diode-pumped lasers and ion lasers. The Innova 300C and 70C series of small-frame argon or krypton ion lasers are also well suited for Raman experiments in the visible region of the spectrum. Innova 70C Spectrum is a mixed gas lasers that can generate a number of laser lines from the UV to the near IR
  • 23.
    Laser wavelengths rangingfrom ultra-violet through visible to near infra-red can be used for Raman spectroscopy. Typical examples include, Ultra-violet: 244 nm, 257 nm, 325 nm, 364 nm Visible: 457 nm, 473 nm, 488 nm, 514 nm, 532 nm, 633 nm, 660 nm Near infra-red: 785 nm, 830 nm, 980 nm, 1064 nm
  • 24.
    The Invictus 785-nmNIR laser is the excitation laser of choice for the majority of Raman spectroscopy applications from pharmaceutical to polymers. The Invictus 830-nm NIR laser has been developed for biomedical applications of Raman spectroscopy where sample absorption characteristics require longer excitation wavelengths and reduced spectral range. The Invictus 532-nm VIS laser is used for specific classes of Raman spectroscopy including gas phase measurements.
  • 25.
    The choice oflaser wavelength has an important impact on experimental capabilities: Sensitivity Spatial resolution Optimisation of resulting based on sample behaviour.
  • 26.
    Laser filters usingin Raman spectroscopy Optical filters Edge Holographic notch
  • 27.
    Gratings using inRaman spectroscopy Typical gratings used for Raman vary from perhaps 300gr/mm (low resolution) through to 1800gr/mm (high resolution) – more specialised gratings (including 2400gr/mm and 3600gr/mm) are also available, but have certain limitations, and should not be considered general purpose. Raman spectrometers typically use holographic gratings, which normally have much less manufacturing defects in their structure than ruled gratings. Stray light produced by holographic gratings is about an order of magnitude less intense than from the ruled gratings of the same groove density.
  • 28.
    Detectors used inRaman spectroscopy Charge Coupled Device (CCD) detector is the “camera” used to detect the Raman spectrum. A CCD detector is a two dimensional array of very low noise, silicon detectors. Typical CCD chip.
  • 29.
    Single-Channel Detectors Photomultiplier Tubes Photodiodes Array Detectors Photographic Emulsion Photodiode Arrays Non-Silicon Array Detectors
  • 30.
    Applications of Ramanspectroscopy Raman spectroscopy is commonly used in chemistry, since vibrational information is specific to the chemical bonds and symmetry of molecules. Therefore, it provides a fingerprint by which the molecule can be identified. In solid-state physics, spontaneous Raman spectroscopy is used to, characterize materials, measure temperature, and find the crystallographic orientation of a sample. Raman spectroscopy can be used to observe other low frequency excitations of the solid, such as plasmons, magnons, and superconducting gap excitations
  • 31.
    Spatially-offset Raman spectroscopy(SORS), which is less sensitive to surface layers than conventional Raman, can be used to discover counterfeit drugs without opening their packaging, and for non-invasive monitoring of biological tissue Raman spectroscopy can be used to investigate the chemical composition of historical documents such as and contribute to knowledge of the social and economic conditions at the time the documents were produced. Raman spectroscopy is being investigated as a means to detect explosives for airport security.
  • 32.
    Raman spectroscopy canbe used as a technique for identification of seafloor hydrothermal and cold seep minerals Used to discriminate between healthy and unhealthy tissues, or to determine the degree of progress of a certain disease. Used in medicine , aiming to the development of new therapeutic drugs and in the diagnosis of arteriosclerosis and cancer.
  • 33.
    References Colin N. Banwell, Elaine M.McCash, 1994. Fundamentals of Spectroscopy, Tata McGraw-Hill Publishing Company Limited, New Delhi, 308p. B B Laud, 1991.Lasers and non linear optics, New age International(P) Limited, New Delhi,261p. H S Randhawa, 2003. Modern Molecular Spectroscopy, Macmillan India LTD, New Delhi,584p.
  • 34.