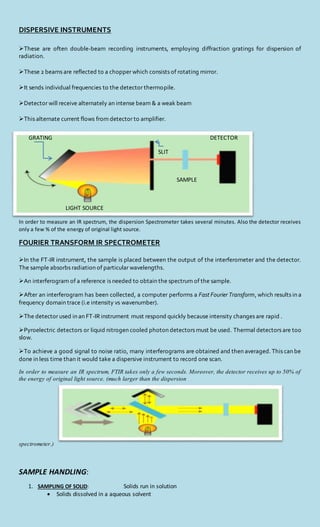
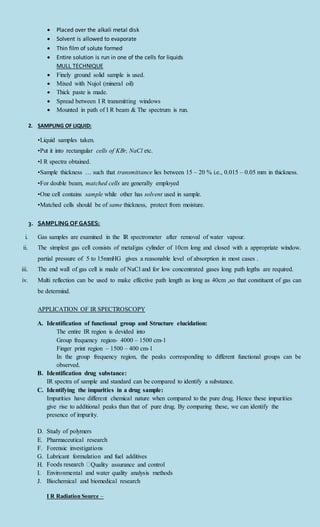
SlideShare a Scribd company logo
IR SPECTROSCOPY
Infrared spectroscopy (IR) measures the bond vibration frequencies in a molecule and is used to determine the
functional groups.
The infrared region constitutes 3 parts-
a) The near IR (0.8 -2.5µm) (12,500-4000cm-1)
b) The middle IR (2.5 -15µm) (4000-667cm-1)
i) Group frequency Region (4000-1500cm-1)
i i) Finger print Region (1500-667cm-1)
c) The far IR (15-200µm) (667-50cm-1)
 Most of the analytical applicationsare confinedtothe middle IR region because absorption of organic molecules are
high in this region.
Wave numberismostlyusedmeasure inIRabsorptionbecause wave numbersare largervalues&easyto handle than
wave length which are measured in µm.
 E = hν = hc/λ = hcν¯
It gives sufficient information about the structure of a compound.
PRINCIPLE
When infrared light or radiation hits a molecule , the bonds in the molecule absorb the energy of the infrared and
respond by vibrating.
IR SPECTROSCOPY SAMPLE DETECTOR
MODES OF MOLECULAR VIBRATIONS
There are 2 types of vibrations.
1) Stretching vibrations 2) Bending vibrations
• 1)Stretching vibrations: in this bond length is altered. They are of 2 types
a) symmetrical stretching: 2 bonds increase or decrease in length.
b) Asymmetrical stretching: in this one bond length is increased and other is decreased.
2)Bending vibrations: These are also called as deformations. •In this bond angle is altered. •These are of 2 types
•a) in plane bending→ scissoring, rocking •b) out plane bending→ wagging, twisting
Scissoring: Thisisan in plane bending.Inthisbondanglesare decreased. 2 atoms approacheach other.
Rocking: In thismovementof atomstakesplace insame direction.
Wagging: It isan out of plane bending.Inthis2 atomsmove to one side of the plane.
Twisting: In this one atom moves above the plane and the other atom moves below the plane.
NUMBER OF VIBRATIONAL MODES
A molecule can vibrate in many ways, and each way is called a vibrational mode.
If a molecule contains ‘N’ atoms, total number of vibrational modes
For linear molecule it is (3N-5)
For non linear molecule it is (3N-6)
Eg: H2O, a non-
linear molecule, will have 3 × 3 – 6 = 3 degrees of vibrational freedom, or modes.
VIBRATIONAL MOTION :
It occurs when atoms in a molecule are in periodic motion while the molecule as a whole has constant
translational and rotational motion.
The frequency of the periodic motion is known as a vibration frequency.
The value of stretching vibrational frequency of a bond can be calculated by the application of hooke’s law.
ν/c = ν¯ = 1/2пc[k/m1m2/m1+m2]1/2
= 1/2пc√k/μ
Where, μ→ reduced mass
m1&m2 →masses of the atoms
k →force constant
c →velocity of radiation
Factors influencing vibrational Frequencies
Calculated value of frequency of absorption for a particular bond is never exactly equal to its experimental
value.
There are many factors which are responsible for vibrational shifts
1)Vibrational coupling:
•it is observed in compounds containing –CH2 &
-CH3.
EG. Carboxylic acid anhydrides , amides , aldehydes
2) Hydrogen bonding:
Hydrogenbonding brings about remarkable downward frequency shifts.
Strongerthe hydrogenbonding,greateris theabsorptionshift towards lower wave length than thenormal
value.
There is 2 types of hydrogen bonding
a) inter molecular→ broad bands
b) intra molecular → sharp bands
•hydrogen bonding in O-H and N-H compounds deserve special attention.
•Eg: alcohols & phenols , enols & chelates
3) Electronic effects:
In this the frequency shifts are due to electronic effects which include conjugation, mesomeric effect,
inductive effect.
a) conjugation: conjugation lowers the absorption frequency of C=O stretching whether the conjugation
is due to α,β- unsaturation or due to an aromatic ring.
b) mesomeric effect: a molecule can be represented by 2or more structures that differ only in the
arrangement of electrons.
c) inductive effect: depends upon the intrinsic tendency of a substituent to either release or withdraw
electrons.
TYPES OF INSTRUMENTATION:
There are 2 types of infrared spectrophotometer, characterized by the manner in which the ir frequencies are
handled.
1) dispersive type (IR)
2) interferometric type(FTIR)
In dispersive type the infrared light is separated into individual frequencies by dispersion, using a grating
monochromator.
In interferometric type the ir frequencies are allowed to interact to produce an interference pattern and this
pattern is then analyzed, to determine individual frequencies and their intensities.
DISPERSIVE INSTRUMENTS
These are often double-beam recording instruments, employing diffraction gratings for dispersion of
radiation.
These 2 beams are reflected to a chopper which consists of rotating mirror.
It sends individual frequencies to the detector thermopile.
Detector will receive alternately an intense beam & a weak beam
This alternate current flows from detector to amplifier.
GRATING DETECTOR
SLIT
SAMPLE
LIGHT SOURCE
In order to measure an IR spectrum, the dispersion Spectrometer takes several minutes. Also the detector receives
only a few % of the energy of original light source.
FOURIER TRANSFORM IR SPECTROMETER
In the FT-IR instrument, the sample is placed between the output of the interferometer and the detector.
The sample absorbs radiation of particular wavelengths.
An interferogram of a reference is needed to obtain the spectrum of the sample.
After an interferogram has been collected, a computer performs a Fast Fourier Transform, which results in a
frequency domain trace (i.e intensity vs wavenumber).
The detector used in an FT-IR instrument must respond quickly because intensity changes are rapid .
Pyroelectric detectors or liquid nitrogen cooled photon detectors must be used. Thermal detectors are too
slow.
To achieve a good signal to noise ratio, many interferograms are obtained and then averaged. This can be
done in less time than it would take a dispersive instrument to record one scan.
In order to measure an IR spectrum, FTIR takes only a few seconds. Moreover, the detector receives up to 50% of
the energy of original light source. (much larger than the dispersion
spectrometer.)
SAMPLE HANDLING:
1. SAMPLING OF SOLID: Solids run in solution
 Solids dissolved in a aqueous solvent
 Placed over the alkali metal disk
 Solvent is allowed to evaporate
 Thin film of solute formed
 Entire solution is run in one of the cells for liquids
MULL TECHNIQUE
 Finely ground solid sample is used.
 Mixed with Nujol (mineral oil)
 Thick paste is made.
 Spread between I R transmitting windows
 Mounted in path of I R beam & The spectrum is run.
2. SAMPLING OF LIQUID:
•Liquid samples taken.
•Put it into rectangular cells of KBr, NaCl etc.
•I R spectra obtained.
•Sample thickness … such that transmittance lies between 15 – 20 % i.e., 0.015 – 0.05 mm in thickness.
•For double beam, matched cells are generally employed
•One cell contains sample while other has solvent used in sample.
•Matched cells should be of same thickness, protect from moisture.
3. SAMPLING OF GASES:
i. Gas samples are examined in the lR spectrometer after removal of water vapour.
ii. The simplest gas cell consists of metal/gas cylinder of 10cm long and closed with a appropriate window.
partial pressure of 5 to 15mmHG gives a reasonable level of absorption in most cases .
iii. The end wall of gas cell is made of NaCl and for low concentrated gases long path legths are required.
iv. Multi reflection can be used to make effective path length as long as 40cm ,so that constituent of gas can
be determind.
APPLICATION OF IR SPECTROSCOPY
A. Identification of functional group and Structure elucidation:
The entire IR region is devided into
Group frequency region- 4000 – 1500 cm-1
Finger print region – 1500 – 400 cm-1
In the group frequency region, the peaks corresponding to different functional groups can be
observed.
B. Identification drug substance:
IR spectra of sample and standard can be compared to identify a substance.
C. Identifying the impurities in a drug sample:
Impurities have different chemical nature when compared to the pure drug. Hence these impurities
give rise to additional peaks than that of pure drug. By comparing these, we can identify the
presence of impurity.
D. Study of polymers
E. Pharmaceutical research
F. Forensic investigations
G. Lubricant formulation and fuel additives
H. Quality assurance and control
I. Environmental and water quality analysis methods
J. Biochemical and biomedical research
I R Radiation Source –
Incandescent lamp
Nernst Glower
Globar Source
Mercury Arc
DETECTORS:-
-Bolometers
– Thermocouple
– Thermistors
– GolayCells
– Photoconductivitycell
– Semiconductor
– Pyroelectricdetectors

More Related Content

What's hot

MASS SPECTROSCOPY & ITS INSTRUMENTATION
MASS SPECTROSCOPY & ITS INSTRUMENTATIONMASS SPECTROSCOPY & ITS INSTRUMENTATION
MASS SPECTROSCOPY & ITS INSTRUMENTATION
ROHIT
 
Nmr spectroscopy
Nmr spectroscopyNmr spectroscopy
Nmr spectroscopy
TATHAGATA CHAKRABORTY
 
Chemical shift
Chemical shiftChemical shift
Chemical shift
Arantha Jessy Joseph
 
Beer Lambert's Law
Beer Lambert's LawBeer Lambert's Law
Beer Lambert's Law
प्रतिक्षा
 
Proton magnetic resonance spectroscopy
Proton magnetic resonance spectroscopyProton magnetic resonance spectroscopy
Proton magnetic resonance spectroscopy
hazem youssef
 
Spin spin splitting (n+1 Rule) NMR spectroscopy
Spin spin splitting (n+1 Rule) NMR spectroscopySpin spin splitting (n+1 Rule) NMR spectroscopy
Spin spin splitting (n+1 Rule) NMR spectroscopy
HumnaMehmood
 
IR Spectroscopy
IR Spectroscopy IR Spectroscopy
IR Spectroscopy
Ravi Kumar Yadav
 
Gel electrophoresis
Gel electrophoresisGel electrophoresis
Gel electrophoresis
Tapeshwar Yadav
 
FT NMR
FT NMRFT NMR
FT NMR
Rahul B S
 
SlideShare Presentation on Mass spectrophotometer
SlideShare Presentation on Mass spectrophotometerSlideShare Presentation on Mass spectrophotometer
SlideShare Presentation on Mass spectrophotometer
Naveen K L
 
Ion mobility spectrometery
Ion mobility spectrometeryIon mobility spectrometery
Ion mobility spectrometery
Ashish Sharma
 
Nmr soni
Nmr soniNmr soni
Nmr soni
Swati Kumari
 
Dispersive & FTIR
Dispersive & FTIRDispersive & FTIR
Dispersive & FTIR
bhavanavedantam
 
NMR SPECTROSCOPY
NMR SPECTROSCOPYNMR SPECTROSCOPY
NMR SPECTROSCOPY
VidyaNani
 
IR spectroscopy
IR spectroscopy IR spectroscopy
IR spectroscopy
Japheth Ofosu
 
Nuclear Magnetic Resonance Spectroscopy
Nuclear Magnetic Resonance SpectroscopyNuclear Magnetic Resonance Spectroscopy
Nuclear Magnetic Resonance Spectroscopy
ASUTOSH MOHAPATRA
 
Nmr instrumentation
Nmr  instrumentationNmr  instrumentation
Nmr instrumentation
Shivam Sharma
 
UV Spectroscopy and Its Applications
UV Spectroscopy  and Its ApplicationsUV Spectroscopy  and Its Applications
UV Spectroscopy and Its Applications
Vikram Choudhary
 
C-13 NMR Spectroscopy
C-13 NMR SpectroscopyC-13 NMR Spectroscopy
C-13 NMR Spectroscopy
MANISHSAHU106
 

What's hot (20)

MASS SPECTROSCOPY & ITS INSTRUMENTATION
MASS SPECTROSCOPY & ITS INSTRUMENTATIONMASS SPECTROSCOPY & ITS INSTRUMENTATION
MASS SPECTROSCOPY & ITS INSTRUMENTATION
 
Nmr spectroscopy
Nmr spectroscopyNmr spectroscopy
Nmr spectroscopy
 
Chemical shift
Chemical shiftChemical shift
Chemical shift
 
NMR Spectroscopy
NMR SpectroscopyNMR Spectroscopy
NMR Spectroscopy
 
Beer Lambert's Law
Beer Lambert's LawBeer Lambert's Law
Beer Lambert's Law
 
Proton magnetic resonance spectroscopy
Proton magnetic resonance spectroscopyProton magnetic resonance spectroscopy
Proton magnetic resonance spectroscopy
 
Spin spin splitting (n+1 Rule) NMR spectroscopy
Spin spin splitting (n+1 Rule) NMR spectroscopySpin spin splitting (n+1 Rule) NMR spectroscopy
Spin spin splitting (n+1 Rule) NMR spectroscopy
 
IR Spectroscopy
IR Spectroscopy IR Spectroscopy
IR Spectroscopy
 
Gel electrophoresis
Gel electrophoresisGel electrophoresis
Gel electrophoresis
 
FT NMR
FT NMRFT NMR
FT NMR
 
SlideShare Presentation on Mass spectrophotometer
SlideShare Presentation on Mass spectrophotometerSlideShare Presentation on Mass spectrophotometer
SlideShare Presentation on Mass spectrophotometer
 
Ion mobility spectrometery
Ion mobility spectrometeryIon mobility spectrometery
Ion mobility spectrometery
 
Nmr soni
Nmr soniNmr soni
Nmr soni
 
Dispersive & FTIR
Dispersive & FTIRDispersive & FTIR
Dispersive & FTIR
 
NMR SPECTROSCOPY
NMR SPECTROSCOPYNMR SPECTROSCOPY
NMR SPECTROSCOPY
 
IR spectroscopy
IR spectroscopy IR spectroscopy
IR spectroscopy
 
Nuclear Magnetic Resonance Spectroscopy
Nuclear Magnetic Resonance SpectroscopyNuclear Magnetic Resonance Spectroscopy
Nuclear Magnetic Resonance Spectroscopy
 
Nmr instrumentation
Nmr  instrumentationNmr  instrumentation
Nmr instrumentation
 
UV Spectroscopy and Its Applications
UV Spectroscopy  and Its ApplicationsUV Spectroscopy  and Its Applications
UV Spectroscopy and Its Applications
 
C-13 NMR Spectroscopy
C-13 NMR SpectroscopyC-13 NMR Spectroscopy
C-13 NMR Spectroscopy
 

Similar to Ir spectroscopy PRESENTED BY DIPSANKAR

IR Spectroscopy - Sudheerkumar Kamarapu, M. Pharmacy Lecture pdf
IR Spectroscopy - Sudheerkumar Kamarapu, M. Pharmacy Lecture pdfIR Spectroscopy - Sudheerkumar Kamarapu, M. Pharmacy Lecture pdf
IR Spectroscopy - Sudheerkumar Kamarapu, M. Pharmacy Lecture pdf
Dr. Sudheer Kumar Kamarapu
 
INFRARED SPECTROSCOPY to find the functional group
INFRARED SPECTROSCOPY to find the functional groupINFRARED SPECTROSCOPY to find the functional group
INFRARED SPECTROSCOPY to find the functional group
ssusera34ec2
 
INFRARED(IR) SPECTROSCOPY OF NATURAL PRODUCTS
INFRARED(IR) SPECTROSCOPY OF NATURAL PRODUCTSINFRARED(IR) SPECTROSCOPY OF NATURAL PRODUCTS
InfraRed (IR) spectroscopy
InfraRed (IR) spectroscopyInfraRed (IR) spectroscopy
InfraRed (IR) spectroscopy
Harish Chopra
 
handbook of instrumental
handbook of instrumentalhandbook of instrumental
handbook of instrumental
Liz Ram
 
IR SPECTROCOPY, Instrumentation of IR spectroscopy, Application of IR spectro...
IR SPECTROCOPY, Instrumentation of IR spectroscopy, Application of IR spectro...IR SPECTROCOPY, Instrumentation of IR spectroscopy, Application of IR spectro...
IR SPECTROCOPY, Instrumentation of IR spectroscopy, Application of IR spectro...
DipeshGamare
 
Unit 5 Spectroscopic Techniques-converted (1) (1).pdf
Unit 5 Spectroscopic Techniques-converted (1) (1).pdfUnit 5 Spectroscopic Techniques-converted (1) (1).pdf
Unit 5 Spectroscopic Techniques-converted (1) (1).pdf
SurajShinde558909
 
Ftir final presentation
Ftir final presentationFtir final presentation
Ftir final presentation
Tejasvi Bhatia
 
Spectroscpy methods.pptx
Spectroscpy methods.pptxSpectroscpy methods.pptx
Spectroscpy methods.pptx
SonaliGadge4
 
Ftir intro
Ftir introFtir intro
Ftir intro
DURRE SHEHWAR
 
Infrared spectroscopy
Infrared spectroscopy Infrared spectroscopy
Infrared spectroscopy
Dr NEETHU ASOKAN
 
Infrared spectroscopy
Infrared spectroscopyInfrared spectroscopy
Infrared spectroscopy
Shabnamkhan113
 
Infrared spectroscopy i
Infrared spectroscopy  iInfrared spectroscopy  i
Infrared spectroscopy i
DrBasavarajaiahSm
 
Field Ion - Infrared- Raman Spectroscopy
Field Ion - Infrared- Raman SpectroscopyField Ion - Infrared- Raman Spectroscopy
Field Ion - Infrared- Raman Spectroscopy
SAMEER VISHWAKARMA
 
Biomolecular andcellularresearchdevices fin
Biomolecular andcellularresearchdevices finBiomolecular andcellularresearchdevices fin
Biomolecular andcellularresearchdevices finMUBOSScz
 
Spectroscopy.ppt
Spectroscopy.pptSpectroscopy.ppt
Spectroscopy.ppt
tahirmurad
 

Similar to Ir spectroscopy PRESENTED BY DIPSANKAR (20)

IR Spectroscopy - Sudheerkumar Kamarapu, M. Pharmacy Lecture pdf
IR Spectroscopy - Sudheerkumar Kamarapu, M. Pharmacy Lecture pdfIR Spectroscopy - Sudheerkumar Kamarapu, M. Pharmacy Lecture pdf
IR Spectroscopy - Sudheerkumar Kamarapu, M. Pharmacy Lecture pdf
 
INFRARED SPECTROSCOPY to find the functional group
INFRARED SPECTROSCOPY to find the functional groupINFRARED SPECTROSCOPY to find the functional group
INFRARED SPECTROSCOPY to find the functional group
 
Ftir
FtirFtir
Ftir
 
INFRARED(IR) SPECTROSCOPY OF NATURAL PRODUCTS
INFRARED(IR) SPECTROSCOPY OF NATURAL PRODUCTSINFRARED(IR) SPECTROSCOPY OF NATURAL PRODUCTS
INFRARED(IR) SPECTROSCOPY OF NATURAL PRODUCTS
 
InfraRed (IR) spectroscopy
InfraRed (IR) spectroscopyInfraRed (IR) spectroscopy
InfraRed (IR) spectroscopy
 
handbook of instrumental
handbook of instrumentalhandbook of instrumental
handbook of instrumental
 
IR SPECTROCOPY, Instrumentation of IR spectroscopy, Application of IR spectro...
IR SPECTROCOPY, Instrumentation of IR spectroscopy, Application of IR spectro...IR SPECTROCOPY, Instrumentation of IR spectroscopy, Application of IR spectro...
IR SPECTROCOPY, Instrumentation of IR spectroscopy, Application of IR spectro...
 
Unit 5 Spectroscopic Techniques-converted (1) (1).pdf
Unit 5 Spectroscopic Techniques-converted (1) (1).pdfUnit 5 Spectroscopic Techniques-converted (1) (1).pdf
Unit 5 Spectroscopic Techniques-converted (1) (1).pdf
 
Ftir final presentation
Ftir final presentationFtir final presentation
Ftir final presentation
 
Ir
IrIr
Ir
 
Spectroscpy methods.pptx
Spectroscpy methods.pptxSpectroscpy methods.pptx
Spectroscpy methods.pptx
 
Ftir intro
Ftir introFtir intro
Ftir intro
 
Infrared spectroscopy
Infrared spectroscopy Infrared spectroscopy
Infrared spectroscopy
 
Infrared spectroscopy
Infrared spectroscopyInfrared spectroscopy
Infrared spectroscopy
 
Swati nir
Swati nirSwati nir
Swati nir
 
Infrared spectroscopy i
Infrared spectroscopy  iInfrared spectroscopy  i
Infrared spectroscopy i
 
Field Ion - Infrared- Raman Spectroscopy
Field Ion - Infrared- Raman SpectroscopyField Ion - Infrared- Raman Spectroscopy
Field Ion - Infrared- Raman Spectroscopy
 
Biomolecular andcellularresearchdevices fin
Biomolecular andcellularresearchdevices finBiomolecular andcellularresearchdevices fin
Biomolecular andcellularresearchdevices fin
 
Spectroscopy.ppt
Spectroscopy.pptSpectroscopy.ppt
Spectroscopy.ppt
 
Presentation2
Presentation2Presentation2
Presentation2
 

Recently uploaded

Polish students' mobility in the Czech Republic
Polish students' mobility in the Czech RepublicPolish students' mobility in the Czech Republic
Polish students' mobility in the Czech Republic
Anna Sz.
 
Supporting (UKRI) OA monographs at Salford.pptx
Supporting (UKRI) OA monographs at Salford.pptxSupporting (UKRI) OA monographs at Salford.pptx
Supporting (UKRI) OA monographs at Salford.pptx
Jisc
 
Digital Tools and AI for Teaching Learning and Research
Digital Tools and AI for Teaching Learning and ResearchDigital Tools and AI for Teaching Learning and Research
Digital Tools and AI for Teaching Learning and Research
Vikramjit Singh
 
Unit 2- Research Aptitude (UGC NET Paper I).pdf
Unit 2- Research Aptitude (UGC NET Paper I).pdfUnit 2- Research Aptitude (UGC NET Paper I).pdf
Unit 2- Research Aptitude (UGC NET Paper I).pdf
Thiyagu K
 
Phrasal Verbs.XXXXXXXXXXXXXXXXXXXXXXXXXX
Phrasal Verbs.XXXXXXXXXXXXXXXXXXXXXXXXXXPhrasal Verbs.XXXXXXXXXXXXXXXXXXXXXXXXXX
Phrasal Verbs.XXXXXXXXXXXXXXXXXXXXXXXXXX
MIRIAMSALINAS13
 
Chapter 3 - Islamic Banking Products and Services.pptx
Chapter 3 - Islamic Banking Products and Services.pptxChapter 3 - Islamic Banking Products and Services.pptx
Chapter 3 - Islamic Banking Products and Services.pptx
Mohd Adib Abd Muin, Senior Lecturer at Universiti Utara Malaysia
 
Overview on Edible Vaccine: Pros & Cons with Mechanism
Overview on Edible Vaccine: Pros & Cons with MechanismOverview on Edible Vaccine: Pros & Cons with Mechanism
Overview on Edible Vaccine: Pros & Cons with Mechanism
DeeptiGupta154
 
The Challenger.pdf DNHS Official Publication
The Challenger.pdf DNHS Official PublicationThe Challenger.pdf DNHS Official Publication
The Challenger.pdf DNHS Official Publication
Delapenabediema
 
PART A. Introduction to Costumer Service
PART A. Introduction to Costumer ServicePART A. Introduction to Costumer Service
PART A. Introduction to Costumer Service
PedroFerreira53928
 
How to Create Map Views in the Odoo 17 ERP
How to Create Map Views in the Odoo 17 ERPHow to Create Map Views in the Odoo 17 ERP
How to Create Map Views in the Odoo 17 ERP
Celine George
 
The Roman Empire A Historical Colossus.pdf
The Roman Empire A Historical Colossus.pdfThe Roman Empire A Historical Colossus.pdf
The Roman Empire A Historical Colossus.pdf
kaushalkr1407
 
Operation Blue Star - Saka Neela Tara
Operation Blue Star   -  Saka Neela TaraOperation Blue Star   -  Saka Neela Tara
Operation Blue Star - Saka Neela Tara
Balvir Singh
 
The Art Pastor's Guide to Sabbath | Steve Thomason
The Art Pastor's Guide to Sabbath | Steve ThomasonThe Art Pastor's Guide to Sabbath | Steve Thomason
The Art Pastor's Guide to Sabbath | Steve Thomason
Steve Thomason
 
Introduction to Quality Improvement Essentials
Introduction to Quality Improvement EssentialsIntroduction to Quality Improvement Essentials
Introduction to Quality Improvement Essentials
Excellence Foundation for South Sudan
 
Model Attribute Check Company Auto Property
Model Attribute  Check Company Auto PropertyModel Attribute  Check Company Auto Property
Model Attribute Check Company Auto Property
Celine George
 
TESDA TM1 REVIEWER FOR NATIONAL ASSESSMENT WRITTEN AND ORAL QUESTIONS WITH A...
TESDA TM1 REVIEWER  FOR NATIONAL ASSESSMENT WRITTEN AND ORAL QUESTIONS WITH A...TESDA TM1 REVIEWER  FOR NATIONAL ASSESSMENT WRITTEN AND ORAL QUESTIONS WITH A...
TESDA TM1 REVIEWER FOR NATIONAL ASSESSMENT WRITTEN AND ORAL QUESTIONS WITH A...
EugeneSaldivar
 
Ethnobotany and Ethnopharmacology ......
Ethnobotany and Ethnopharmacology ......Ethnobotany and Ethnopharmacology ......
Ethnobotany and Ethnopharmacology ......
Ashokrao Mane college of Pharmacy Peth-Vadgaon
 
Students, digital devices and success - Andreas Schleicher - 27 May 2024..pptx
Students, digital devices and success - Andreas Schleicher - 27 May 2024..pptxStudents, digital devices and success - Andreas Schleicher - 27 May 2024..pptx
Students, digital devices and success - Andreas Schleicher - 27 May 2024..pptx
EduSkills OECD
 
How to Make a Field invisible in Odoo 17
How to Make a Field invisible in Odoo 17How to Make a Field invisible in Odoo 17
How to Make a Field invisible in Odoo 17
Celine George
 
ESC Beyond Borders _From EU to You_ InfoPack general.pdf
ESC Beyond Borders _From EU to You_ InfoPack general.pdfESC Beyond Borders _From EU to You_ InfoPack general.pdf
ESC Beyond Borders _From EU to You_ InfoPack general.pdf
Fundacja Rozwoju Społeczeństwa Przedsiębiorczego
 

Recently uploaded (20)

Polish students' mobility in the Czech Republic
Polish students' mobility in the Czech RepublicPolish students' mobility in the Czech Republic
Polish students' mobility in the Czech Republic
 
Supporting (UKRI) OA monographs at Salford.pptx
Supporting (UKRI) OA monographs at Salford.pptxSupporting (UKRI) OA monographs at Salford.pptx
Supporting (UKRI) OA monographs at Salford.pptx
 
Digital Tools and AI for Teaching Learning and Research
Digital Tools and AI for Teaching Learning and ResearchDigital Tools and AI for Teaching Learning and Research
Digital Tools and AI for Teaching Learning and Research
 
Unit 2- Research Aptitude (UGC NET Paper I).pdf
Unit 2- Research Aptitude (UGC NET Paper I).pdfUnit 2- Research Aptitude (UGC NET Paper I).pdf
Unit 2- Research Aptitude (UGC NET Paper I).pdf
 
Phrasal Verbs.XXXXXXXXXXXXXXXXXXXXXXXXXX
Phrasal Verbs.XXXXXXXXXXXXXXXXXXXXXXXXXXPhrasal Verbs.XXXXXXXXXXXXXXXXXXXXXXXXXX
Phrasal Verbs.XXXXXXXXXXXXXXXXXXXXXXXXXX
 
Chapter 3 - Islamic Banking Products and Services.pptx
Chapter 3 - Islamic Banking Products and Services.pptxChapter 3 - Islamic Banking Products and Services.pptx
Chapter 3 - Islamic Banking Products and Services.pptx
 
Overview on Edible Vaccine: Pros & Cons with Mechanism
Overview on Edible Vaccine: Pros & Cons with MechanismOverview on Edible Vaccine: Pros & Cons with Mechanism
Overview on Edible Vaccine: Pros & Cons with Mechanism
 
The Challenger.pdf DNHS Official Publication
The Challenger.pdf DNHS Official PublicationThe Challenger.pdf DNHS Official Publication
The Challenger.pdf DNHS Official Publication
 
PART A. Introduction to Costumer Service
PART A. Introduction to Costumer ServicePART A. Introduction to Costumer Service
PART A. Introduction to Costumer Service
 
How to Create Map Views in the Odoo 17 ERP
How to Create Map Views in the Odoo 17 ERPHow to Create Map Views in the Odoo 17 ERP
How to Create Map Views in the Odoo 17 ERP
 
The Roman Empire A Historical Colossus.pdf
The Roman Empire A Historical Colossus.pdfThe Roman Empire A Historical Colossus.pdf
The Roman Empire A Historical Colossus.pdf
 
Operation Blue Star - Saka Neela Tara
Operation Blue Star   -  Saka Neela TaraOperation Blue Star   -  Saka Neela Tara
Operation Blue Star - Saka Neela Tara
 
The Art Pastor's Guide to Sabbath | Steve Thomason
The Art Pastor's Guide to Sabbath | Steve ThomasonThe Art Pastor's Guide to Sabbath | Steve Thomason
The Art Pastor's Guide to Sabbath | Steve Thomason
 
Introduction to Quality Improvement Essentials
Introduction to Quality Improvement EssentialsIntroduction to Quality Improvement Essentials
Introduction to Quality Improvement Essentials
 
Model Attribute Check Company Auto Property
Model Attribute  Check Company Auto PropertyModel Attribute  Check Company Auto Property
Model Attribute Check Company Auto Property
 
TESDA TM1 REVIEWER FOR NATIONAL ASSESSMENT WRITTEN AND ORAL QUESTIONS WITH A...
TESDA TM1 REVIEWER  FOR NATIONAL ASSESSMENT WRITTEN AND ORAL QUESTIONS WITH A...TESDA TM1 REVIEWER  FOR NATIONAL ASSESSMENT WRITTEN AND ORAL QUESTIONS WITH A...
TESDA TM1 REVIEWER FOR NATIONAL ASSESSMENT WRITTEN AND ORAL QUESTIONS WITH A...
 
Ethnobotany and Ethnopharmacology ......
Ethnobotany and Ethnopharmacology ......Ethnobotany and Ethnopharmacology ......
Ethnobotany and Ethnopharmacology ......
 
Students, digital devices and success - Andreas Schleicher - 27 May 2024..pptx
Students, digital devices and success - Andreas Schleicher - 27 May 2024..pptxStudents, digital devices and success - Andreas Schleicher - 27 May 2024..pptx
Students, digital devices and success - Andreas Schleicher - 27 May 2024..pptx
 
How to Make a Field invisible in Odoo 17
How to Make a Field invisible in Odoo 17How to Make a Field invisible in Odoo 17
How to Make a Field invisible in Odoo 17
 
ESC Beyond Borders _From EU to You_ InfoPack general.pdf
ESC Beyond Borders _From EU to You_ InfoPack general.pdfESC Beyond Borders _From EU to You_ InfoPack general.pdf
ESC Beyond Borders _From EU to You_ InfoPack general.pdf
 

Ir spectroscopy PRESENTED BY DIPSANKAR

  • 1. IR SPECTROSCOPY Infrared spectroscopy (IR) measures the bond vibration frequencies in a molecule and is used to determine the functional groups. The infrared region constitutes 3 parts- a) The near IR (0.8 -2.5µm) (12,500-4000cm-1) b) The middle IR (2.5 -15µm) (4000-667cm-1) i) Group frequency Region (4000-1500cm-1) i i) Finger print Region (1500-667cm-1) c) The far IR (15-200µm) (667-50cm-1)  Most of the analytical applicationsare confinedtothe middle IR region because absorption of organic molecules are high in this region. Wave numberismostlyusedmeasure inIRabsorptionbecause wave numbersare largervalues&easyto handle than wave length which are measured in µm.  E = hν = hc/λ = hcν¯ It gives sufficient information about the structure of a compound. PRINCIPLE When infrared light or radiation hits a molecule , the bonds in the molecule absorb the energy of the infrared and respond by vibrating. IR SPECTROSCOPY SAMPLE DETECTOR MODES OF MOLECULAR VIBRATIONS There are 2 types of vibrations. 1) Stretching vibrations 2) Bending vibrations • 1)Stretching vibrations: in this bond length is altered. They are of 2 types a) symmetrical stretching: 2 bonds increase or decrease in length. b) Asymmetrical stretching: in this one bond length is increased and other is decreased. 2)Bending vibrations: These are also called as deformations. •In this bond angle is altered. •These are of 2 types •a) in plane bending→ scissoring, rocking •b) out plane bending→ wagging, twisting Scissoring: Thisisan in plane bending.Inthisbondanglesare decreased. 2 atoms approacheach other. Rocking: In thismovementof atomstakesplace insame direction. Wagging: It isan out of plane bending.Inthis2 atomsmove to one side of the plane. Twisting: In this one atom moves above the plane and the other atom moves below the plane. NUMBER OF VIBRATIONAL MODES A molecule can vibrate in many ways, and each way is called a vibrational mode. If a molecule contains ‘N’ atoms, total number of vibrational modes For linear molecule it is (3N-5) For non linear molecule it is (3N-6) Eg: H2O, a non- linear molecule, will have 3 × 3 – 6 = 3 degrees of vibrational freedom, or modes. VIBRATIONAL MOTION :
  • 2. It occurs when atoms in a molecule are in periodic motion while the molecule as a whole has constant translational and rotational motion. The frequency of the periodic motion is known as a vibration frequency. The value of stretching vibrational frequency of a bond can be calculated by the application of hooke’s law. ν/c = ν¯ = 1/2пc[k/m1m2/m1+m2]1/2 = 1/2пc√k/μ Where, μ→ reduced mass m1&m2 →masses of the atoms k →force constant c →velocity of radiation Factors influencing vibrational Frequencies Calculated value of frequency of absorption for a particular bond is never exactly equal to its experimental value. There are many factors which are responsible for vibrational shifts 1)Vibrational coupling: •it is observed in compounds containing –CH2 & -CH3. EG. Carboxylic acid anhydrides , amides , aldehydes 2) Hydrogen bonding: Hydrogenbonding brings about remarkable downward frequency shifts. Strongerthe hydrogenbonding,greateris theabsorptionshift towards lower wave length than thenormal value. There is 2 types of hydrogen bonding a) inter molecular→ broad bands b) intra molecular → sharp bands •hydrogen bonding in O-H and N-H compounds deserve special attention. •Eg: alcohols & phenols , enols & chelates 3) Electronic effects: In this the frequency shifts are due to electronic effects which include conjugation, mesomeric effect, inductive effect. a) conjugation: conjugation lowers the absorption frequency of C=O stretching whether the conjugation is due to α,β- unsaturation or due to an aromatic ring. b) mesomeric effect: a molecule can be represented by 2or more structures that differ only in the arrangement of electrons. c) inductive effect: depends upon the intrinsic tendency of a substituent to either release or withdraw electrons. TYPES OF INSTRUMENTATION: There are 2 types of infrared spectrophotometer, characterized by the manner in which the ir frequencies are handled. 1) dispersive type (IR) 2) interferometric type(FTIR) In dispersive type the infrared light is separated into individual frequencies by dispersion, using a grating monochromator. In interferometric type the ir frequencies are allowed to interact to produce an interference pattern and this pattern is then analyzed, to determine individual frequencies and their intensities.
  • 3. DISPERSIVE INSTRUMENTS These are often double-beam recording instruments, employing diffraction gratings for dispersion of radiation. These 2 beams are reflected to a chopper which consists of rotating mirror. It sends individual frequencies to the detector thermopile. Detector will receive alternately an intense beam & a weak beam This alternate current flows from detector to amplifier. GRATING DETECTOR SLIT SAMPLE LIGHT SOURCE In order to measure an IR spectrum, the dispersion Spectrometer takes several minutes. Also the detector receives only a few % of the energy of original light source. FOURIER TRANSFORM IR SPECTROMETER In the FT-IR instrument, the sample is placed between the output of the interferometer and the detector. The sample absorbs radiation of particular wavelengths. An interferogram of a reference is needed to obtain the spectrum of the sample. After an interferogram has been collected, a computer performs a Fast Fourier Transform, which results in a frequency domain trace (i.e intensity vs wavenumber). The detector used in an FT-IR instrument must respond quickly because intensity changes are rapid . Pyroelectric detectors or liquid nitrogen cooled photon detectors must be used. Thermal detectors are too slow. To achieve a good signal to noise ratio, many interferograms are obtained and then averaged. This can be done in less time than it would take a dispersive instrument to record one scan. In order to measure an IR spectrum, FTIR takes only a few seconds. Moreover, the detector receives up to 50% of the energy of original light source. (much larger than the dispersion spectrometer.) SAMPLE HANDLING: 1. SAMPLING OF SOLID: Solids run in solution  Solids dissolved in a aqueous solvent
  • 4.  Placed over the alkali metal disk  Solvent is allowed to evaporate  Thin film of solute formed  Entire solution is run in one of the cells for liquids MULL TECHNIQUE  Finely ground solid sample is used.  Mixed with Nujol (mineral oil)  Thick paste is made.  Spread between I R transmitting windows  Mounted in path of I R beam & The spectrum is run. 2. SAMPLING OF LIQUID: •Liquid samples taken. •Put it into rectangular cells of KBr, NaCl etc. •I R spectra obtained. •Sample thickness … such that transmittance lies between 15 – 20 % i.e., 0.015 – 0.05 mm in thickness. •For double beam, matched cells are generally employed •One cell contains sample while other has solvent used in sample. •Matched cells should be of same thickness, protect from moisture. 3. SAMPLING OF GASES: i. Gas samples are examined in the lR spectrometer after removal of water vapour. ii. The simplest gas cell consists of metal/gas cylinder of 10cm long and closed with a appropriate window. partial pressure of 5 to 15mmHG gives a reasonable level of absorption in most cases . iii. The end wall of gas cell is made of NaCl and for low concentrated gases long path legths are required. iv. Multi reflection can be used to make effective path length as long as 40cm ,so that constituent of gas can be determind. APPLICATION OF IR SPECTROSCOPY A. Identification of functional group and Structure elucidation: The entire IR region is devided into Group frequency region- 4000 – 1500 cm-1 Finger print region – 1500 – 400 cm-1 In the group frequency region, the peaks corresponding to different functional groups can be observed. B. Identification drug substance: IR spectra of sample and standard can be compared to identify a substance. C. Identifying the impurities in a drug sample: Impurities have different chemical nature when compared to the pure drug. Hence these impurities give rise to additional peaks than that of pure drug. By comparing these, we can identify the presence of impurity. D. Study of polymers E. Pharmaceutical research F. Forensic investigations G. Lubricant formulation and fuel additives H. Quality assurance and control I. Environmental and water quality analysis methods J. Biochemical and biomedical research I R Radiation Source –
  • 5. Incandescent lamp Nernst Glower Globar Source Mercury Arc DETECTORS:- -Bolometers – Thermocouple – Thermistors – GolayCells – Photoconductivitycell – Semiconductor – Pyroelectricdetectors