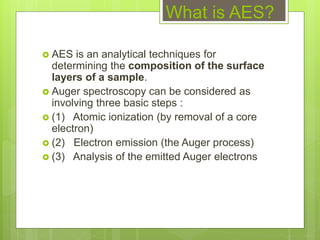
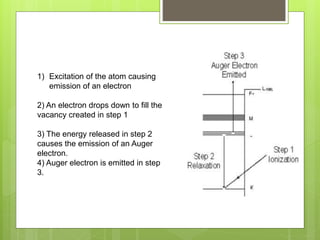
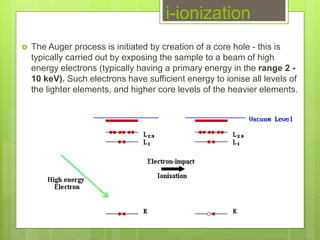
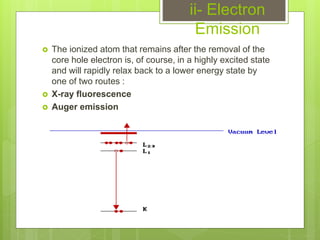
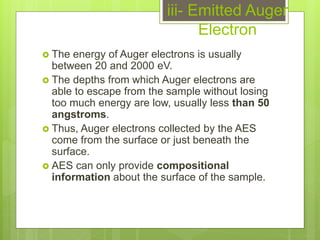
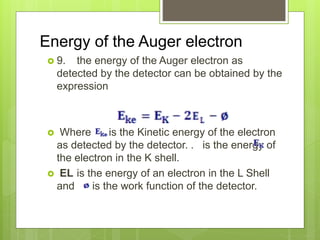
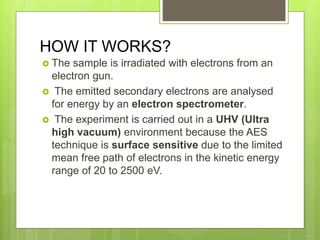
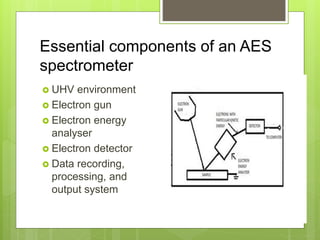
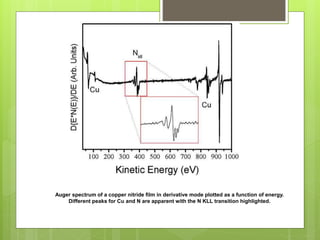
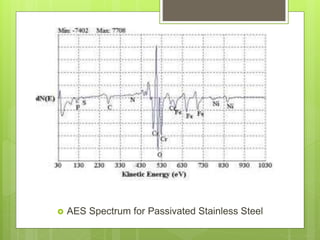
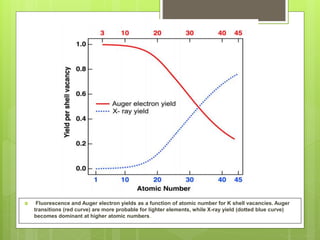
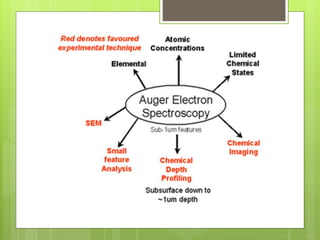
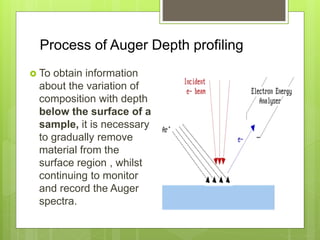
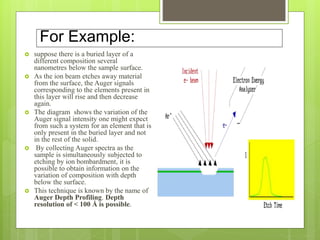
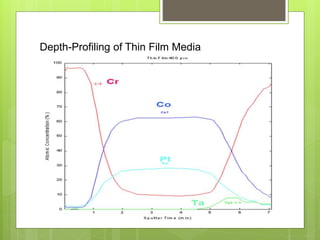
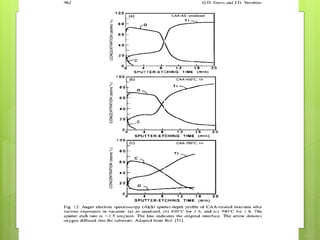
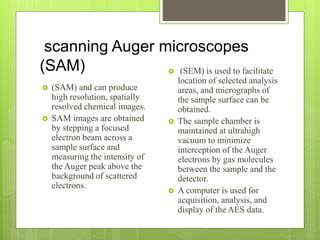
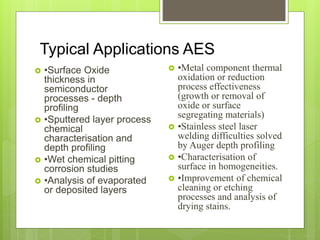
Auger Electron
Spectroscopy
By:
Hasan Jamal
What is AES?
 AES is an analytical techniques for
determining the composition of the surface
layers of a sample.
 Auger spectroscopy can be considered as
involving three basic steps :
 (1) Atomic ionization (by removal of a core
electron)
 (2) Electron emission (the Auger process)
 (3) Analysis of the emitted Auger electrons
1) Excitation of the atom causing
emission of an electron
2) An electron drops down to fill the
vacancy created in step 1
3) The energy released in step 2
causes the emission of an Auger
electron.
4) Auger electron is emitted in step
3.
 The Auger process is initiated by creation of a core hole - this is
typically carried out by exposing the sample to a beam of high
energy electrons (typically having a primary energy in the range 2 -
10 keV). Such electrons have sufficient energy to ionise all levels of
the lighter elements, and higher core levels of the heavier elements.
i-ionization
ii- Electron
Emission
 The ionized atom that remains after the removal of the
core hole electron is, of course, in a highly excited state
and will rapidly relax back to a lower energy state by
one of two routes :
 X-ray fluorescence
 Auger emission
iii- Emitted Auger
Electron
 The energy of Auger electrons is usually
between 20 and 2000 eV.
 The depths from which Auger electrons are
able to escape from the sample without losing
too much energy are low, usually less than 50
angstroms.
 Thus, Auger electrons collected by the AES
come from the surface or just beneath the
surface.
 AES can only provide compositional
information about the surface of the sample.
 Only atoms very close to the surface of the
specimen can emit the Auger electron.
 The energy of the Auger electron is a
characteristic of the element. Hence by
determination of the energy of the Auger
electron an idea about the composition of the
specimen can be obtained.
 8. Consider that the K Shell electron was
emitted as a secondary electron and it was
occupied by an L shell electron which in turn
knocked out another L shell electron as Auger
electron. This case would be represented by
the notation KLL.
Energy of the Auger electron
 9. the energy of the Auger electron as
detected by the detector can be obtained by the
expression
 Where is the Kinetic energy of the electron
as detected by the detector. . is the energy of
the electron in the K shell.
 EL is the energy of an electron in the L Shell
and is the work function of the detector.
HOW IT WORKS?
 The sample is irradiated with electrons from an
electron gun.
 The emitted secondary electrons are analysed
for energy by an electron spectrometer.
 The experiment is carried out in a UHV (Ultra
high vacuum) environment because the AES
technique is surface sensitive due to the limited
mean free path of electrons in the kinetic energy
range of 20 to 2500 eV.
Essential components of an AES
spectrometer
 UHV environment
 Electron gun
 Electron energy
analyser
 Electron detector
 Data recording,
processing, and
output system
Auger spectrum of a copper nitride film in derivative mode plotted as a function of energy.
Different peaks for Cu and N are apparent with the N KLL transition highlighted.
 AES Spectrum for Passivated Stainless Steel
 Fluorescence and Auger electron yields as a function of atomic number for K shell vacancies. Auger
transitions (red curve) are more probable for lighter elements, while X-ray yield (dotted blue curve)
becomes dominant at higher atomic numbers.
Auger depth profile
 For analysis beyond the top 1-5nm an inert gas ion
gun (normally Argon) can be used to sputter off
the surface layers.
 Alternating sputtering and AES spectral
acquisition permits chemical depth profiles to be
obtained down to depths of about 1μm into the
bulk.
 Sputter depth profiling reveals chemical depth
information.
 To obtain information
about the variation of
composition with depth
below the surface of a
sample, it is necessary
to gradually remove
material from the
surface region , whilst
continuing to monitor
and record the Auger
spectra.
Process of Auger Depth profiling
For Example:
 suppose there is a buried layer of a
different composition several
nanometres below the sample surface.
 As the ion beam etches away material
from the surface, the Auger signals
corresponding to the elements present in
this layer will rise and then decrease
again.
 The diagram shows the variation of the
Auger signal intensity one might expect
from such a system for an element that is
only present in the buried layer and not
in the rest of the solid.
 By collecting Auger spectra as the
sample is simultaneously subjected to
etching by ion bombardment, it is
possible to obtain information on the
variation of composition with depth
below the surface.
 This technique is known by the name of
Auger Depth Profiling. Depth
resolution of < 100 Å is possible.
Depth-Profiling of Thin Film Media
scanning Auger microscopes
(SAM)
 (SAM) and can produce
high resolution, spatially
resolved chemical images.
 SAM images are obtained
by stepping a focused
electron beam across a
sample surface and
measuring the intensity of
the Auger peak above the
background of scattered
electrons.
 (SEM) is used to facilitate
location of selected analysis
areas, and micrographs of
the sample surface can be
obtained.
 The sample chamber is
maintained at ultrahigh
vacuum to minimize
interception of the Auger
electrons by gas molecules
between the sample and the
detector.
 A computer is used for
acquisition, analysis, and
display of the AES data.
Typical Applications AES
 •Surface Oxide
thickness in
semiconductor
processes - depth
profiling
 •Sputtered layer process
chemical
characterisation and
depth profiling
 •Wet chemical pitting
corrosion studies
 •Analysis of evaporated
or deposited layers
 •Metal component thermal
oxidation or reduction
process effectiveness
(growth or removal of
oxide or surface
segregating materials)
 •Stainless steel laser
welding difficulties solved
by Auger depth profiling
 •Characterisation of
surface in homogeneities.
 •Improvement of chemical
cleaning or etching
processes and analysis of
drying stains.

Auger Electron Spectroscopy

  • 1.
  • 2.
    What is AES? AES is an analytical techniques for determining the composition of the surface layers of a sample.  Auger spectroscopy can be considered as involving three basic steps :  (1) Atomic ionization (by removal of a core electron)  (2) Electron emission (the Auger process)  (3) Analysis of the emitted Auger electrons
  • 3.
    1) Excitation ofthe atom causing emission of an electron 2) An electron drops down to fill the vacancy created in step 1 3) The energy released in step 2 causes the emission of an Auger electron. 4) Auger electron is emitted in step 3.
  • 5.
     The Augerprocess is initiated by creation of a core hole - this is typically carried out by exposing the sample to a beam of high energy electrons (typically having a primary energy in the range 2 - 10 keV). Such electrons have sufficient energy to ionise all levels of the lighter elements, and higher core levels of the heavier elements. i-ionization
  • 6.
    ii- Electron Emission  Theionized atom that remains after the removal of the core hole electron is, of course, in a highly excited state and will rapidly relax back to a lower energy state by one of two routes :  X-ray fluorescence  Auger emission
  • 7.
    iii- Emitted Auger Electron The energy of Auger electrons is usually between 20 and 2000 eV.  The depths from which Auger electrons are able to escape from the sample without losing too much energy are low, usually less than 50 angstroms.  Thus, Auger electrons collected by the AES come from the surface or just beneath the surface.  AES can only provide compositional information about the surface of the sample.
  • 8.
     Only atomsvery close to the surface of the specimen can emit the Auger electron.  The energy of the Auger electron is a characteristic of the element. Hence by determination of the energy of the Auger electron an idea about the composition of the specimen can be obtained.  8. Consider that the K Shell electron was emitted as a secondary electron and it was occupied by an L shell electron which in turn knocked out another L shell electron as Auger electron. This case would be represented by the notation KLL.
  • 9.
    Energy of theAuger electron  9. the energy of the Auger electron as detected by the detector can be obtained by the expression  Where is the Kinetic energy of the electron as detected by the detector. . is the energy of the electron in the K shell.  EL is the energy of an electron in the L Shell and is the work function of the detector.
  • 10.
    HOW IT WORKS? The sample is irradiated with electrons from an electron gun.  The emitted secondary electrons are analysed for energy by an electron spectrometer.  The experiment is carried out in a UHV (Ultra high vacuum) environment because the AES technique is surface sensitive due to the limited mean free path of electrons in the kinetic energy range of 20 to 2500 eV.
  • 11.
    Essential components ofan AES spectrometer  UHV environment  Electron gun  Electron energy analyser  Electron detector  Data recording, processing, and output system
  • 12.
    Auger spectrum ofa copper nitride film in derivative mode plotted as a function of energy. Different peaks for Cu and N are apparent with the N KLL transition highlighted.
  • 13.
     AES Spectrumfor Passivated Stainless Steel
  • 14.
     Fluorescence andAuger electron yields as a function of atomic number for K shell vacancies. Auger transitions (red curve) are more probable for lighter elements, while X-ray yield (dotted blue curve) becomes dominant at higher atomic numbers.
  • 15.
    Auger depth profile For analysis beyond the top 1-5nm an inert gas ion gun (normally Argon) can be used to sputter off the surface layers.  Alternating sputtering and AES spectral acquisition permits chemical depth profiles to be obtained down to depths of about 1μm into the bulk.  Sputter depth profiling reveals chemical depth information.
  • 17.
     To obtaininformation about the variation of composition with depth below the surface of a sample, it is necessary to gradually remove material from the surface region , whilst continuing to monitor and record the Auger spectra. Process of Auger Depth profiling
  • 18.
    For Example:  supposethere is a buried layer of a different composition several nanometres below the sample surface.  As the ion beam etches away material from the surface, the Auger signals corresponding to the elements present in this layer will rise and then decrease again.  The diagram shows the variation of the Auger signal intensity one might expect from such a system for an element that is only present in the buried layer and not in the rest of the solid.  By collecting Auger spectra as the sample is simultaneously subjected to etching by ion bombardment, it is possible to obtain information on the variation of composition with depth below the surface.  This technique is known by the name of Auger Depth Profiling. Depth resolution of < 100 Å is possible.
  • 19.
  • 21.
    scanning Auger microscopes (SAM) (SAM) and can produce high resolution, spatially resolved chemical images.  SAM images are obtained by stepping a focused electron beam across a sample surface and measuring the intensity of the Auger peak above the background of scattered electrons.  (SEM) is used to facilitate location of selected analysis areas, and micrographs of the sample surface can be obtained.  The sample chamber is maintained at ultrahigh vacuum to minimize interception of the Auger electrons by gas molecules between the sample and the detector.  A computer is used for acquisition, analysis, and display of the AES data.
  • 22.
    Typical Applications AES •Surface Oxide thickness in semiconductor processes - depth profiling  •Sputtered layer process chemical characterisation and depth profiling  •Wet chemical pitting corrosion studies  •Analysis of evaporated or deposited layers  •Metal component thermal oxidation or reduction process effectiveness (growth or removal of oxide or surface segregating materials)  •Stainless steel laser welding difficulties solved by Auger depth profiling  •Characterisation of surface in homogeneities.  •Improvement of chemical cleaning or etching processes and analysis of drying stains.