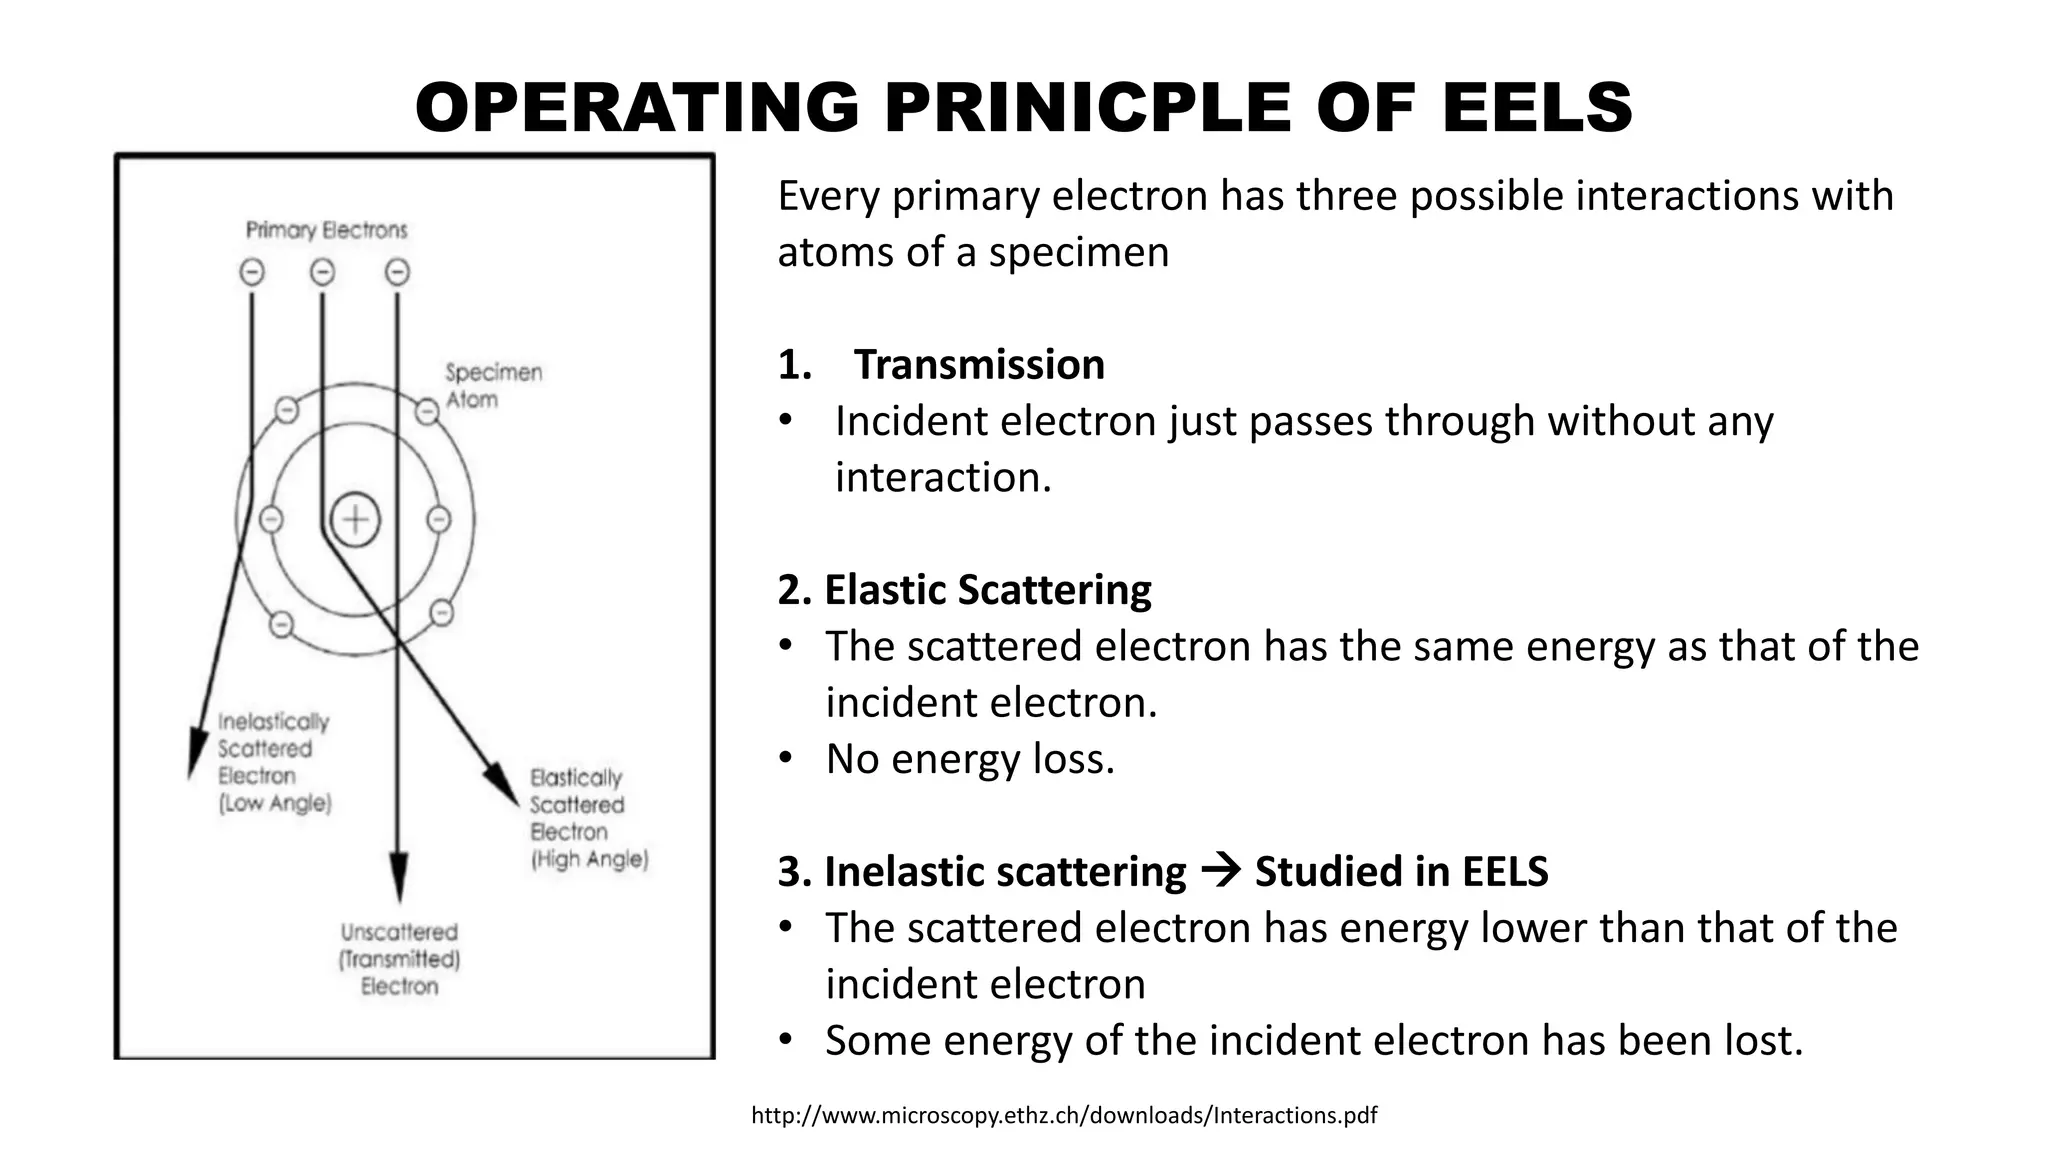
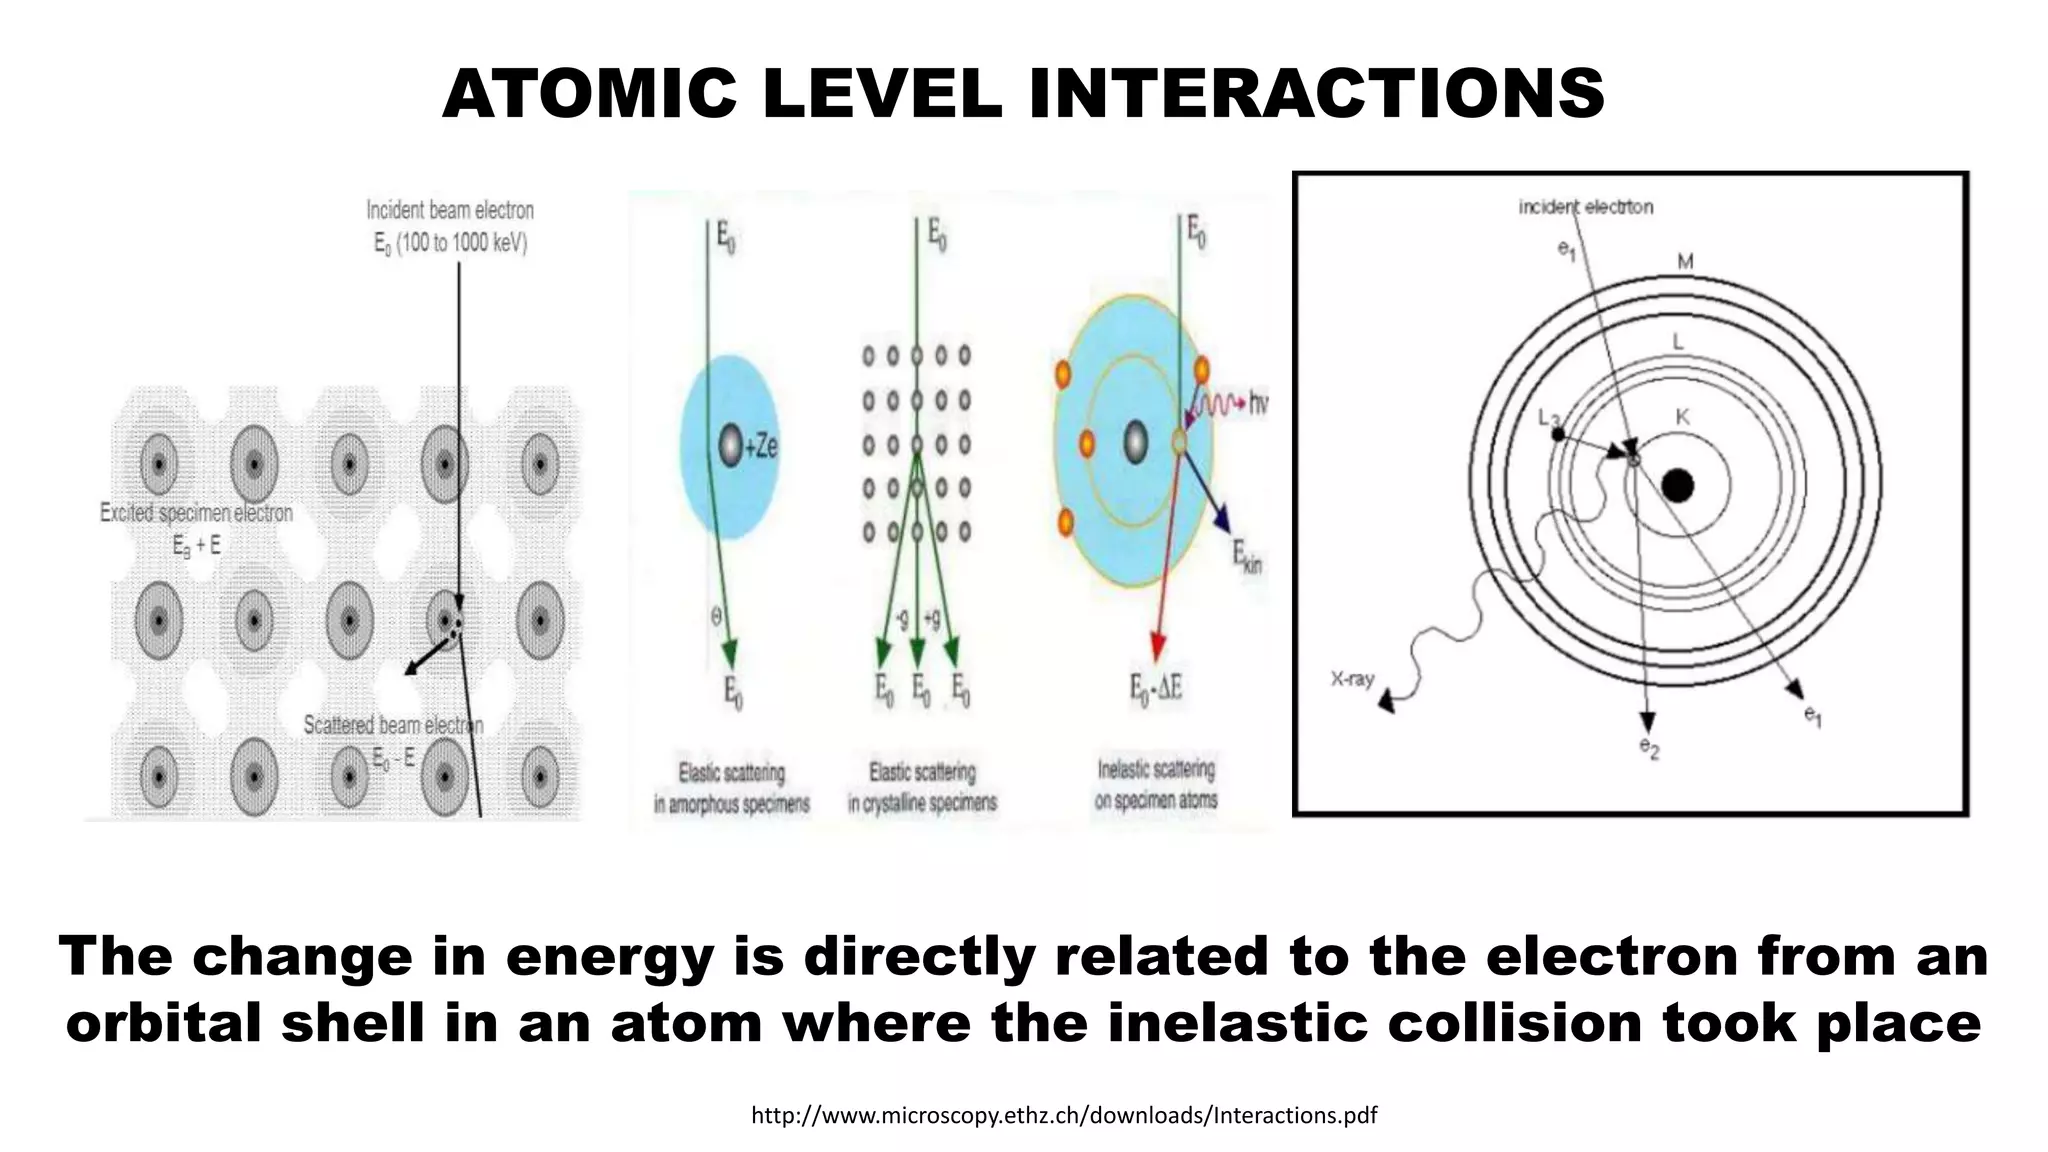
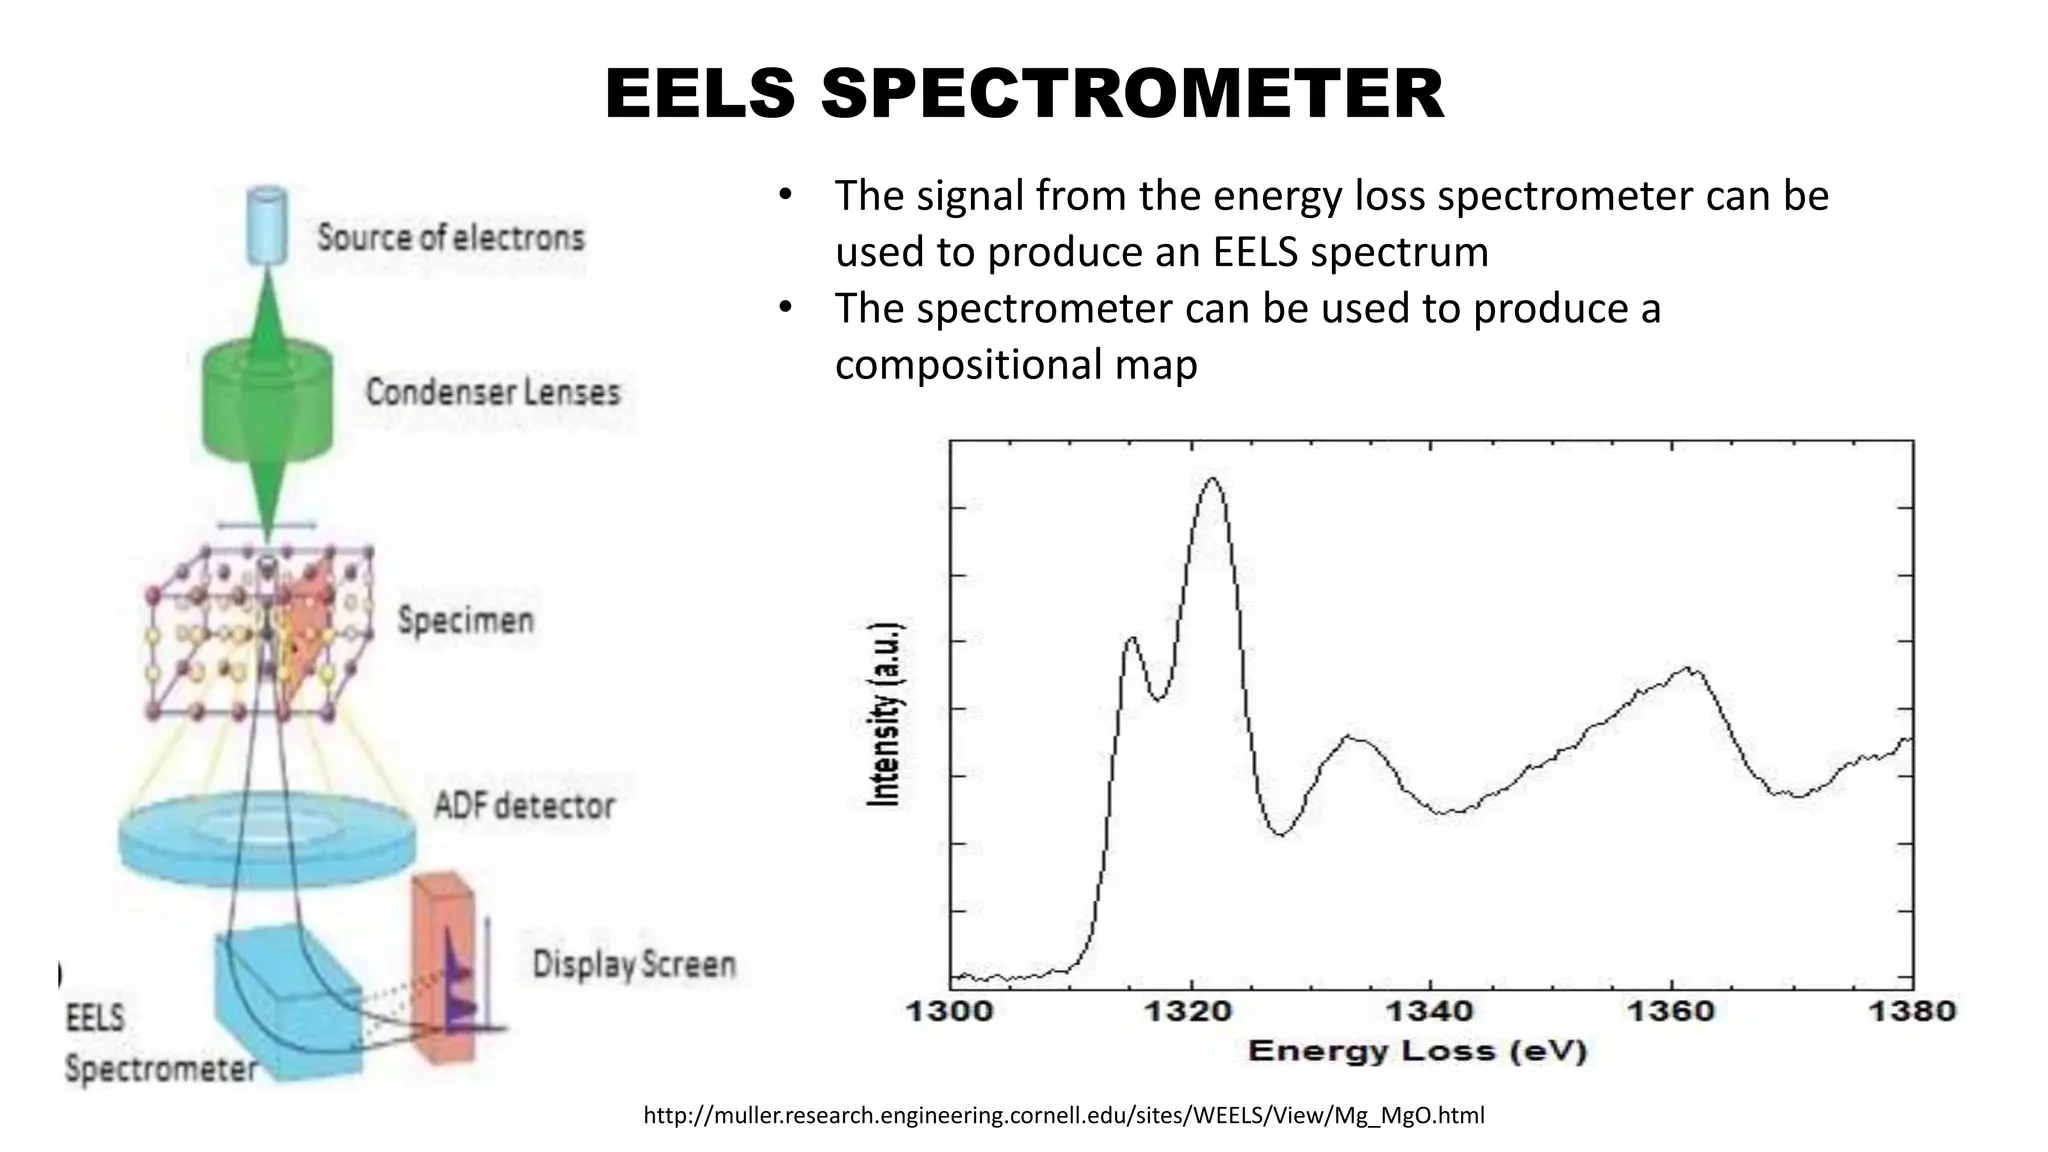
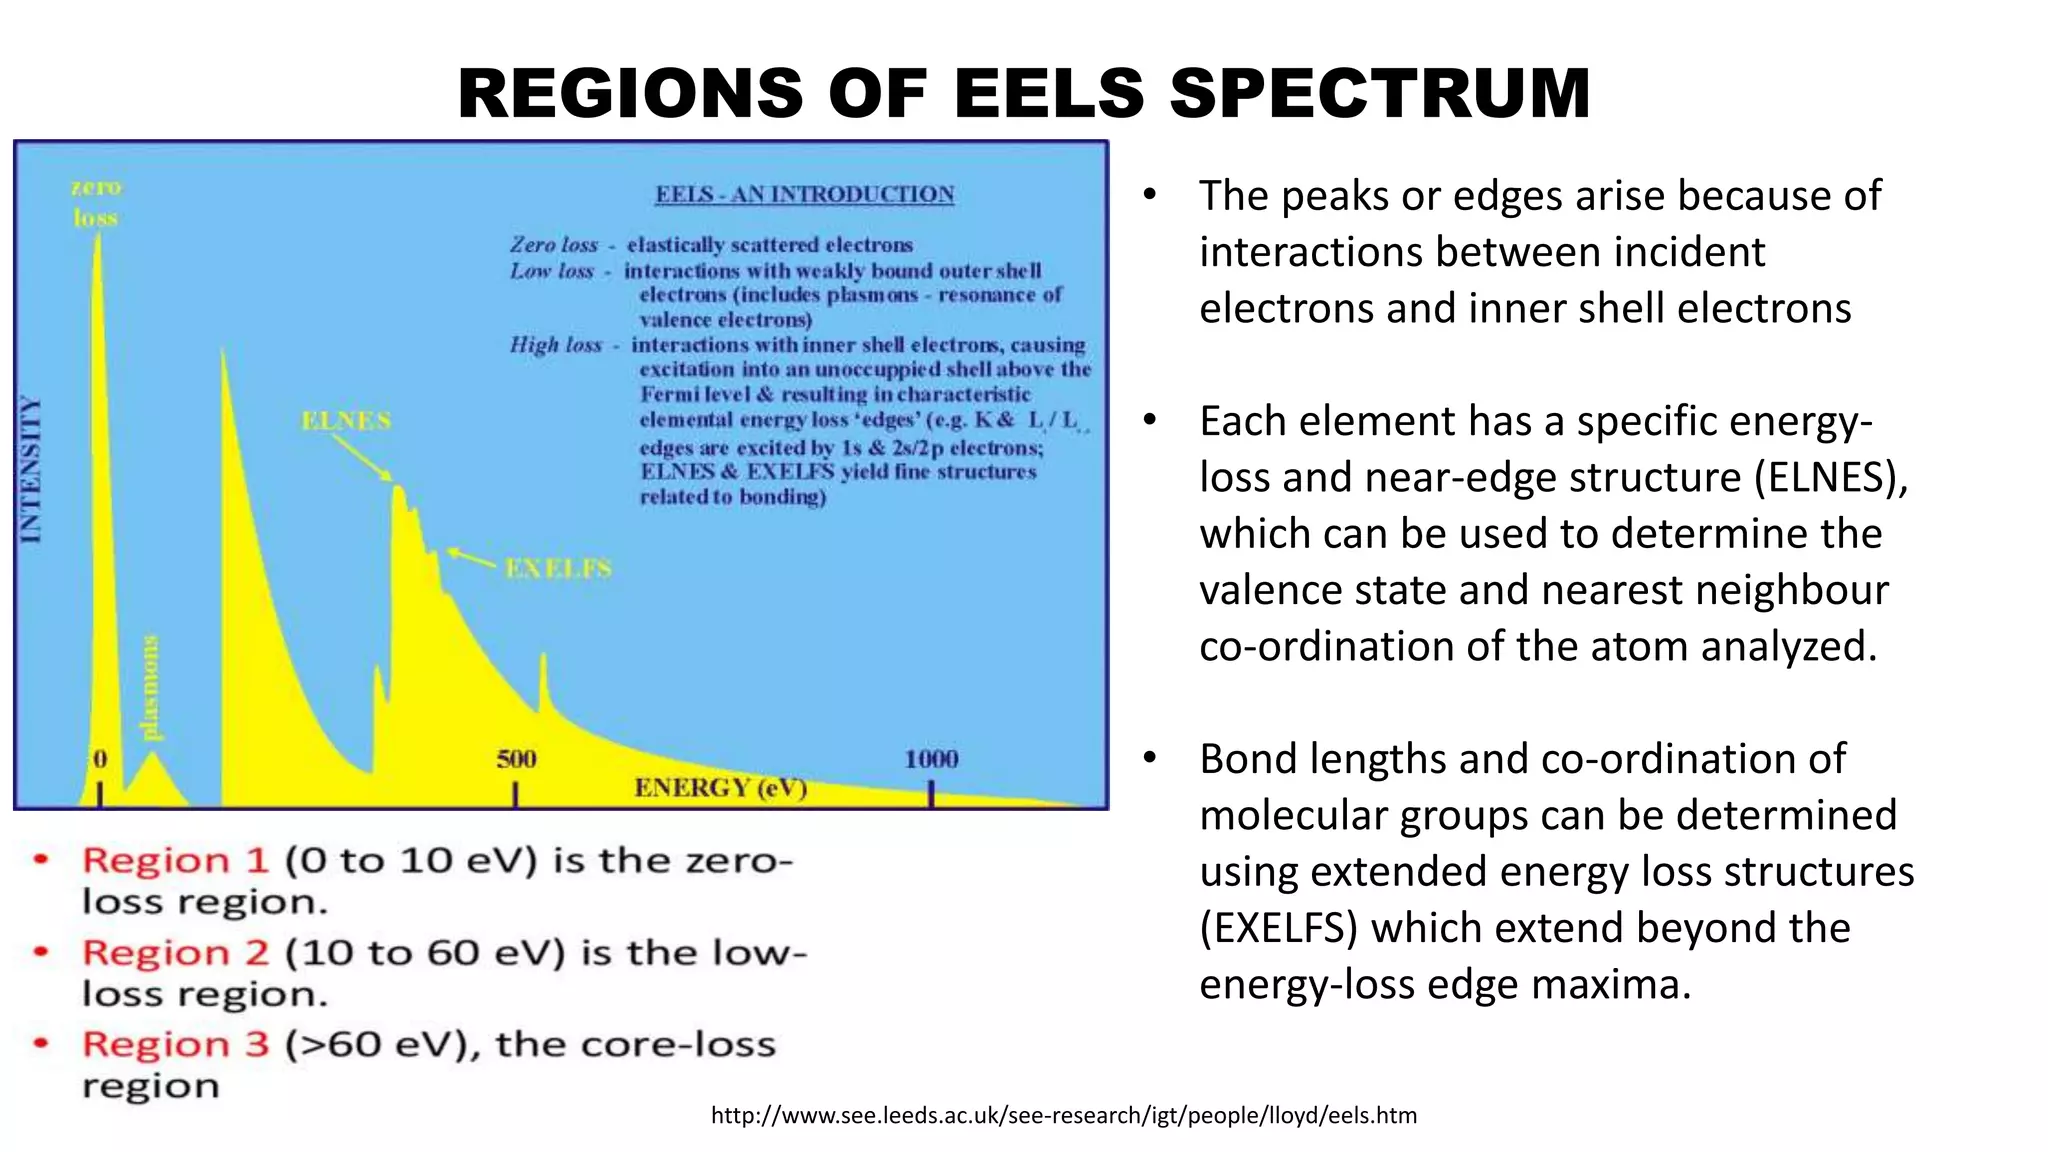
ELECTRON ENERGY LOSS
SPECTROSCOPY (EELS)
NUZHET NIHAAR NASIR AHAMED
February, 2017.
TOPICS TO BE COVERED
1. EELS TECHNIQUE
2. OPERATING PRINCIPLES
3. UNDERSTANDING EELS SPECTRUM
4. PARAMETERS MEASURED BY EELS TECHNIQUE
5. EELS IN INDUSTRIES AND RESEARCH
6. COST
WHAT IS EELS?
• One of the versatile techniques
which studies the energy loss of
inelastically scattered electrons.
• Measures change in kinetic
energy of the electrons after they
interact with the specimen
• Energy required to remove an
electron
E=-13.6 Z2eV/n2
EELS measures the energy lost by an electron
beam passing through a specimen
http://www.gatan.com/techniques/eels#
Types of specimen and electron beam interactions
OPERATING PRINICPLE OF EELS
Every primary electron has three possible interactions with
atoms of a specimen
1. Transmission
• Incident electron just passes through without any
interaction.
2. Elastic Scattering
• The scattered electron has the same energy as that of the
incident electron.
• No energy loss.
3. Inelastic scattering  Studied in EELS
• The scattered electron has energy lower than that of the
incident electron
• Some energy of the incident electron has been lost.
http://www.microscopy.ethz.ch/downloads/Interactions.pdf
ATOMIC LEVEL INTERACTIONS
http://www.microscopy.ethz.ch/downloads/Interactions.pdf
The change in energy is directly related to the electron from an
orbital shell in an atom where the inelastic collision took place
EELS SPECTROMETER
• The signal from the energy loss spectrometer can be
used to produce an EELS spectrum
• The spectrometer can be used to produce a
compositional map
http://muller.research.engineering.cornell.edu/sites/WEELS/View/Mg_MgO.html
REGIONS OF EELS SPECTRUM
• The peaks or edges arise because of
interactions between incident
electrons and inner shell electrons
• Each element has a specific energy-
loss and near-edge structure (ELNES),
which can be used to determine the
valence state and nearest neighbour
co-ordination of the atom analyzed.
• Bond lengths and co-ordination of
molecular groups can be determined
using extended energy loss structures
(EXELFS) which extend beyond the
energy-loss edge maxima.
http://www.see.leeds.ac.uk/see-research/igt/people/lloyd/eels.htm
EXAMPLES OF OBSERVED EELS SPECTRA
EELS spectra for sulphide and sulphate minerals
• The S L2,3 edge of sulphides starts at
164eV
• For sulphates it starts at ~170eV
• Higher energy peaks (e.g. A, B, B') occur
in both Fe and Zn sulphides
• The peaks A, B, C in the sulphate
spectrum can be assigned to unoccupied
molecular orbitals
• Subtle differences in peaks can be related
to crystal structure
http://www.see.leeds.ac.uk/see-research/igt/people/lloyd/eels.htm
QUANTIFICATION OF ATOMIC SPECIES
• Fe valency variations revealed by L2,3 edges for
pyrite (FeS2) and magnetite (Fe3O4)
• The former contains only Fe2+ and exhibits a simple
initial peak
• The latter contains both Fe2+ and Fe3+ and the
initial peak shows a minor splitting
• The energy difference between the two 'splits' is
1.3eV
• Thus distinguishes the Fe valencies.
http://www.see.leeds.ac.uk/see-research/igt/people/lloyd/eels.htm
FIRST ELECTRON MICROANALYZER
https://www.microscopy.org/images/posters/Hillier.pdf
The spectrum shows the carbon and oxygen K-edges from a
collodian film.
The first energy-loss spectrometer operated as an electron
microscope
EELS IN INDUSTRIES AND RESEARCH
http://www.tagen.tohoku.ac.jp/labo/terauchi/research/hrea/hrea.html
Schematic picture of ray pathHigh Resolution EELS microscope
EELS is used in
• Semiconductor
industries
• Forensic Science
• Nanomaterials
Engineering
• Nanometallurgy
• Crystallography
COST OF EELS EQUIPMENT
• Companies such as Zeiss, Jeol, Philips and Hitachi manufacture EELS equipment
• Extremely expensive
• $95,000 for a Jeol 1200EXII
• $95,000 for a Philips EM10
• $100,000 for a Hitachi 7000
http://www.microscopemaster.com/transmission-electron-microscope.html
EELS APPLICATION
• Colleges and universities can utilize EELS for research and studies
• Easy to operate with proper training
• Can be used in a different scientific, educational and industrial fields
REFERENCES
1. http://www.gatan.com/techniques/eels#
2. http://www.microscopy.ethz.ch/downloads/Interactions.pdf
3. http://muller.research.engineering.cornell.edu/sites/WEELS/View/Mg_MgO.ht
ml
4. http://www.see.leeds.ac.uk/see-research/igt/people/lloyd/eels.htm
5. https://www.microscopy.org/images/posters/Hillier.pdf
6. http://www.tagen.tohoku.ac.jp/labo/terauchi/research/hrea/hrea.html
7. http://www.microscopemaster.com/transmission-electron-microscope.html
THANK YOU FOR YOUR PATIENCE

Electron energy loss spectroscopy (eels)

  • 1.
    ELECTRON ENERGY LOSS SPECTROSCOPY(EELS) NUZHET NIHAAR NASIR AHAMED February, 2017.
  • 2.
    TOPICS TO BECOVERED 1. EELS TECHNIQUE 2. OPERATING PRINCIPLES 3. UNDERSTANDING EELS SPECTRUM 4. PARAMETERS MEASURED BY EELS TECHNIQUE 5. EELS IN INDUSTRIES AND RESEARCH 6. COST
  • 3.
    WHAT IS EELS? •One of the versatile techniques which studies the energy loss of inelastically scattered electrons. • Measures change in kinetic energy of the electrons after they interact with the specimen • Energy required to remove an electron E=-13.6 Z2eV/n2 EELS measures the energy lost by an electron beam passing through a specimen http://www.gatan.com/techniques/eels# Types of specimen and electron beam interactions
  • 4.
    OPERATING PRINICPLE OFEELS Every primary electron has three possible interactions with atoms of a specimen 1. Transmission • Incident electron just passes through without any interaction. 2. Elastic Scattering • The scattered electron has the same energy as that of the incident electron. • No energy loss. 3. Inelastic scattering  Studied in EELS • The scattered electron has energy lower than that of the incident electron • Some energy of the incident electron has been lost. http://www.microscopy.ethz.ch/downloads/Interactions.pdf
  • 5.
    ATOMIC LEVEL INTERACTIONS http://www.microscopy.ethz.ch/downloads/Interactions.pdf Thechange in energy is directly related to the electron from an orbital shell in an atom where the inelastic collision took place
  • 6.
    EELS SPECTROMETER • Thesignal from the energy loss spectrometer can be used to produce an EELS spectrum • The spectrometer can be used to produce a compositional map http://muller.research.engineering.cornell.edu/sites/WEELS/View/Mg_MgO.html
  • 7.
    REGIONS OF EELSSPECTRUM • The peaks or edges arise because of interactions between incident electrons and inner shell electrons • Each element has a specific energy- loss and near-edge structure (ELNES), which can be used to determine the valence state and nearest neighbour co-ordination of the atom analyzed. • Bond lengths and co-ordination of molecular groups can be determined using extended energy loss structures (EXELFS) which extend beyond the energy-loss edge maxima. http://www.see.leeds.ac.uk/see-research/igt/people/lloyd/eels.htm
  • 8.
    EXAMPLES OF OBSERVEDEELS SPECTRA EELS spectra for sulphide and sulphate minerals • The S L2,3 edge of sulphides starts at 164eV • For sulphates it starts at ~170eV • Higher energy peaks (e.g. A, B, B') occur in both Fe and Zn sulphides • The peaks A, B, C in the sulphate spectrum can be assigned to unoccupied molecular orbitals • Subtle differences in peaks can be related to crystal structure http://www.see.leeds.ac.uk/see-research/igt/people/lloyd/eels.htm
  • 9.
    QUANTIFICATION OF ATOMICSPECIES • Fe valency variations revealed by L2,3 edges for pyrite (FeS2) and magnetite (Fe3O4) • The former contains only Fe2+ and exhibits a simple initial peak • The latter contains both Fe2+ and Fe3+ and the initial peak shows a minor splitting • The energy difference between the two 'splits' is 1.3eV • Thus distinguishes the Fe valencies. http://www.see.leeds.ac.uk/see-research/igt/people/lloyd/eels.htm
  • 10.
    FIRST ELECTRON MICROANALYZER https://www.microscopy.org/images/posters/Hillier.pdf Thespectrum shows the carbon and oxygen K-edges from a collodian film. The first energy-loss spectrometer operated as an electron microscope
  • 11.
    EELS IN INDUSTRIESAND RESEARCH http://www.tagen.tohoku.ac.jp/labo/terauchi/research/hrea/hrea.html Schematic picture of ray pathHigh Resolution EELS microscope EELS is used in • Semiconductor industries • Forensic Science • Nanomaterials Engineering • Nanometallurgy • Crystallography
  • 12.
    COST OF EELSEQUIPMENT • Companies such as Zeiss, Jeol, Philips and Hitachi manufacture EELS equipment • Extremely expensive • $95,000 for a Jeol 1200EXII • $95,000 for a Philips EM10 • $100,000 for a Hitachi 7000 http://www.microscopemaster.com/transmission-electron-microscope.html EELS APPLICATION • Colleges and universities can utilize EELS for research and studies • Easy to operate with proper training • Can be used in a different scientific, educational and industrial fields
  • 13.
    REFERENCES 1. http://www.gatan.com/techniques/eels# 2. http://www.microscopy.ethz.ch/downloads/Interactions.pdf 3.http://muller.research.engineering.cornell.edu/sites/WEELS/View/Mg_MgO.ht ml 4. http://www.see.leeds.ac.uk/see-research/igt/people/lloyd/eels.htm 5. https://www.microscopy.org/images/posters/Hillier.pdf 6. http://www.tagen.tohoku.ac.jp/labo/terauchi/research/hrea/hrea.html 7. http://www.microscopemaster.com/transmission-electron-microscope.html
  • 14.
    THANK YOU FORYOUR PATIENCE