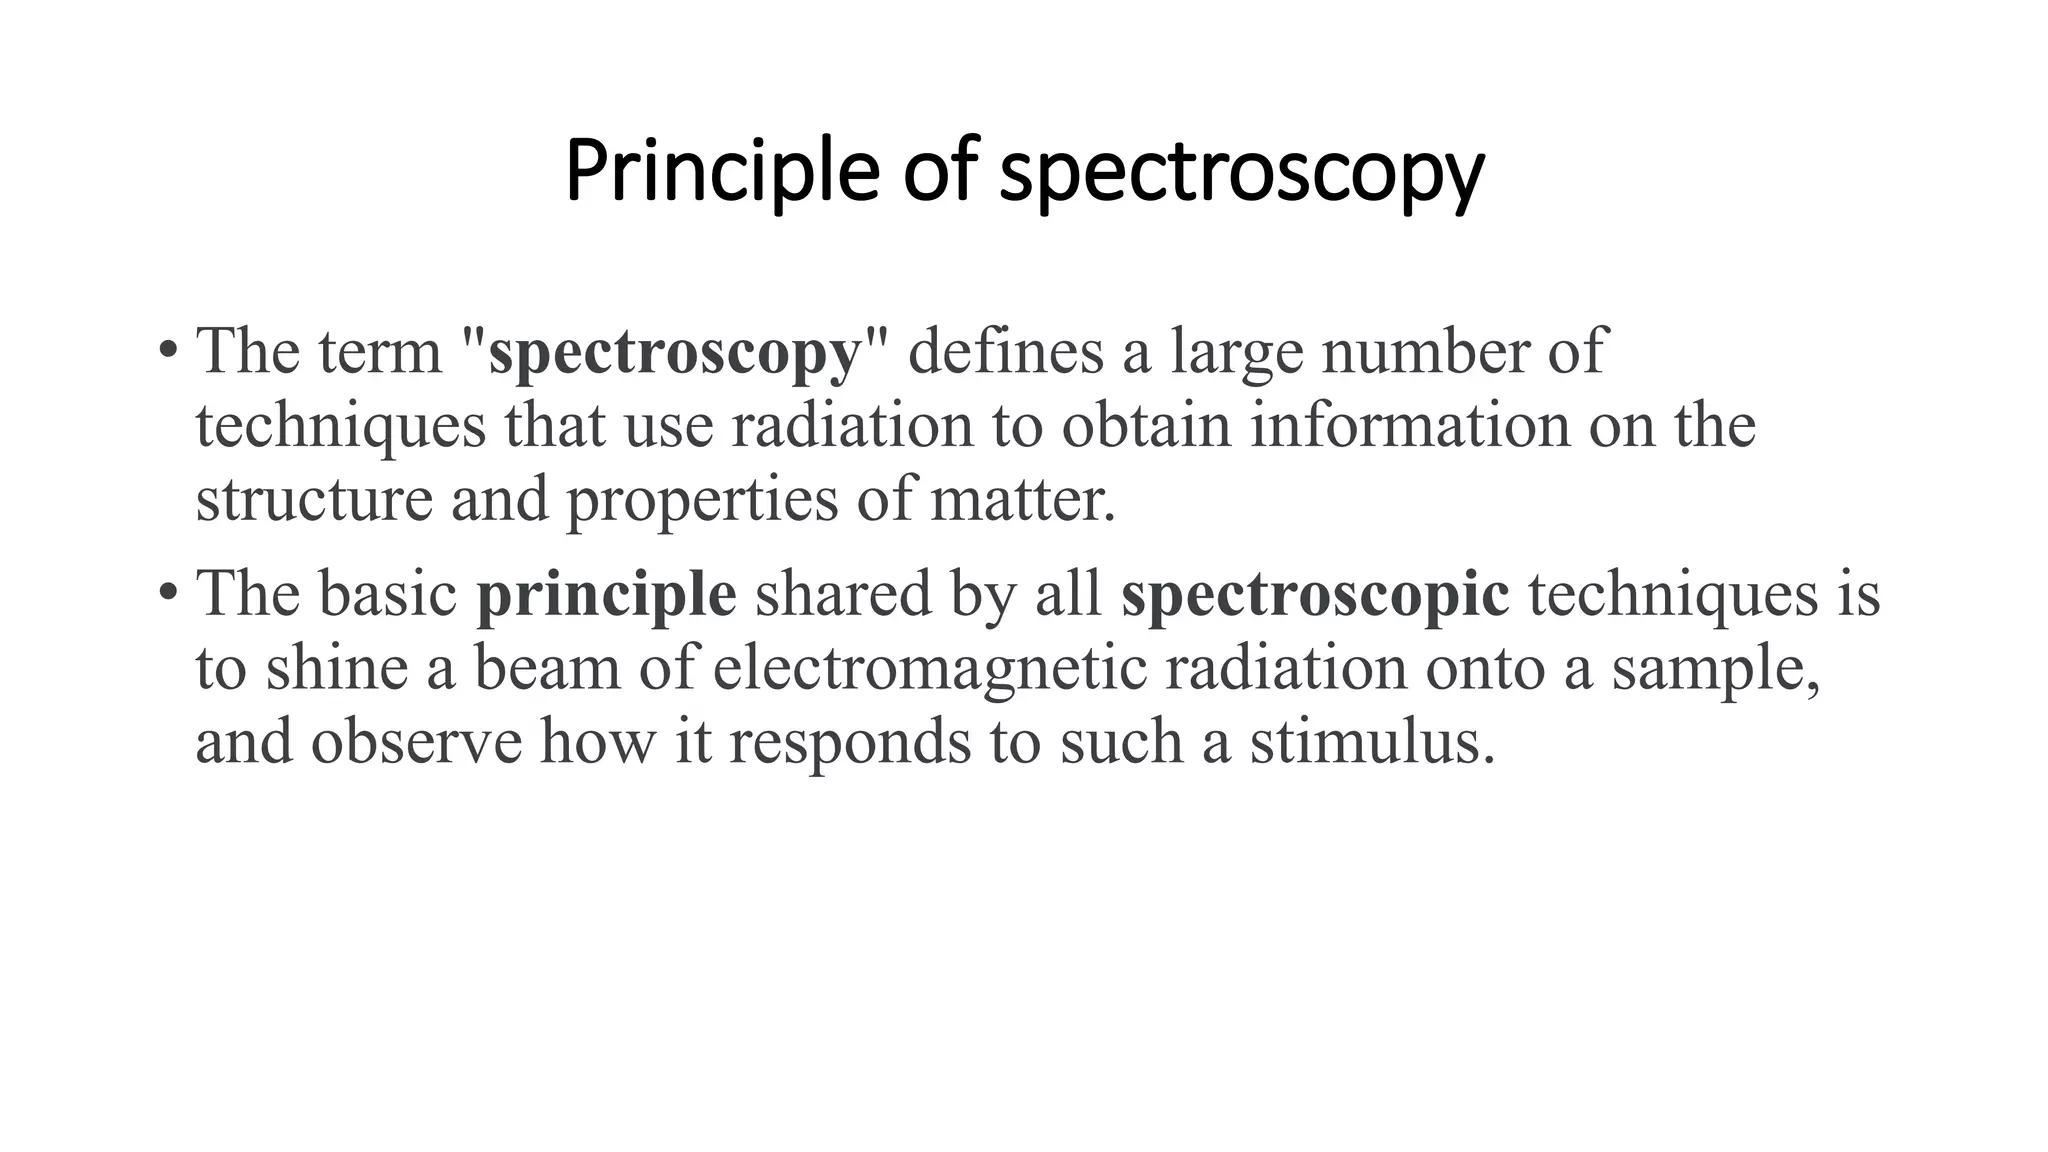
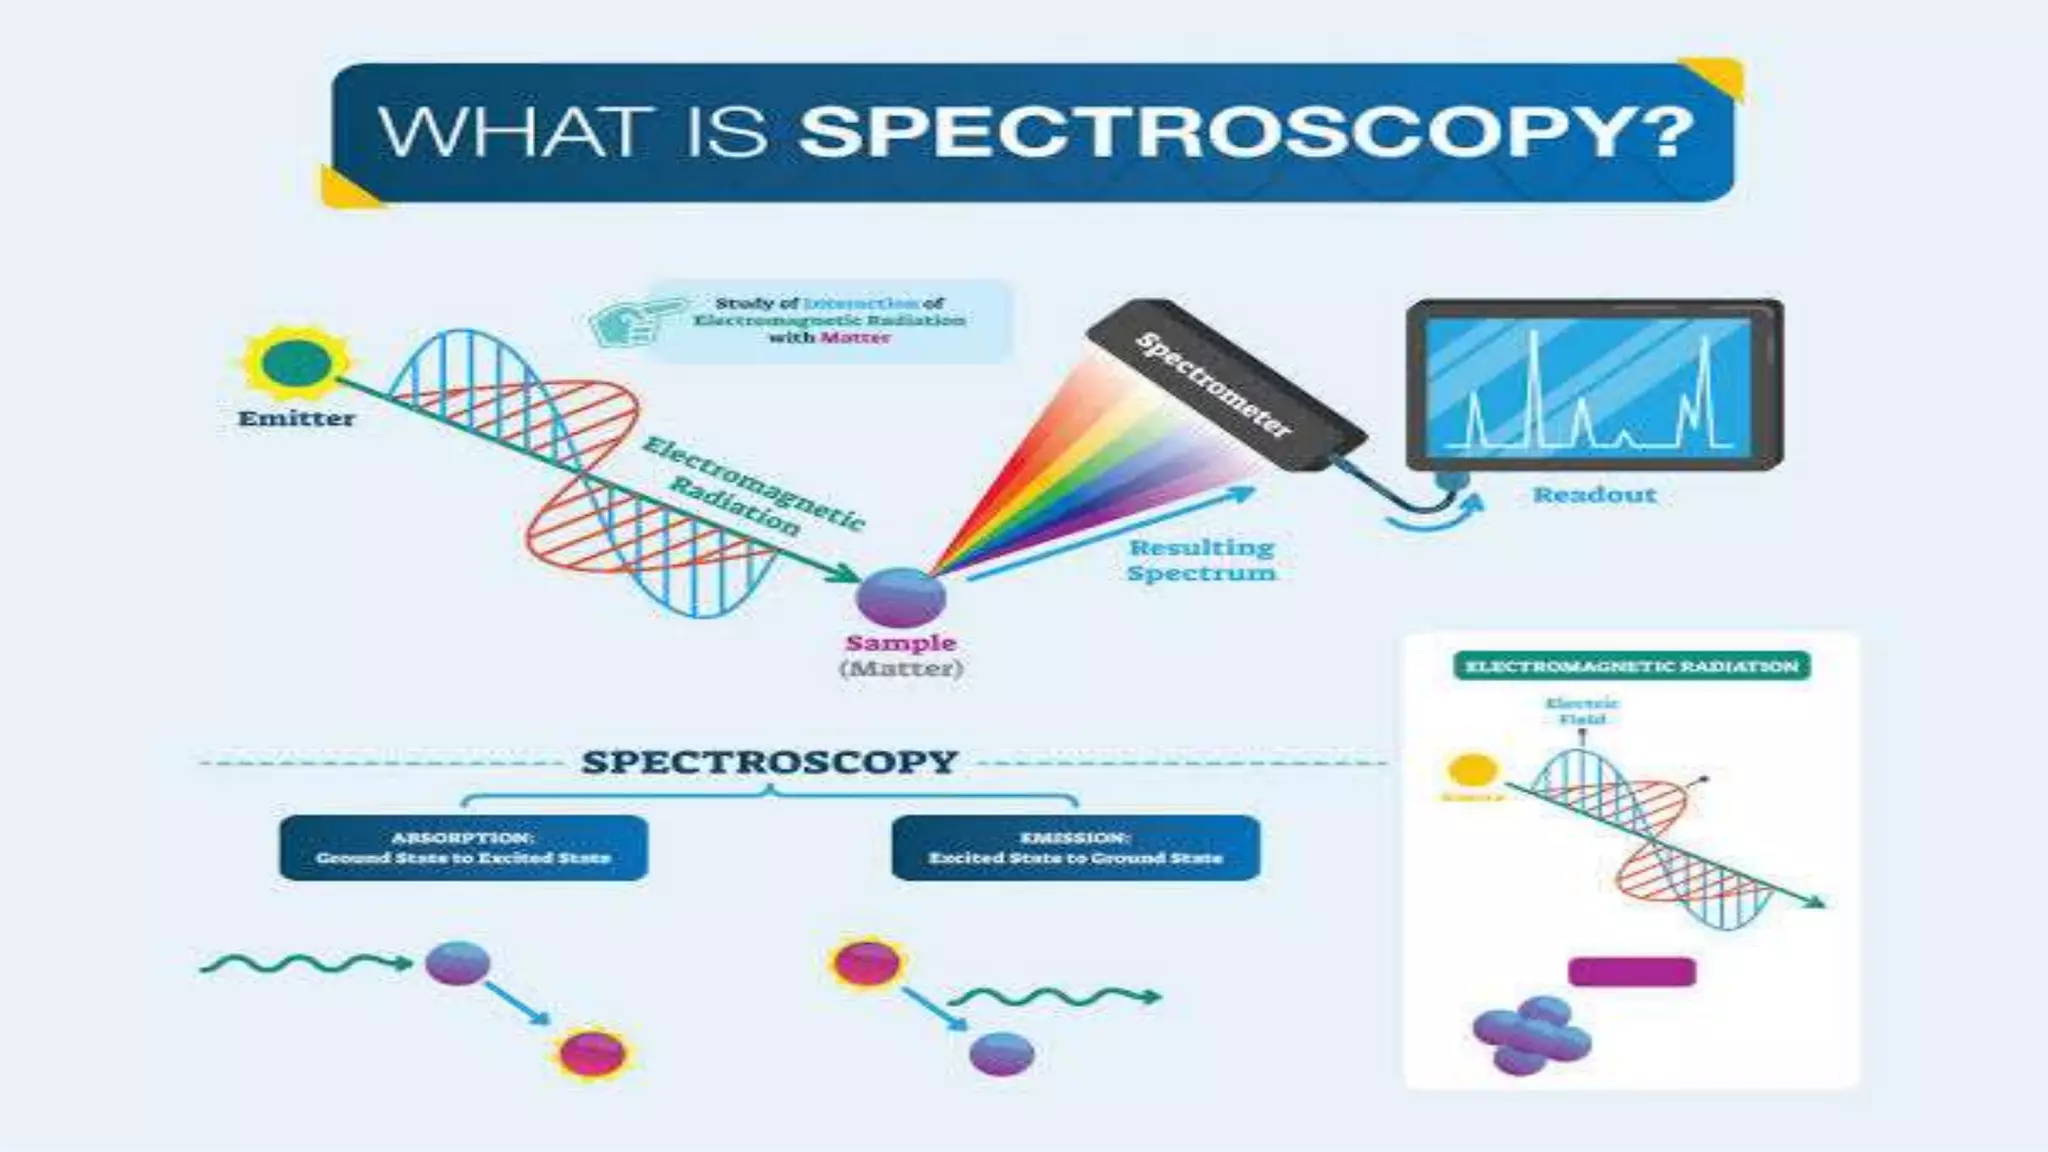
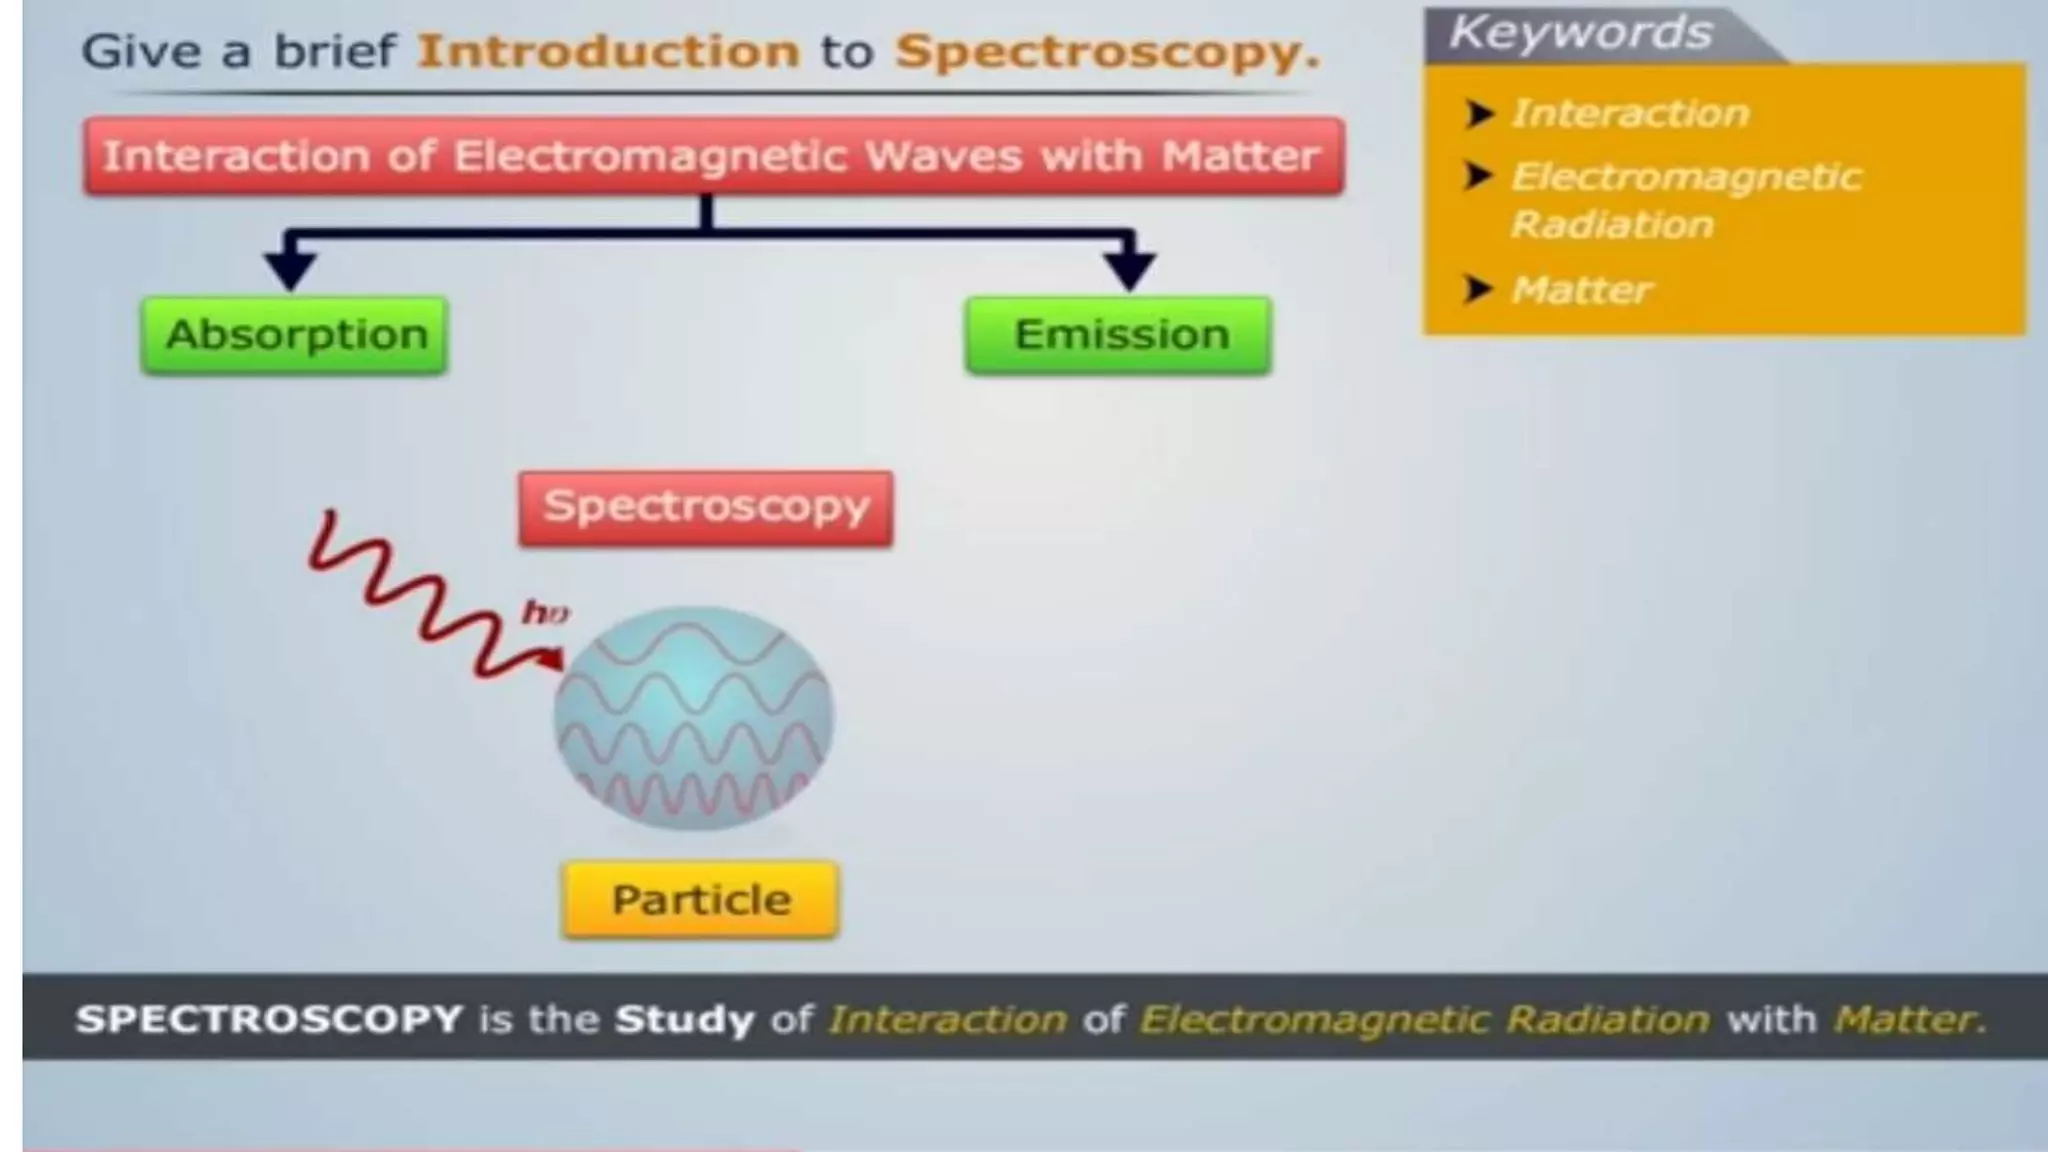
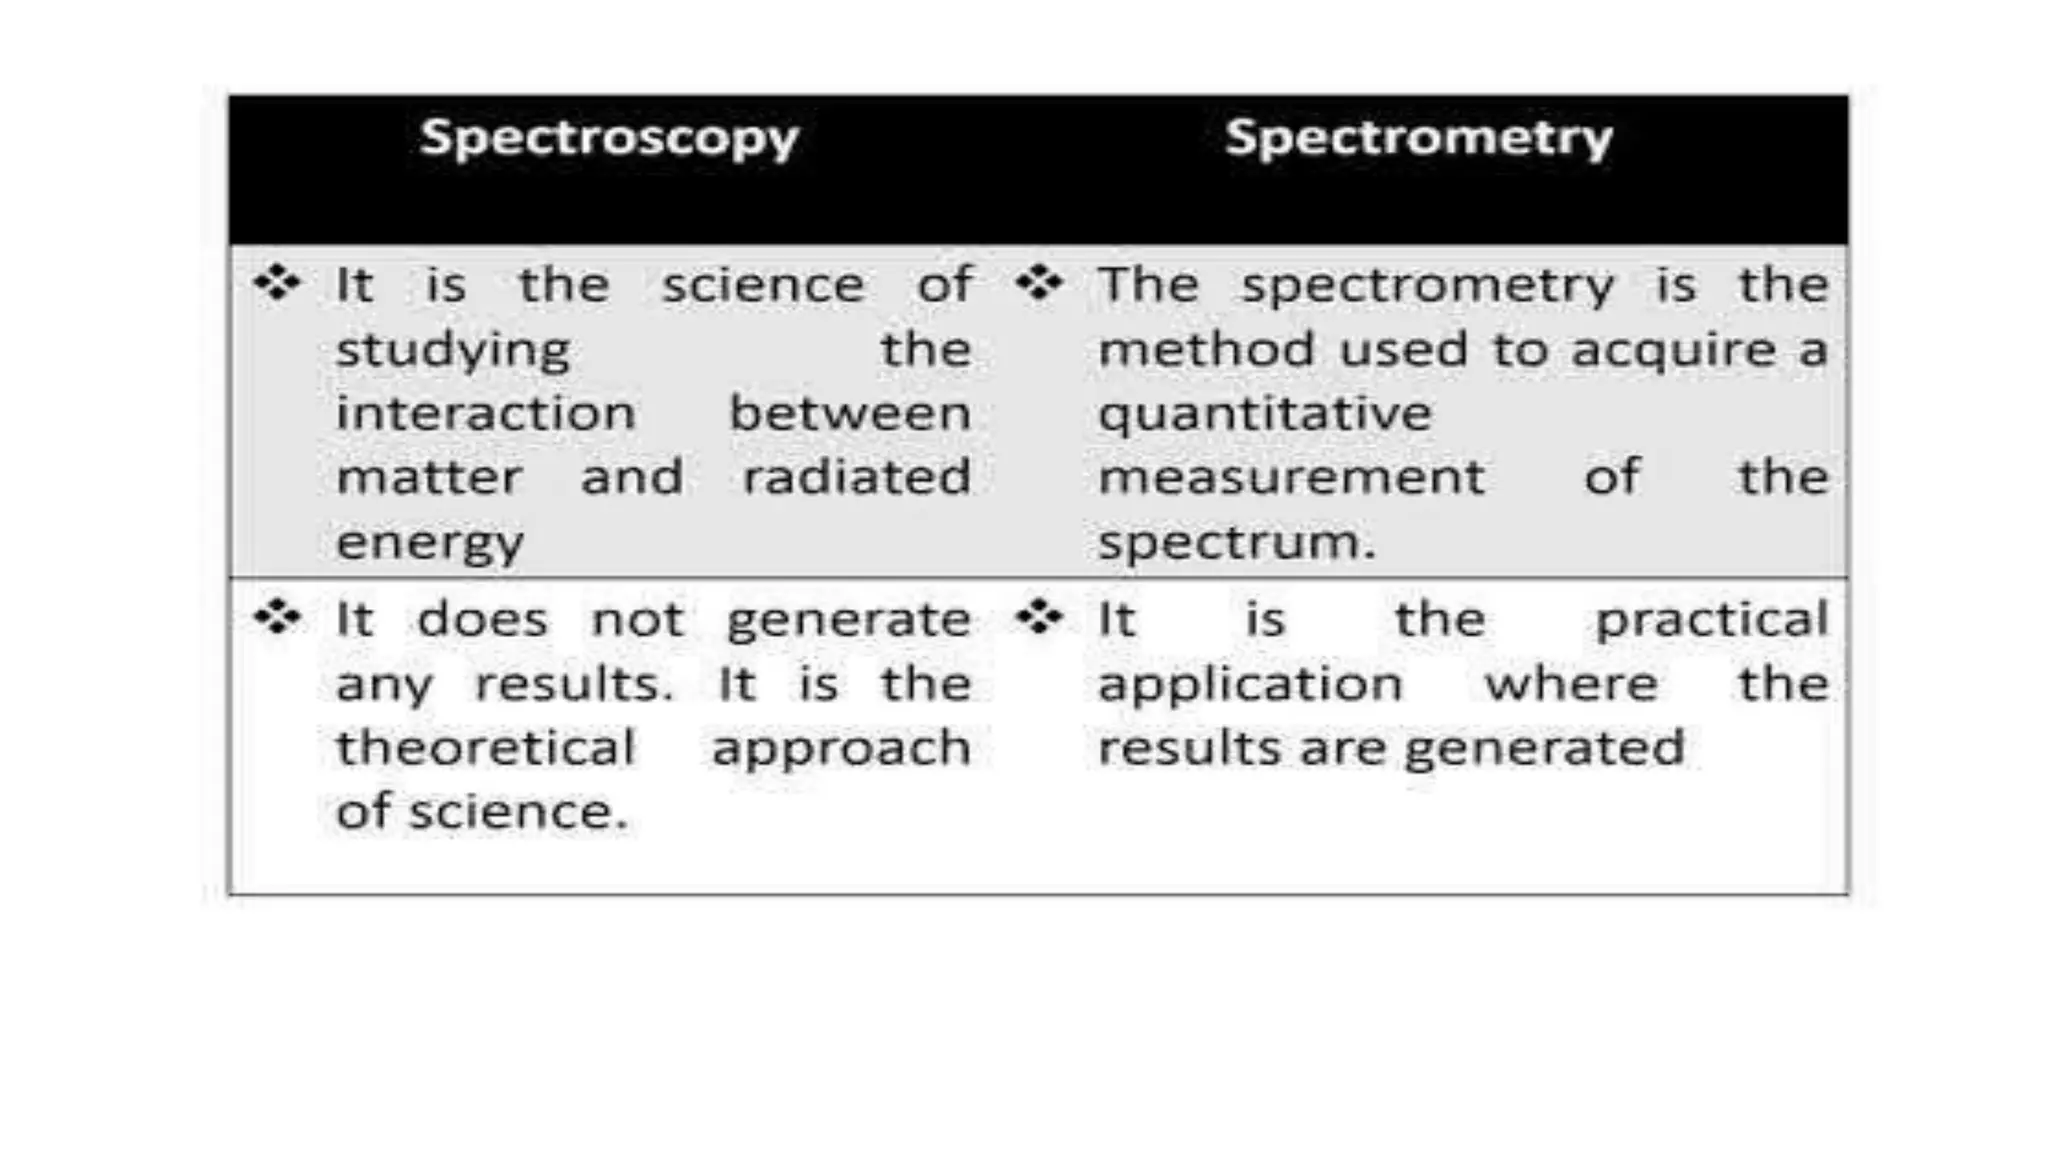
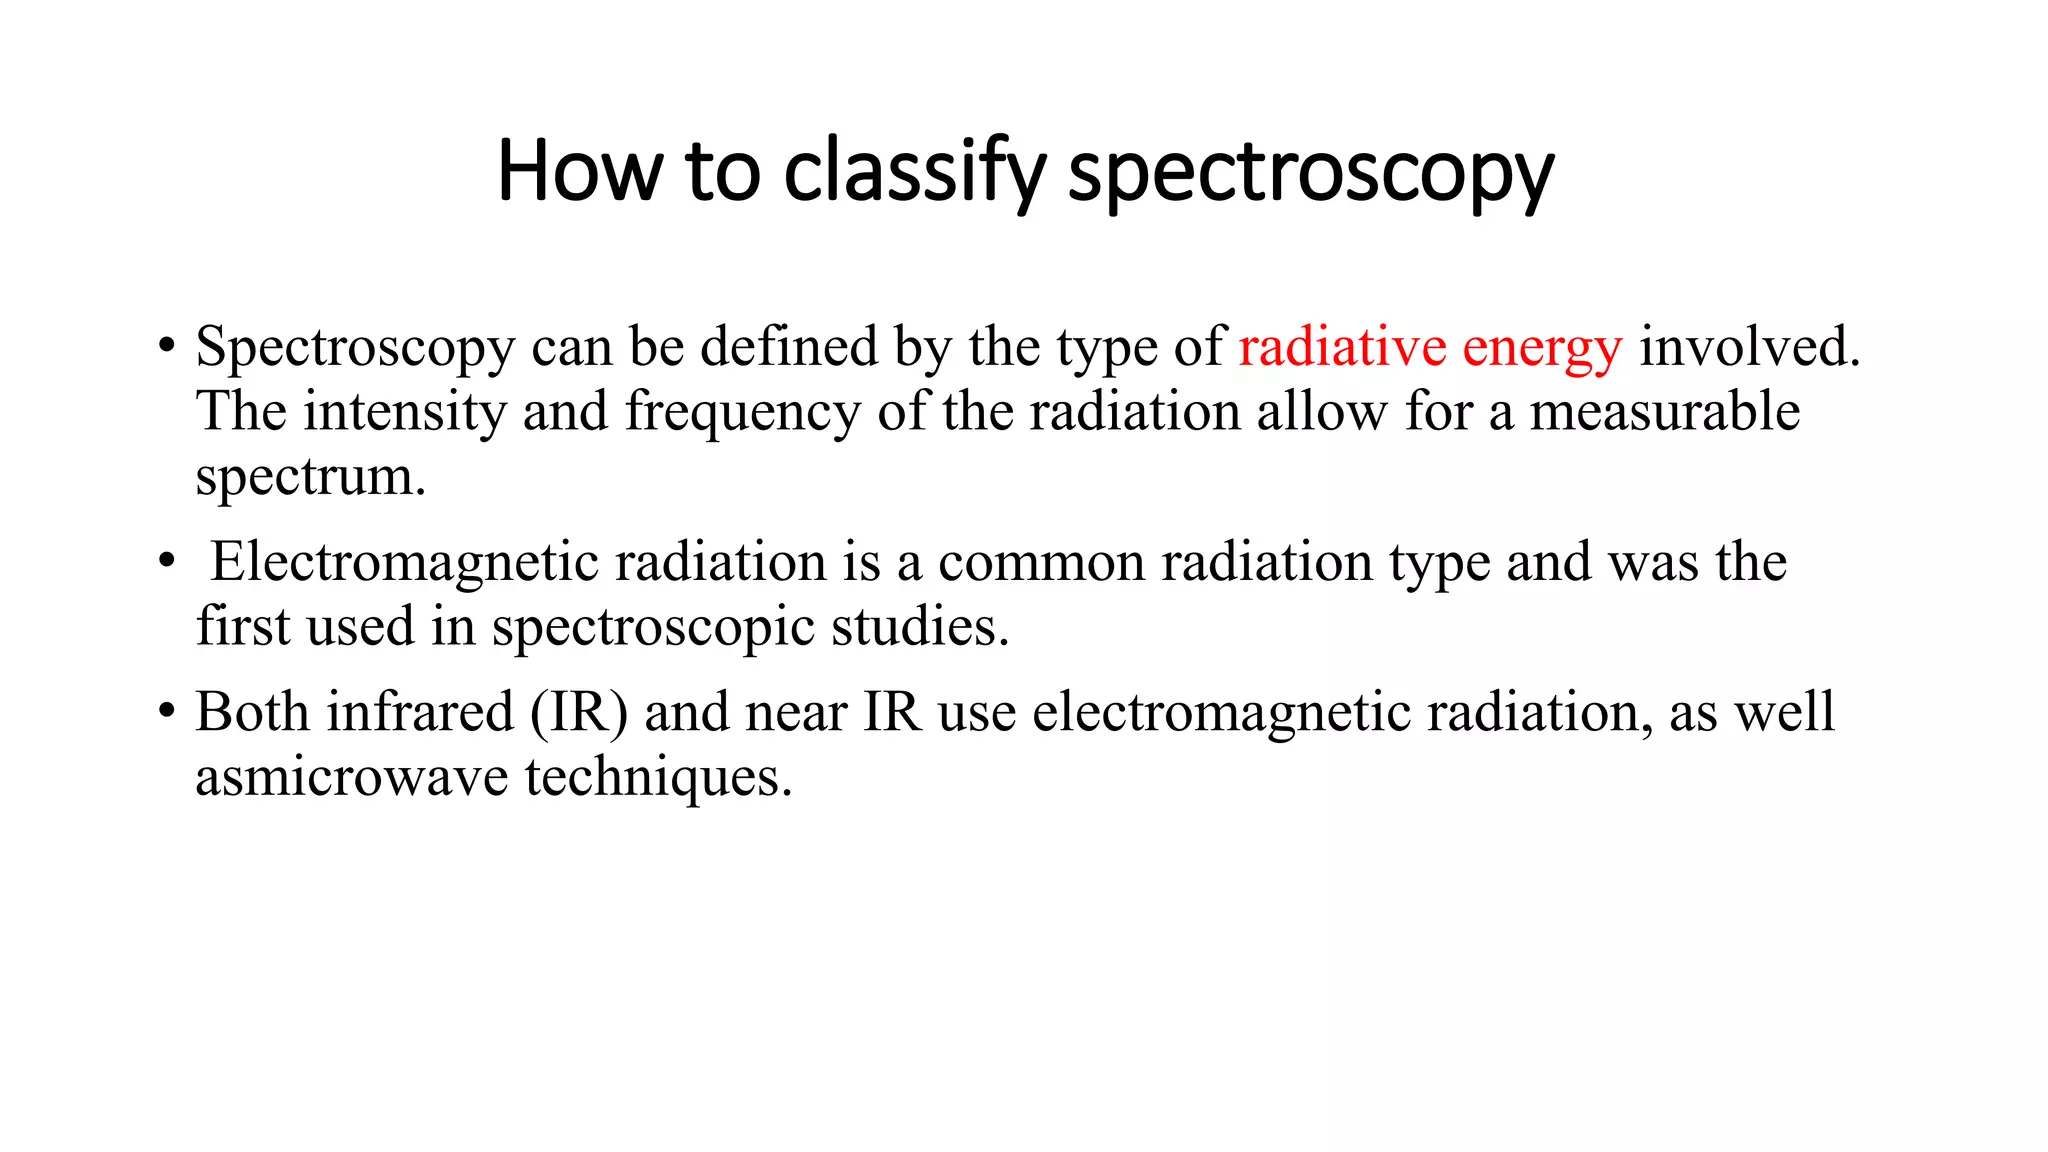
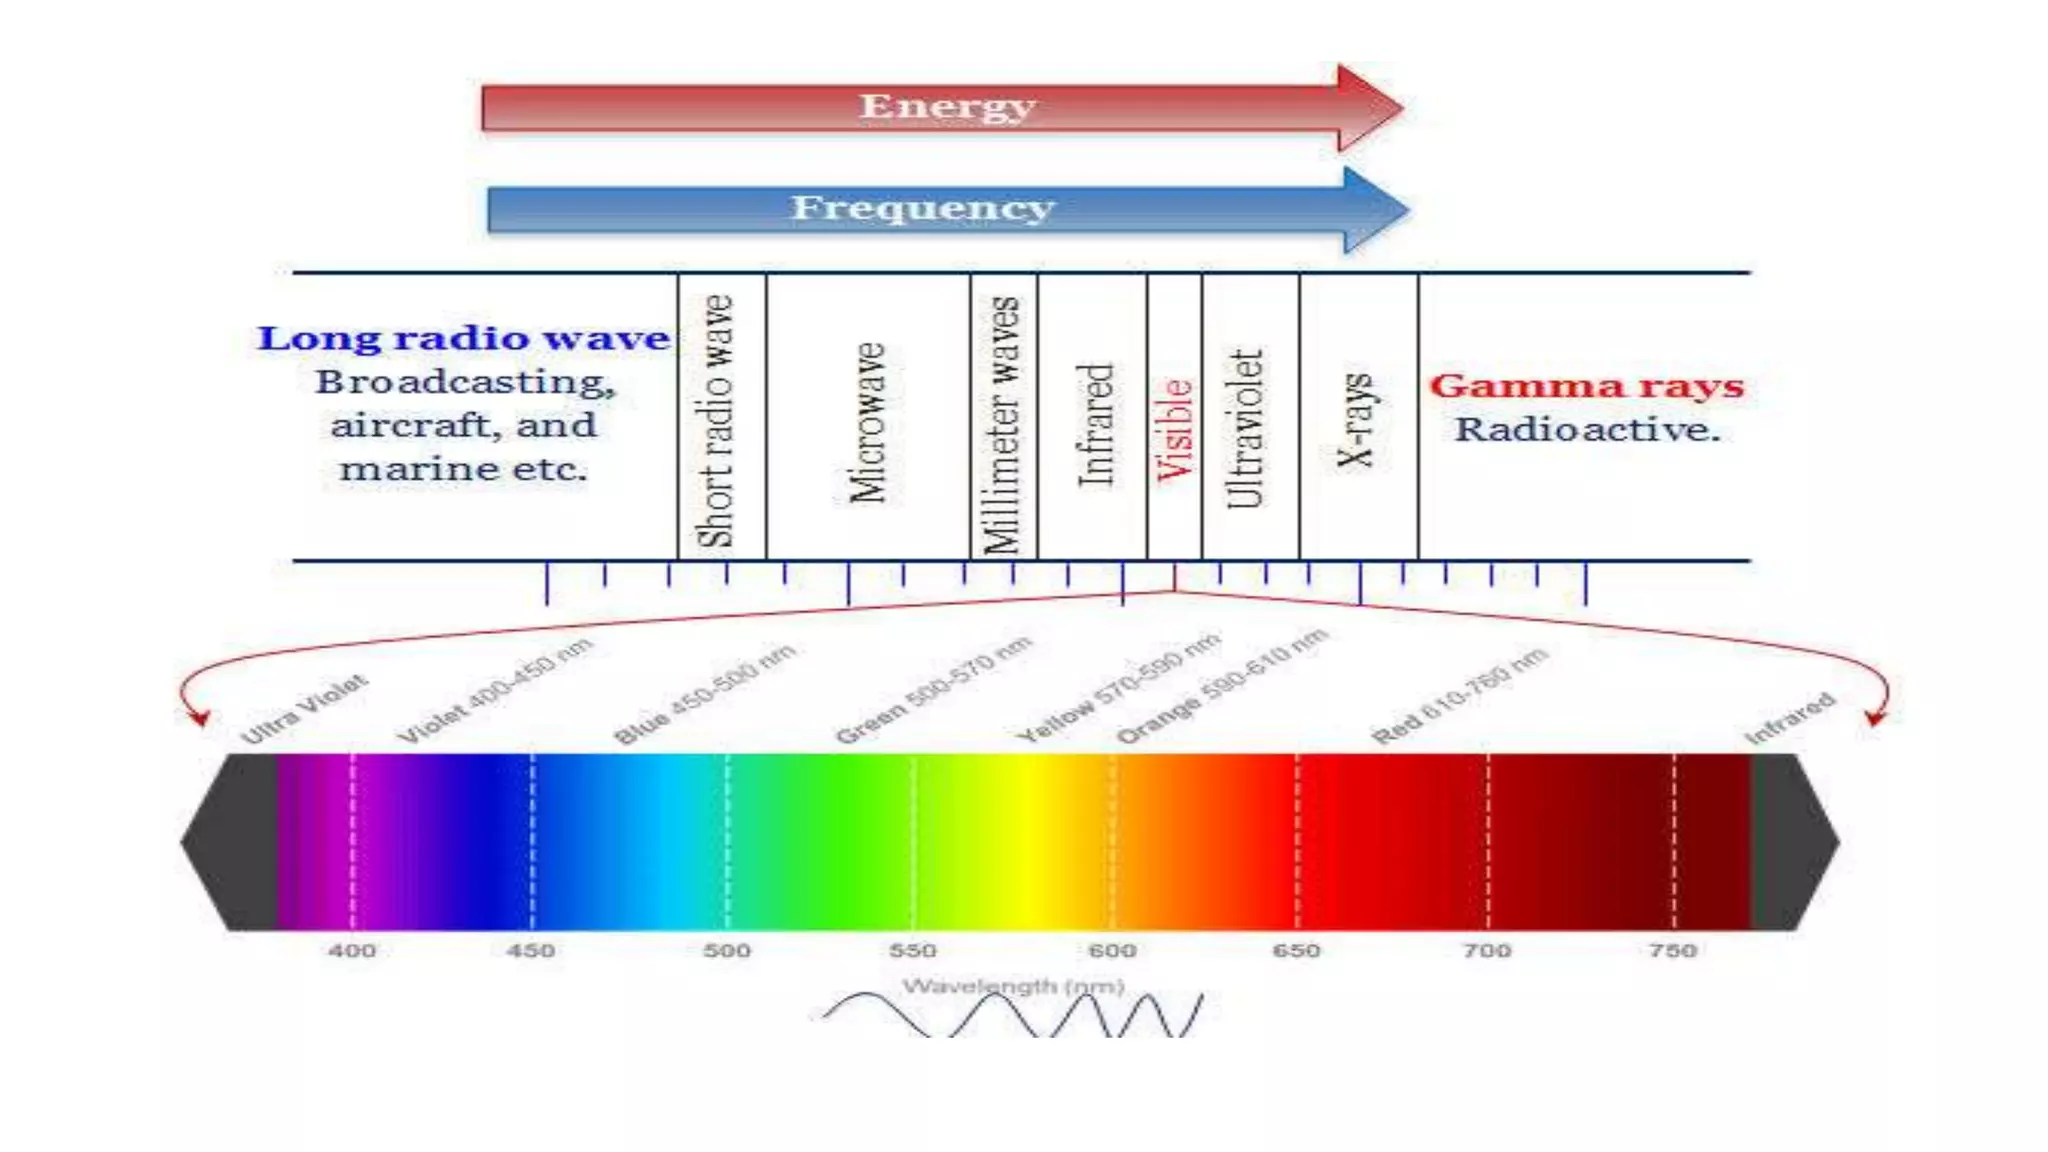
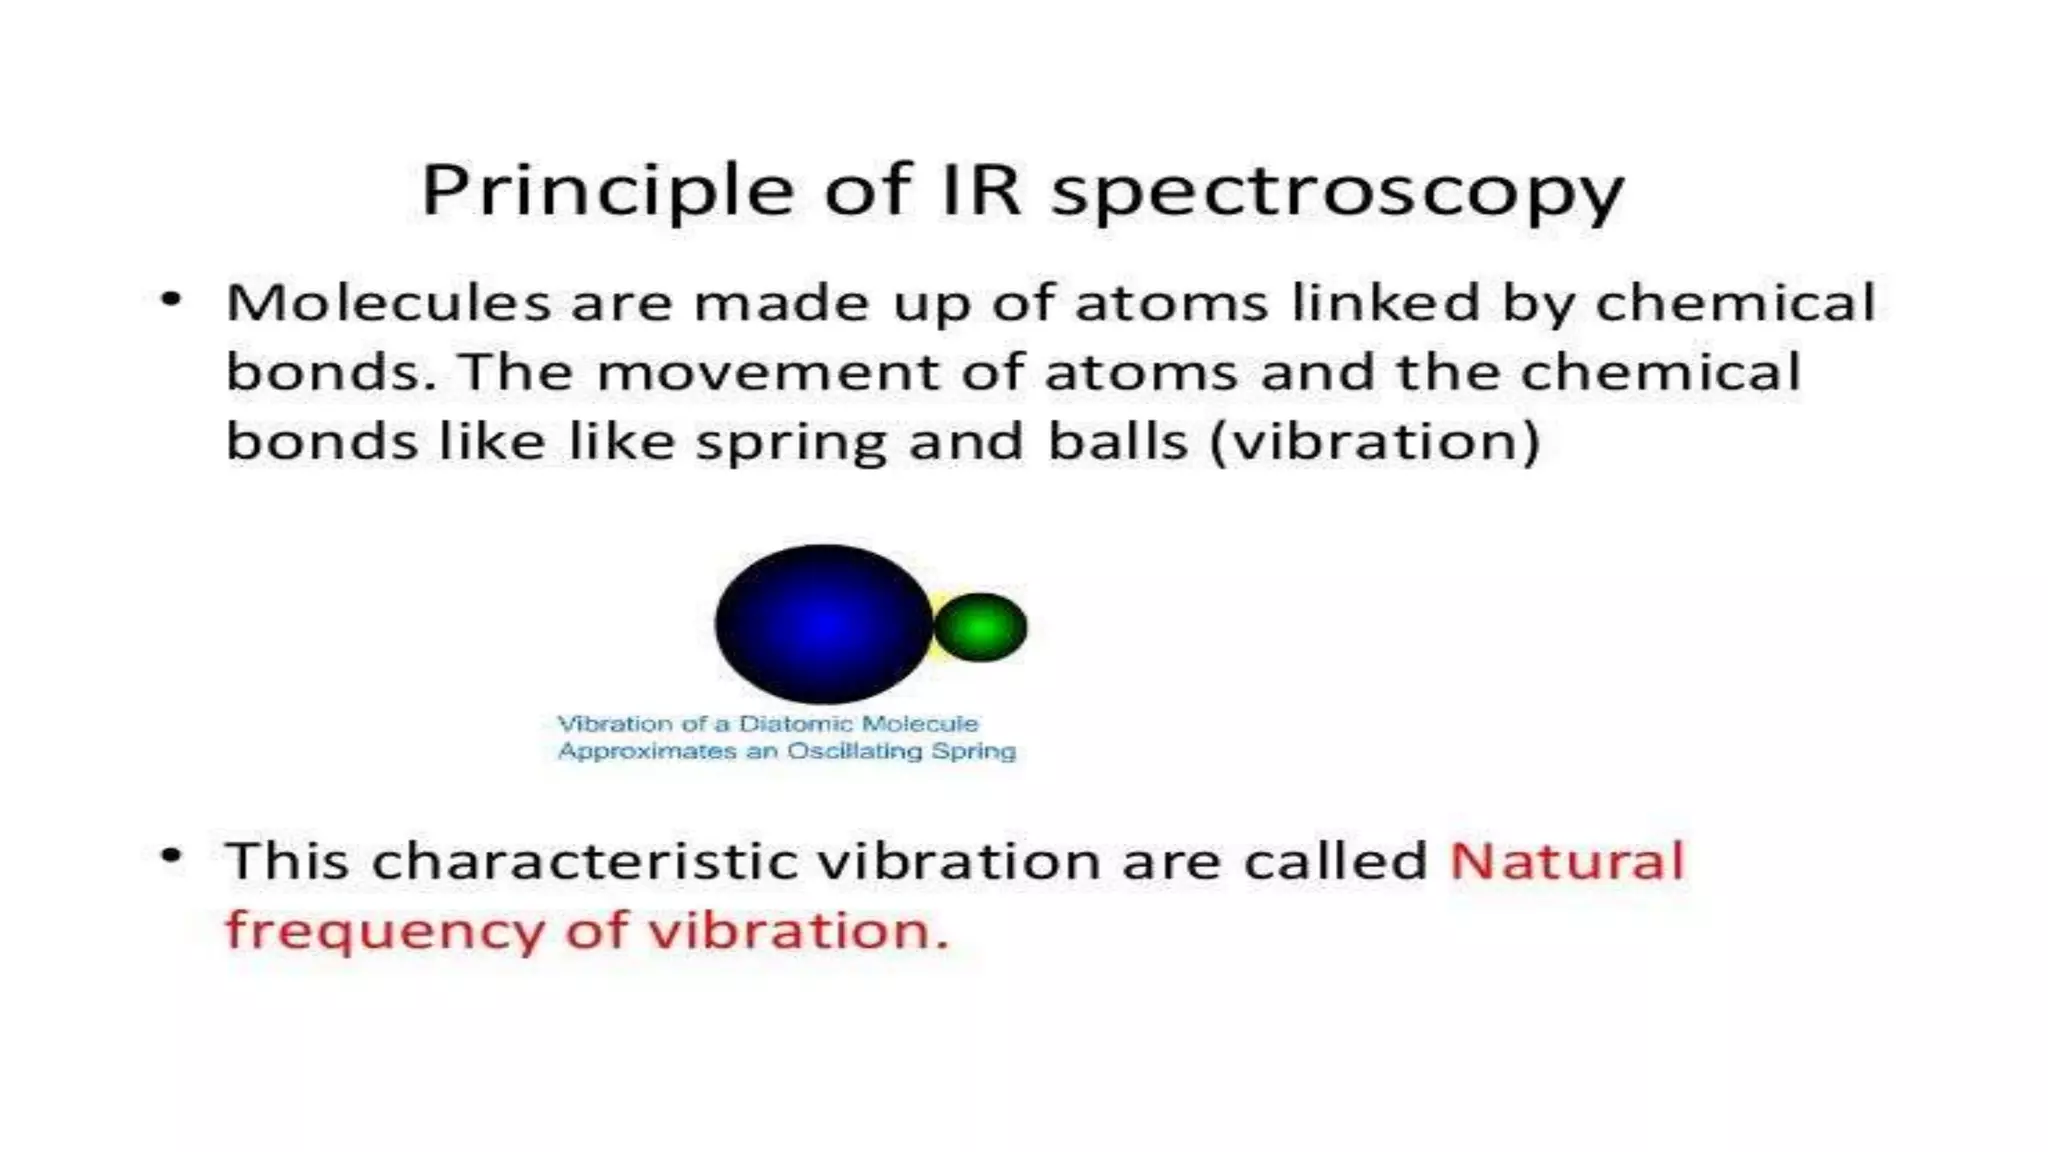
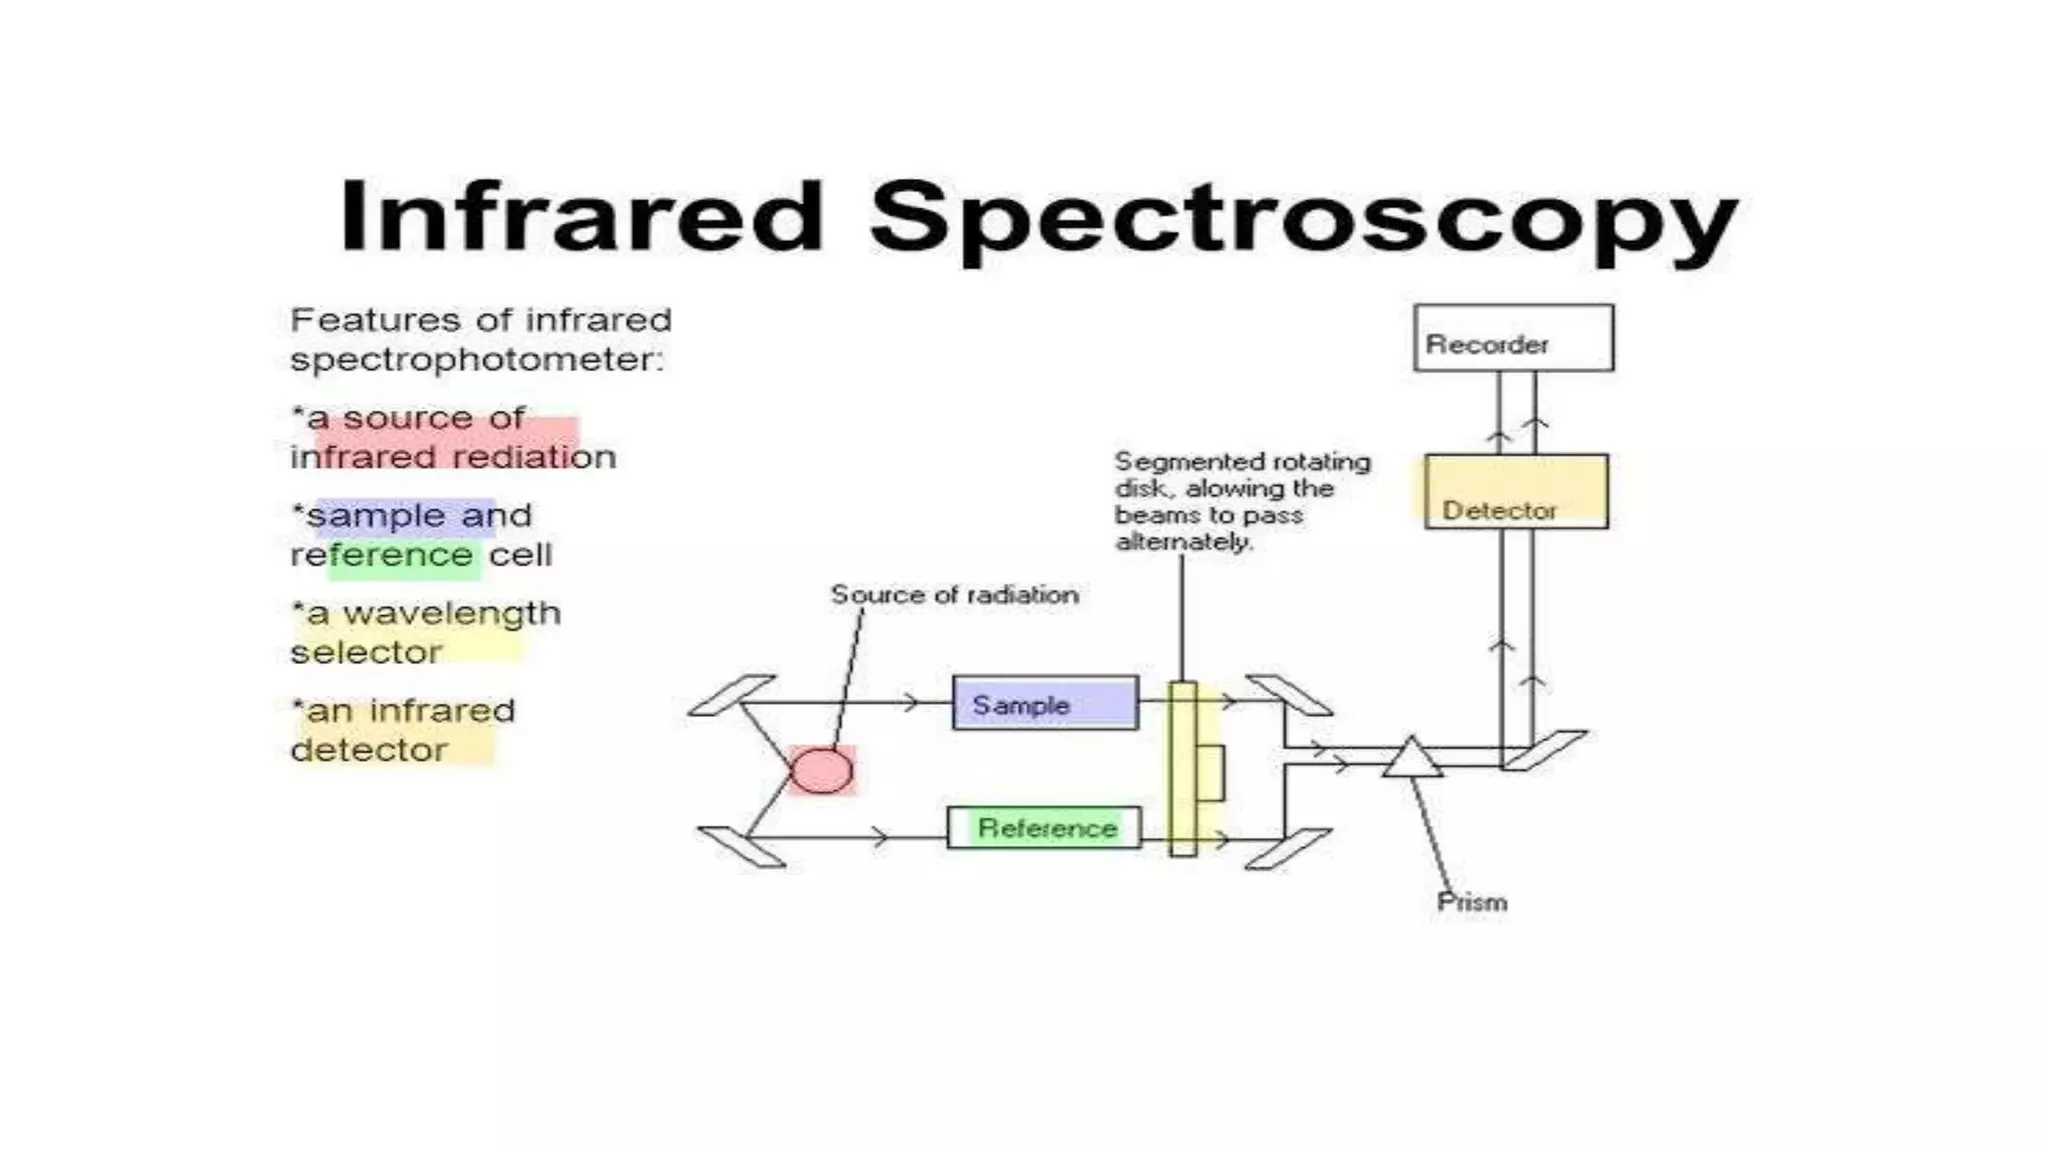
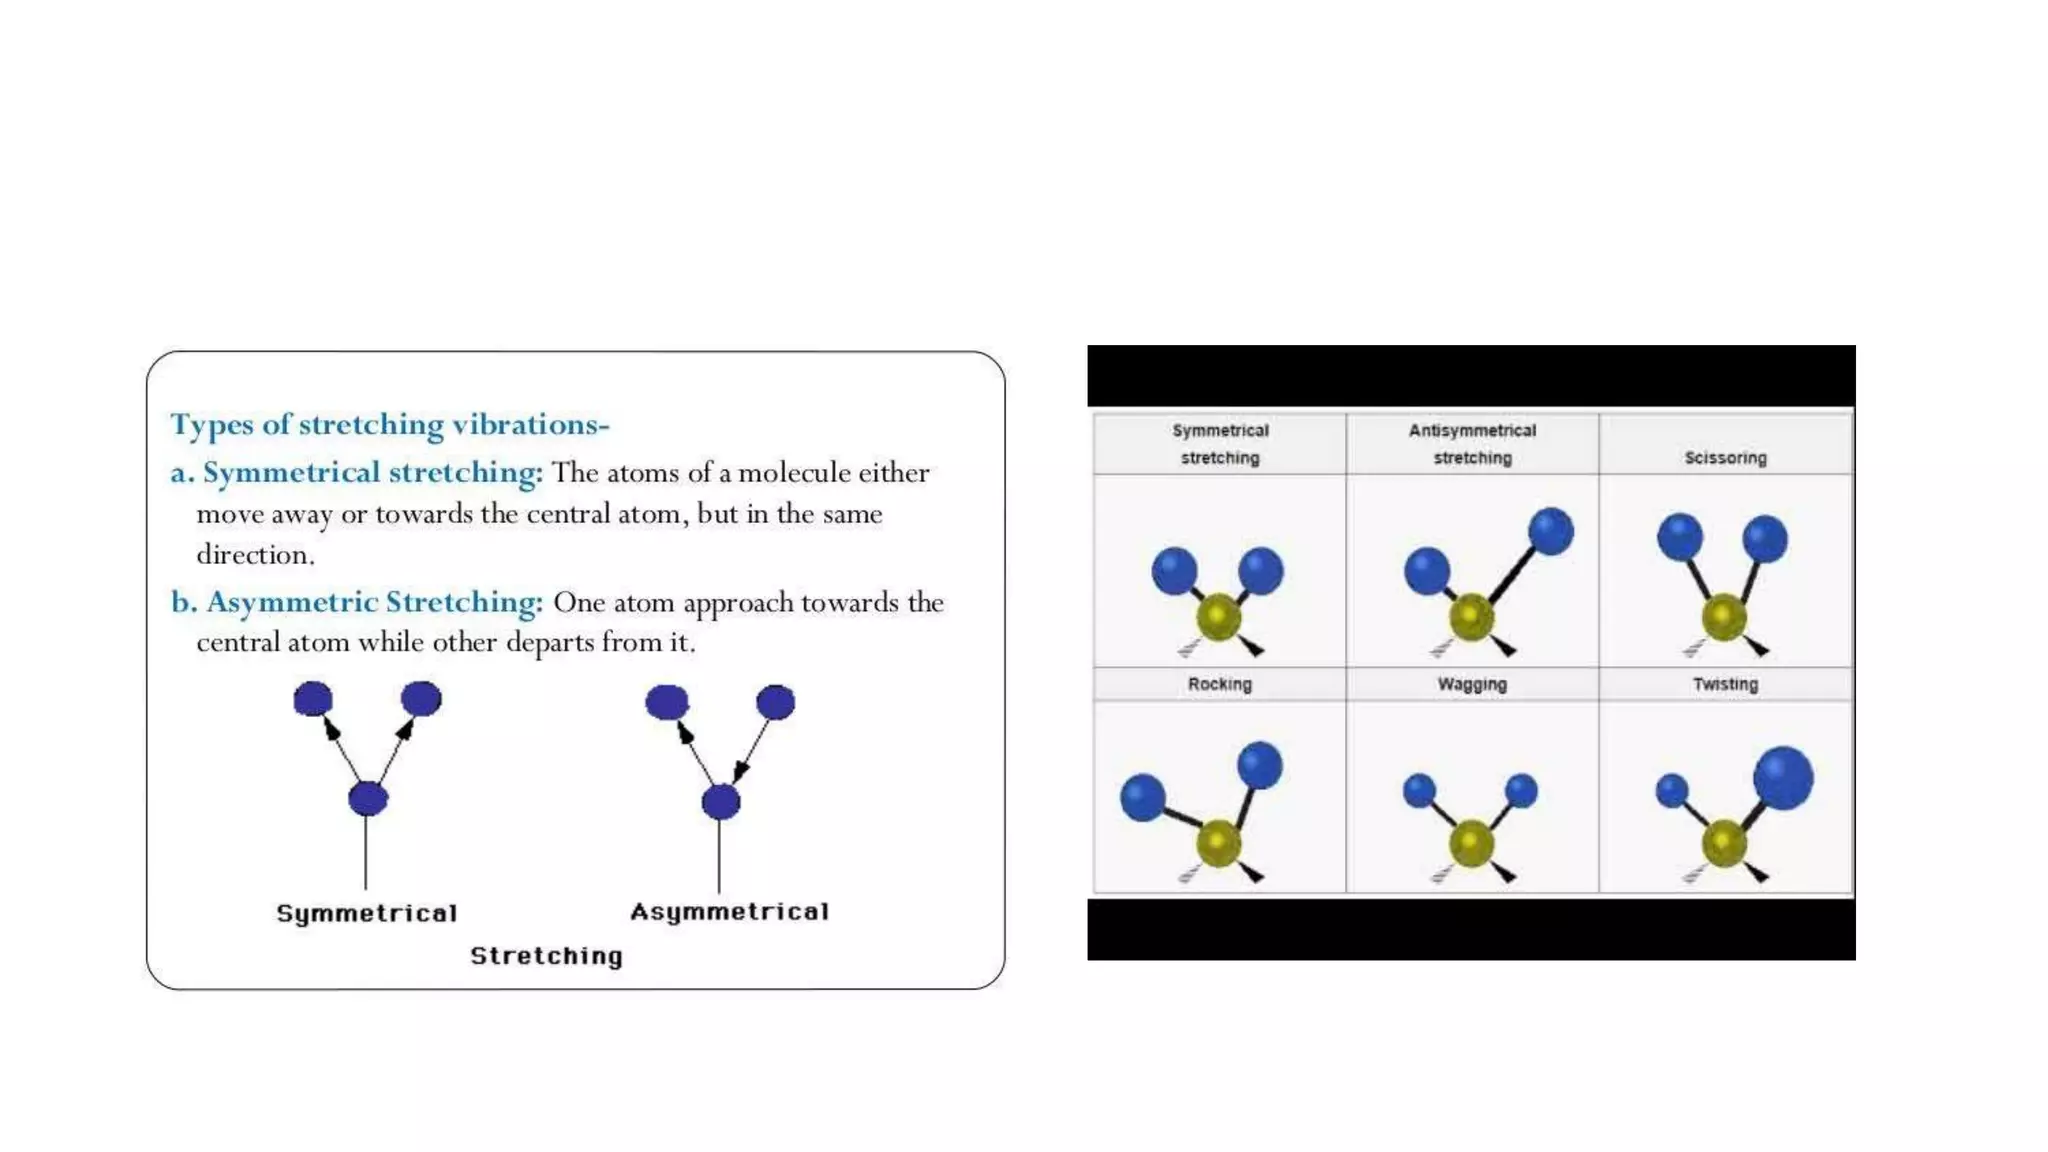
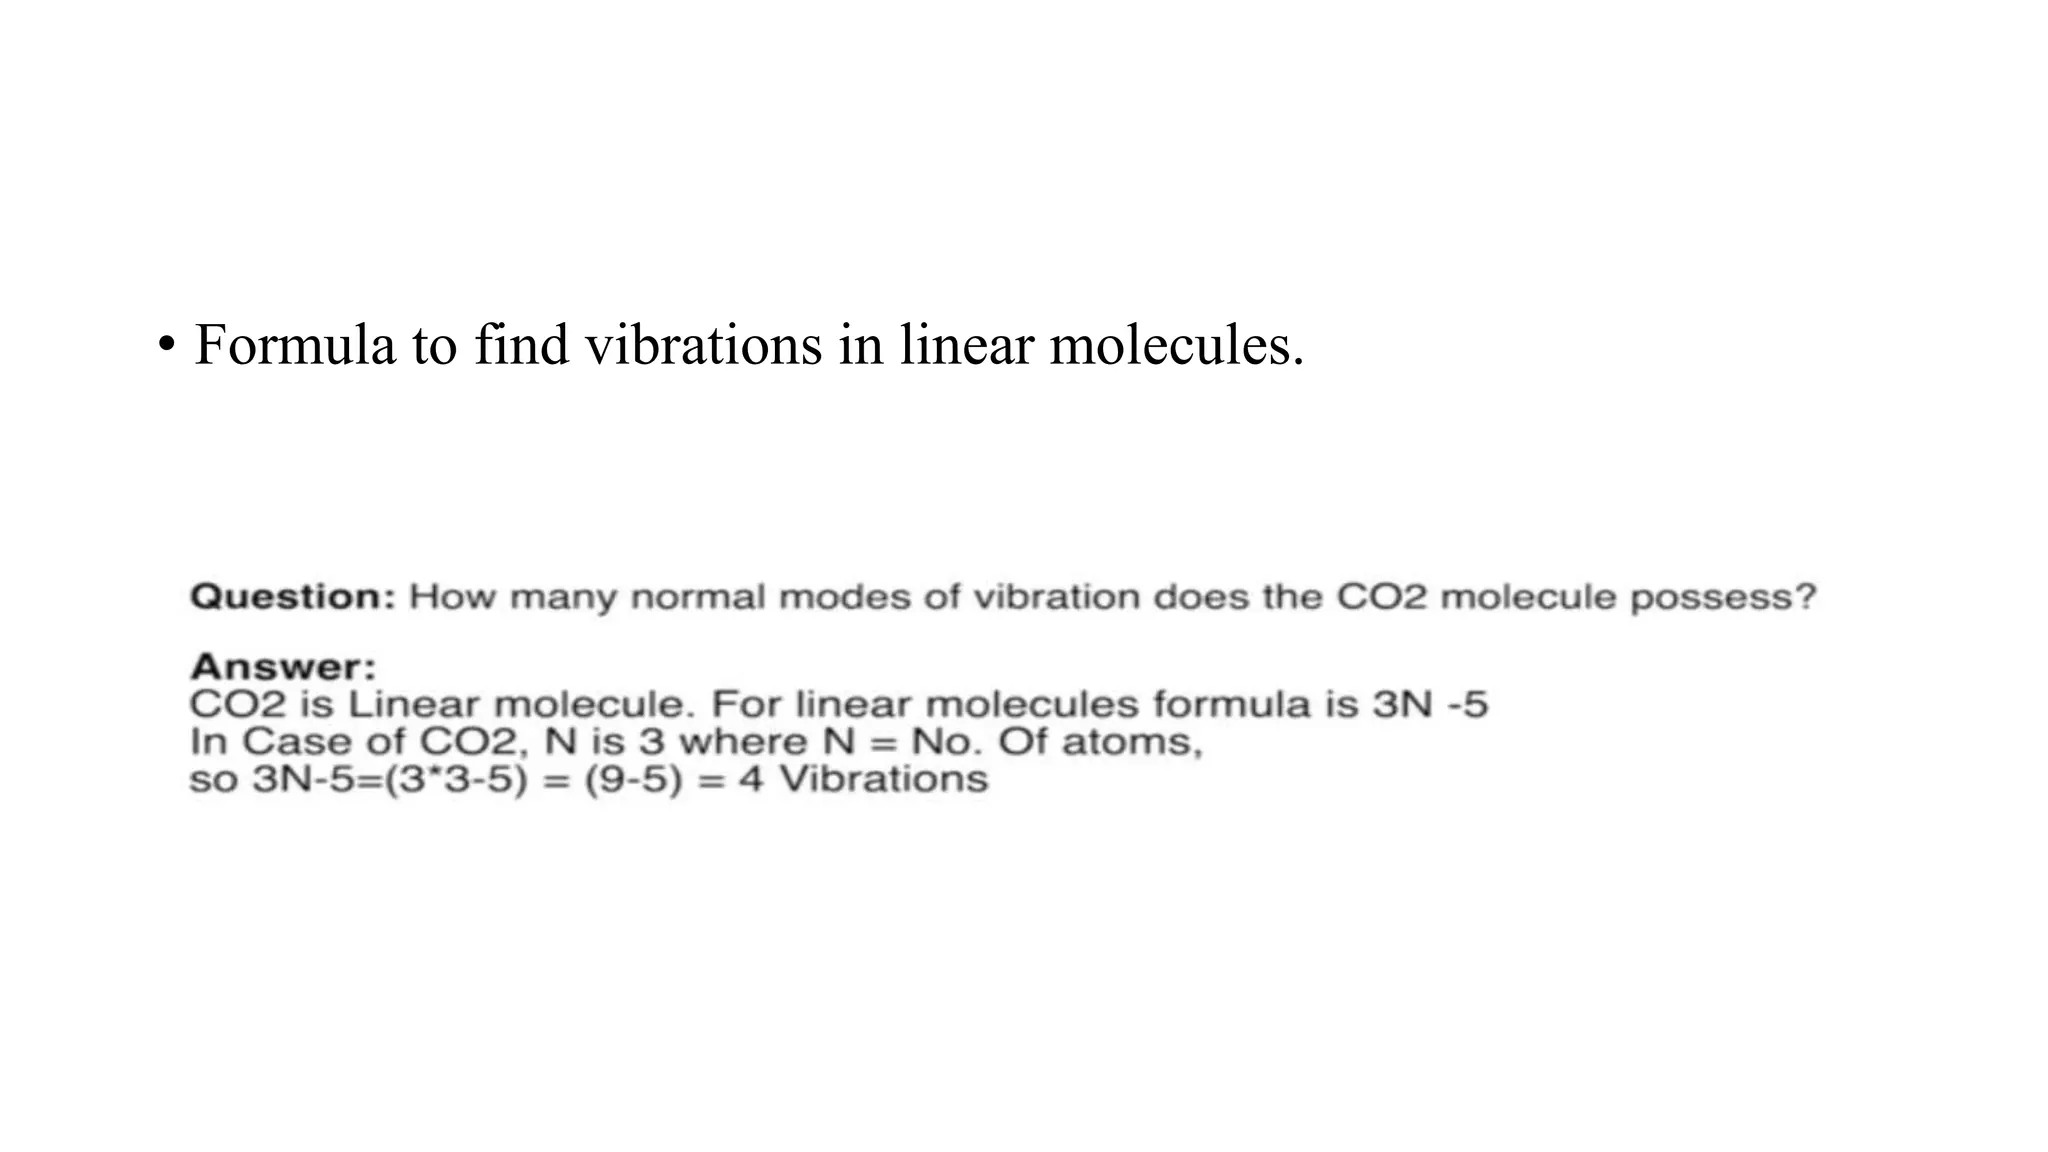
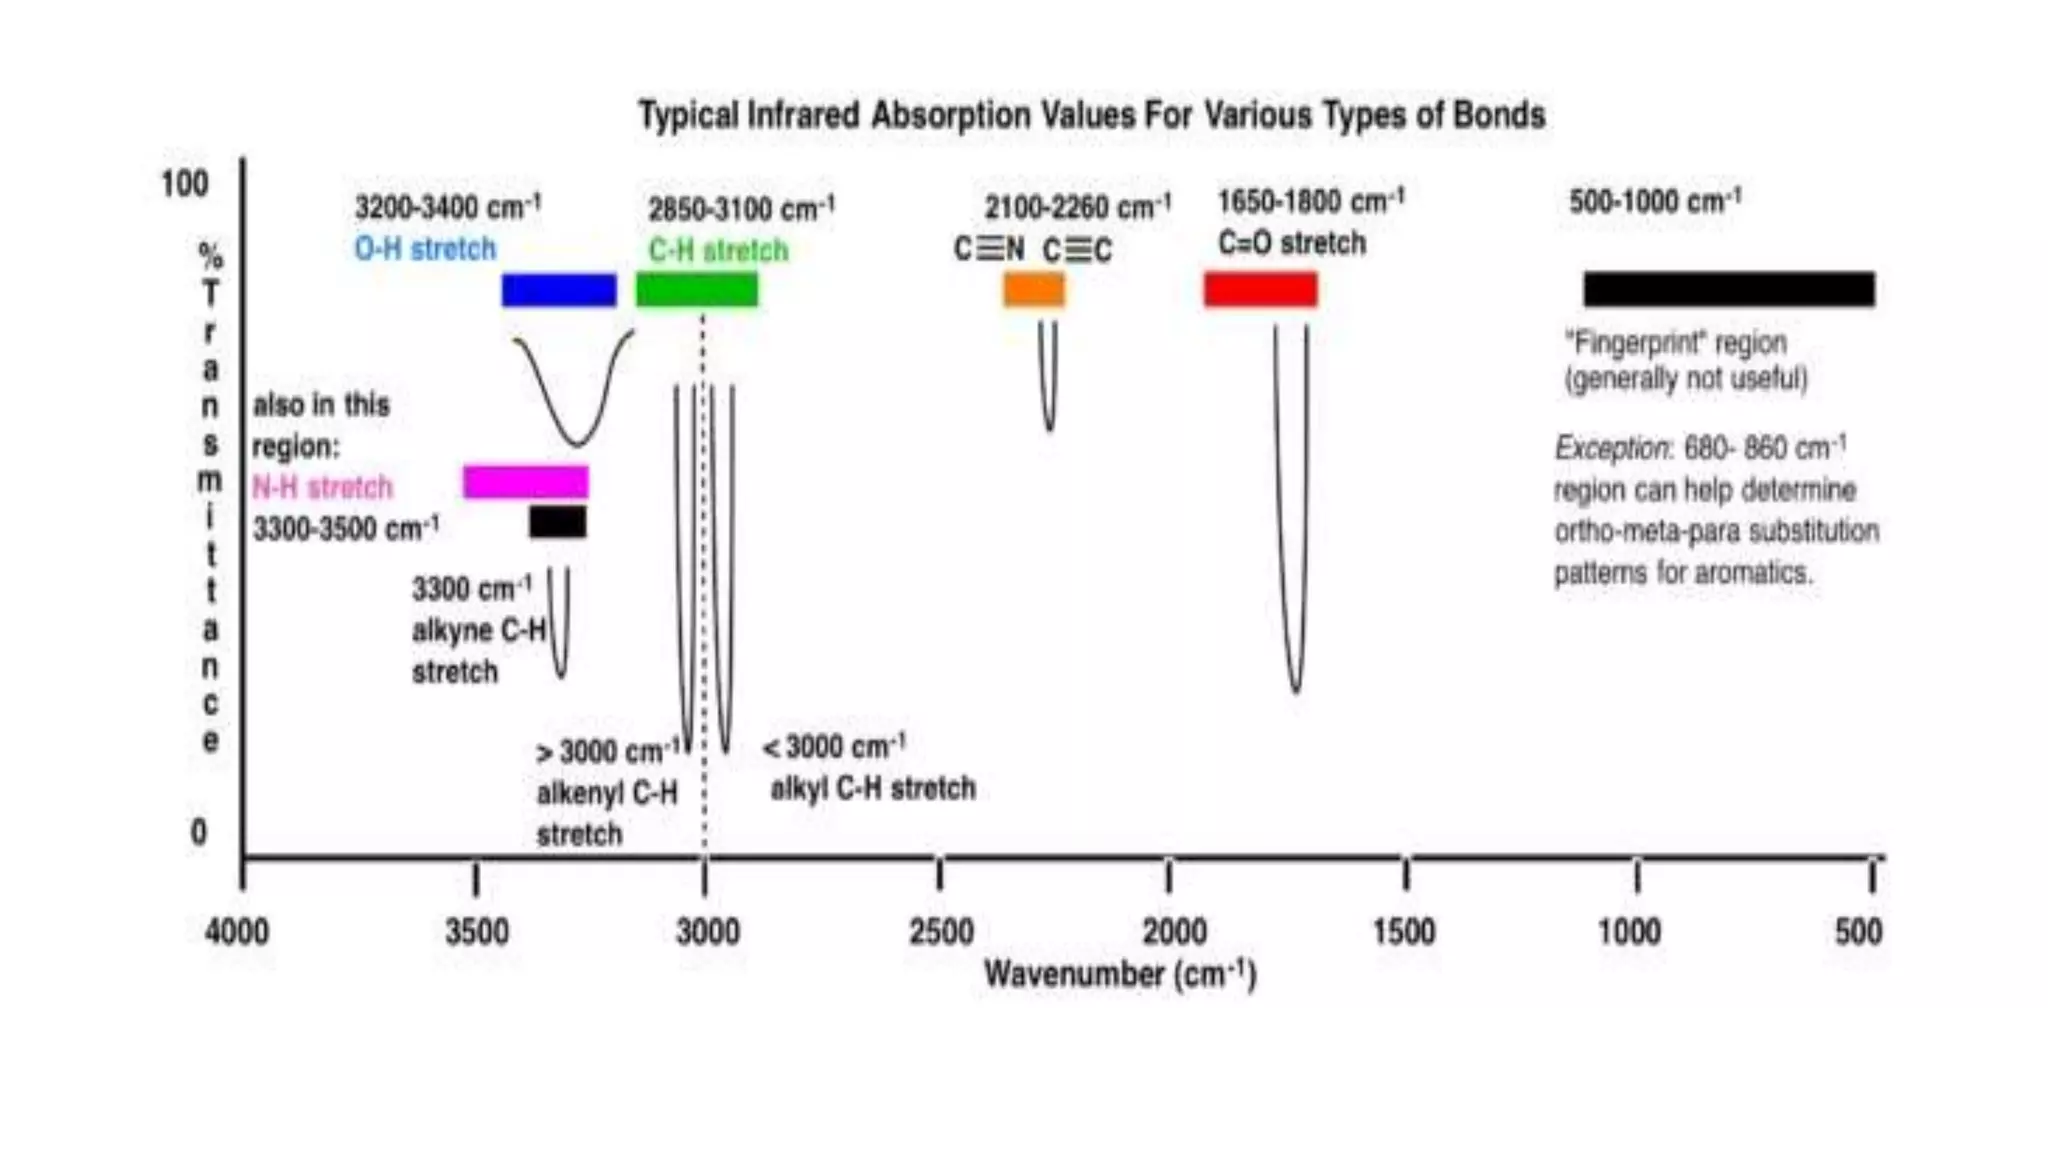
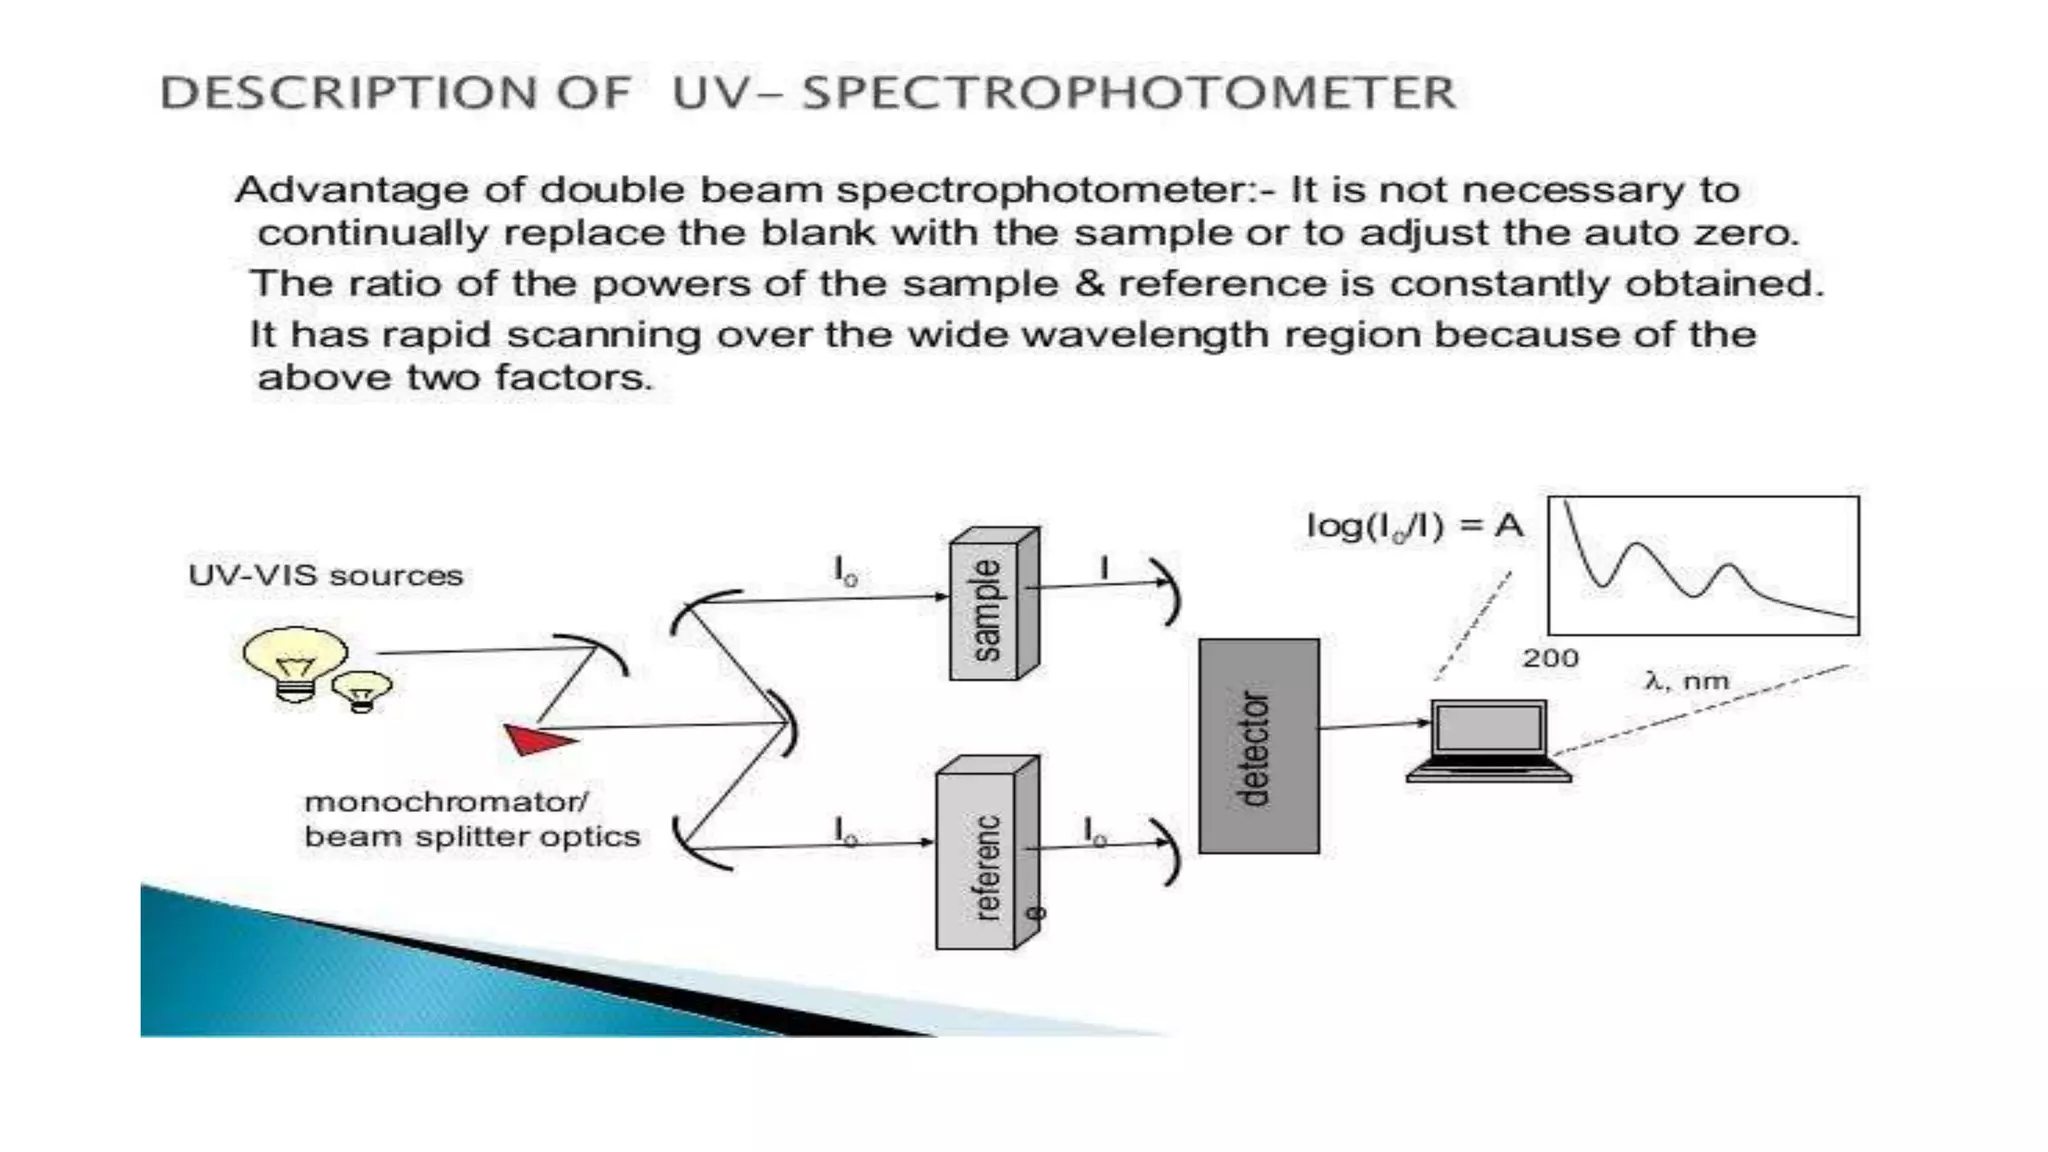
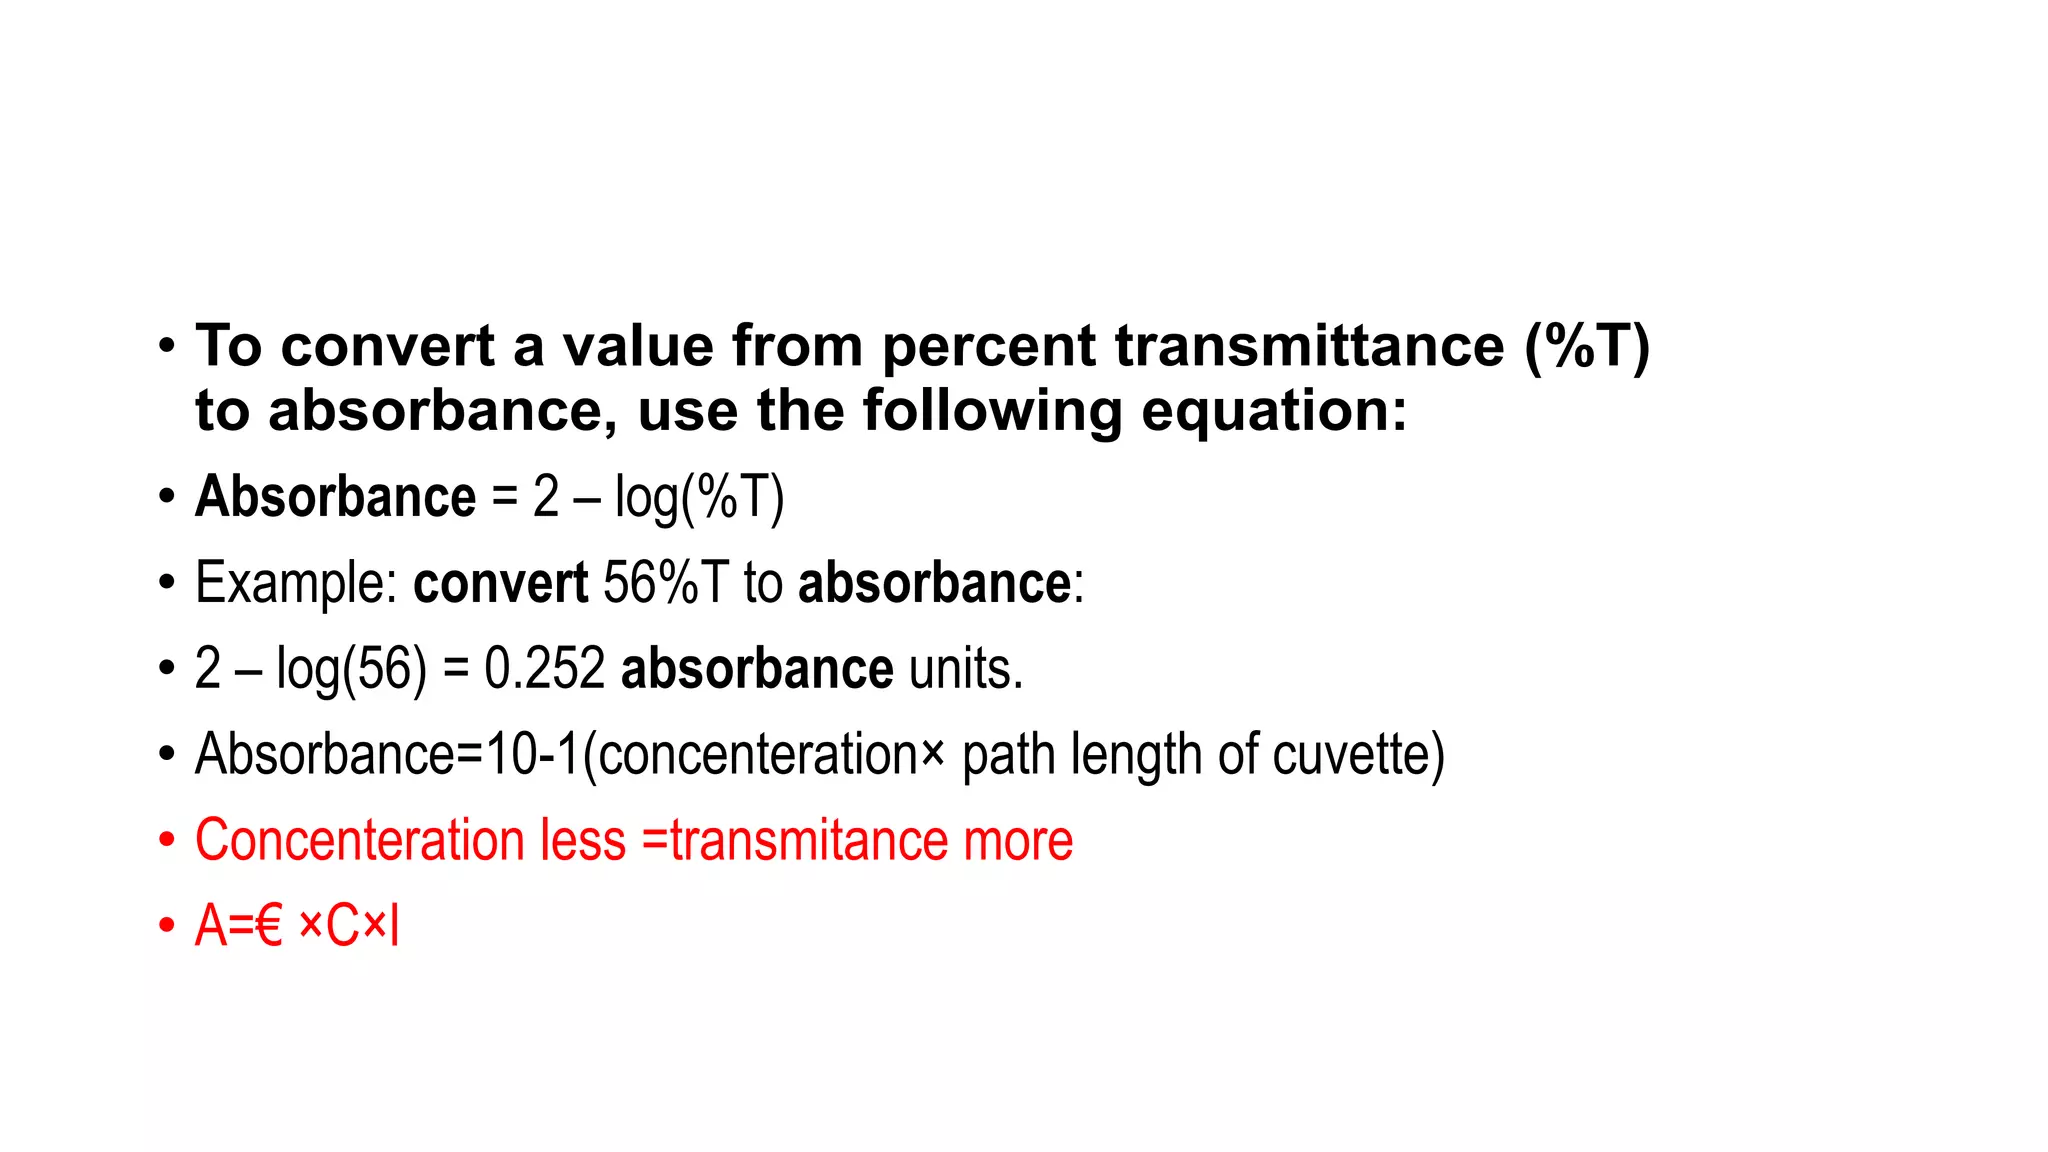
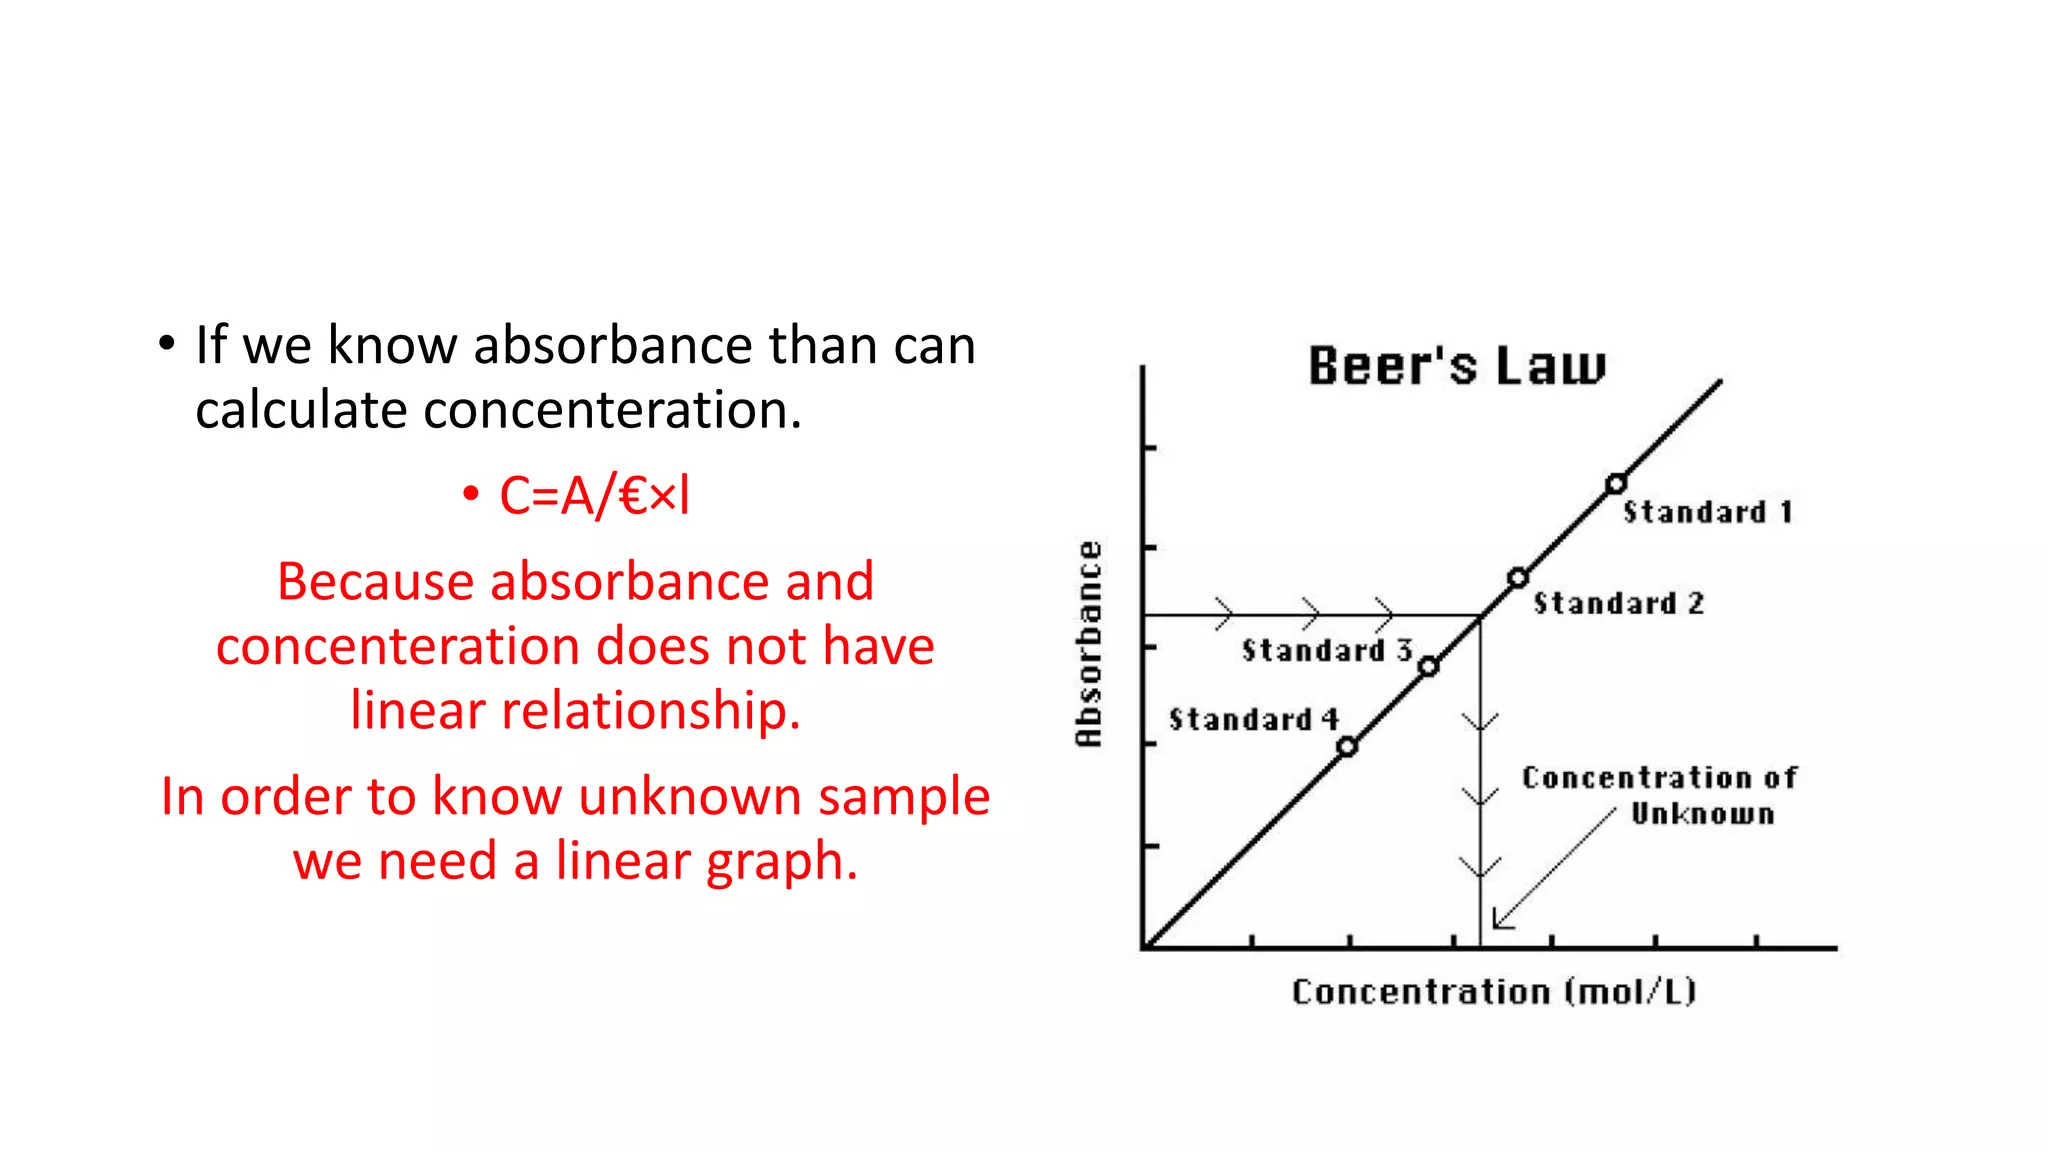
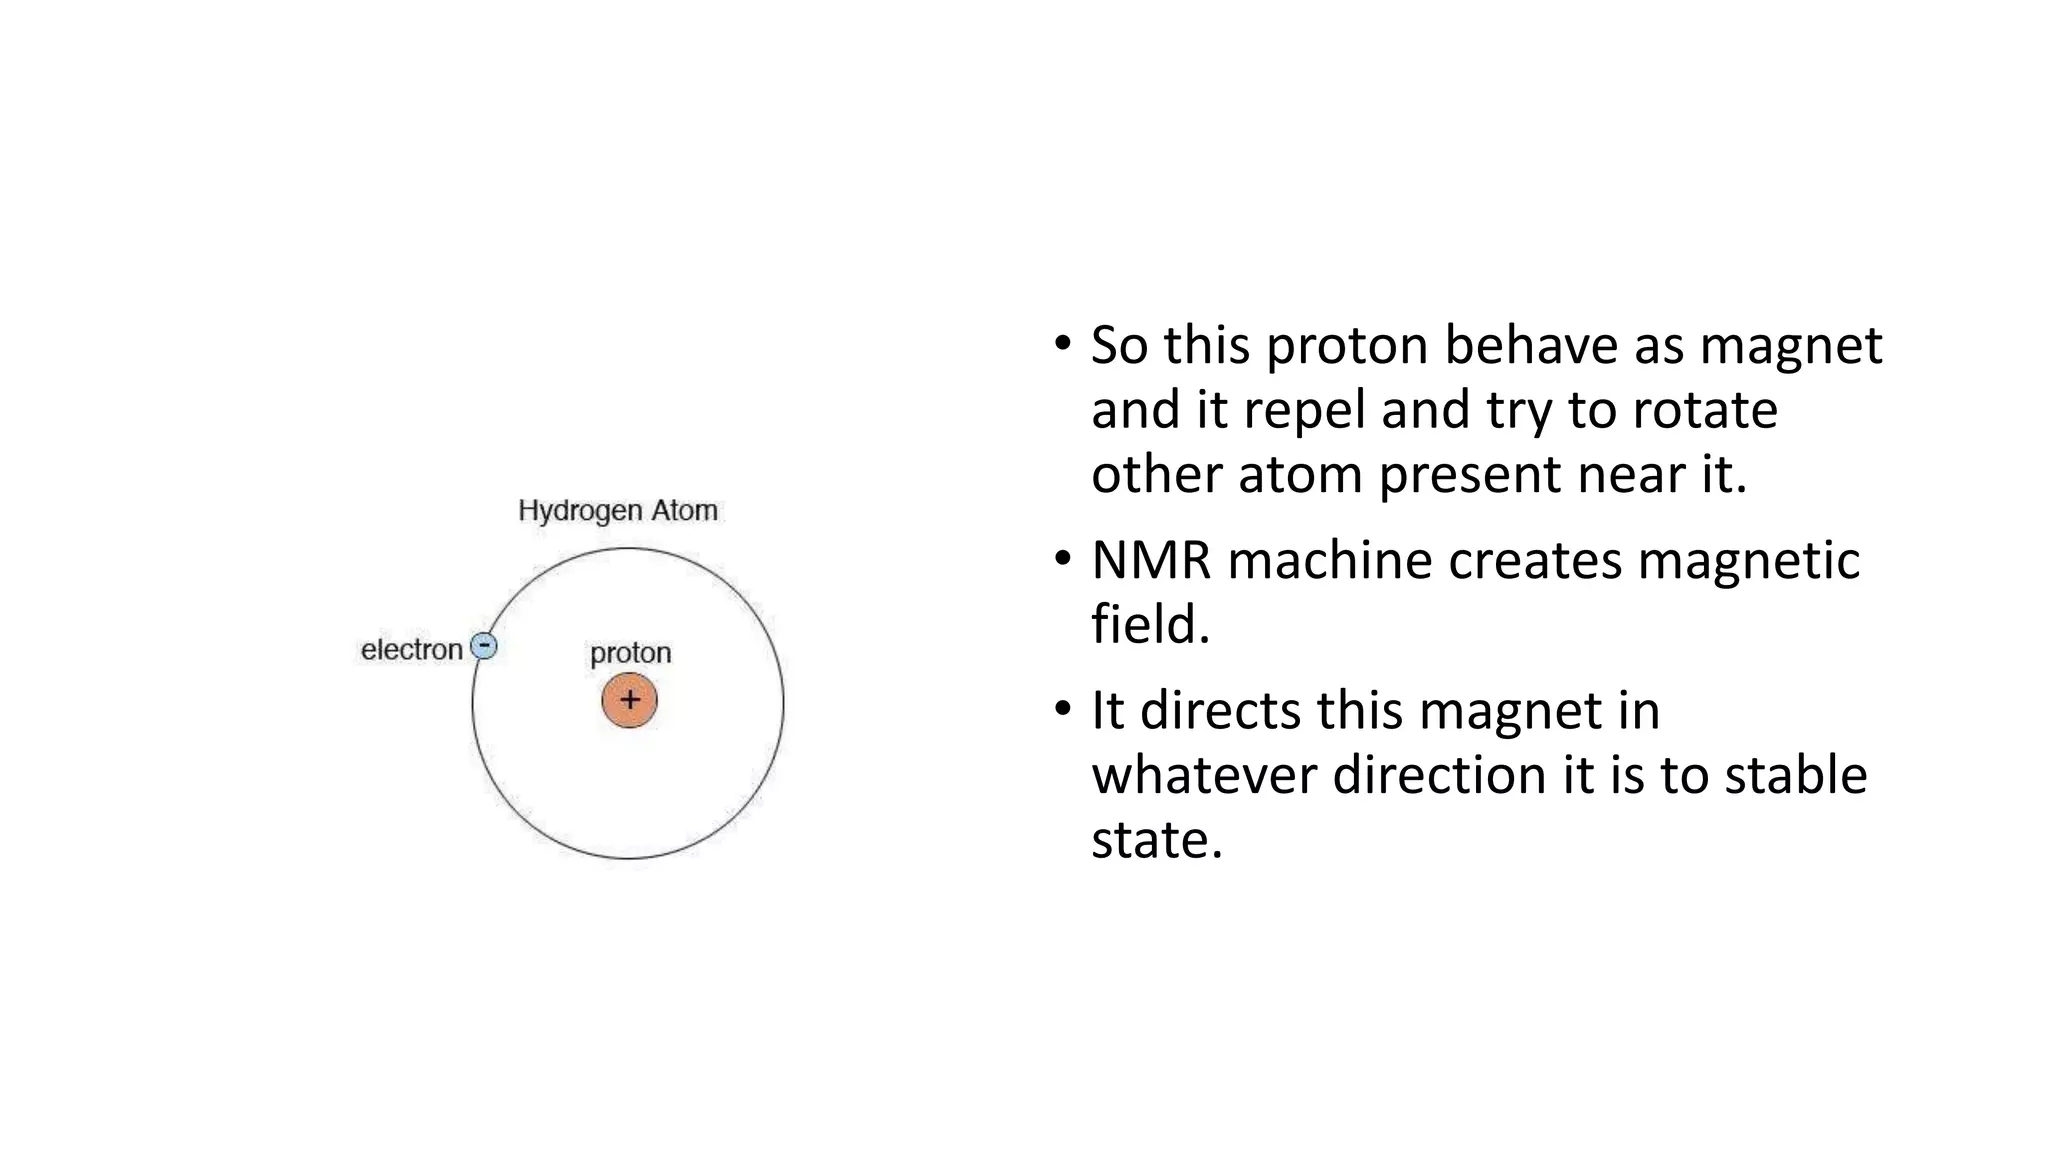
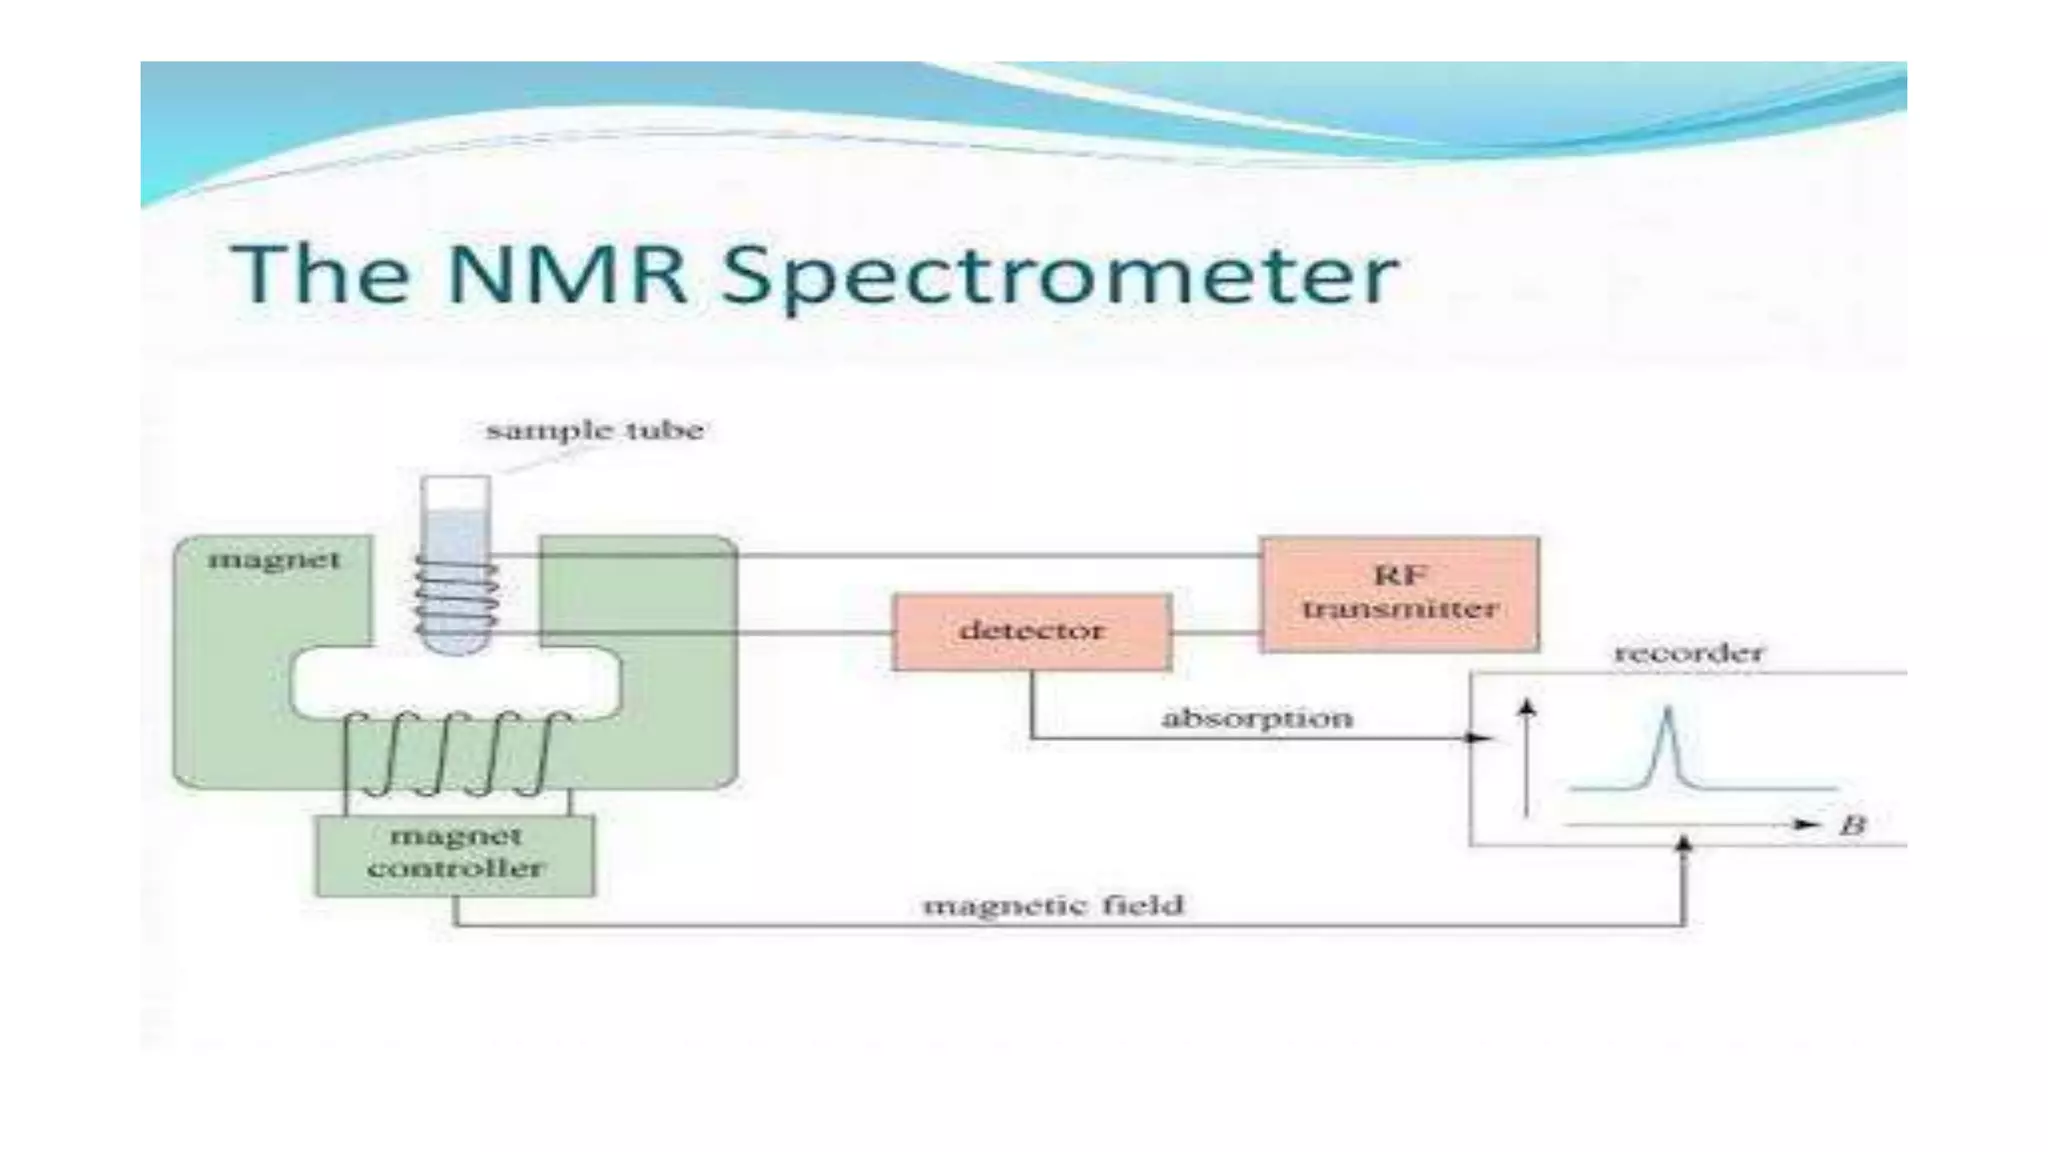
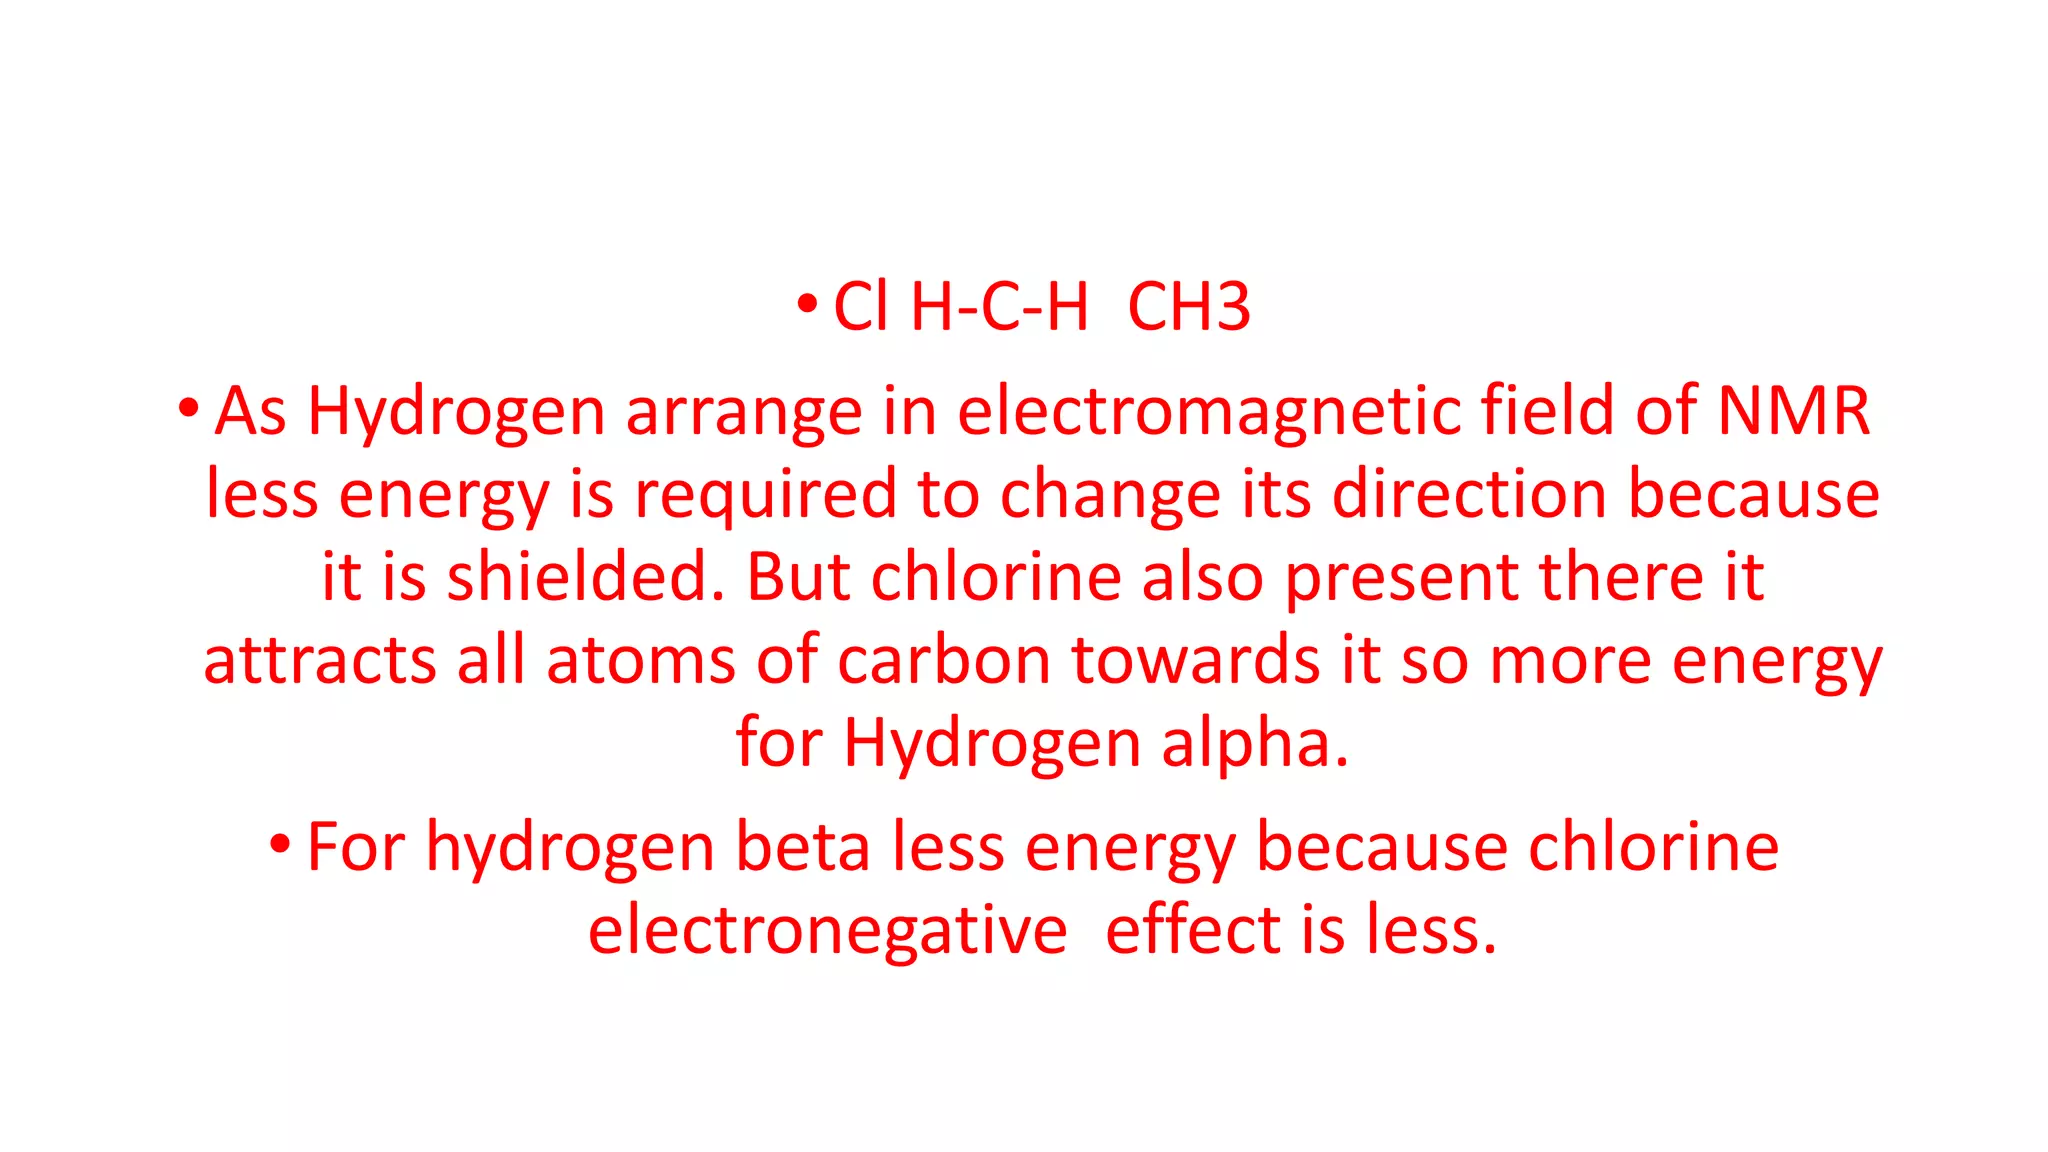
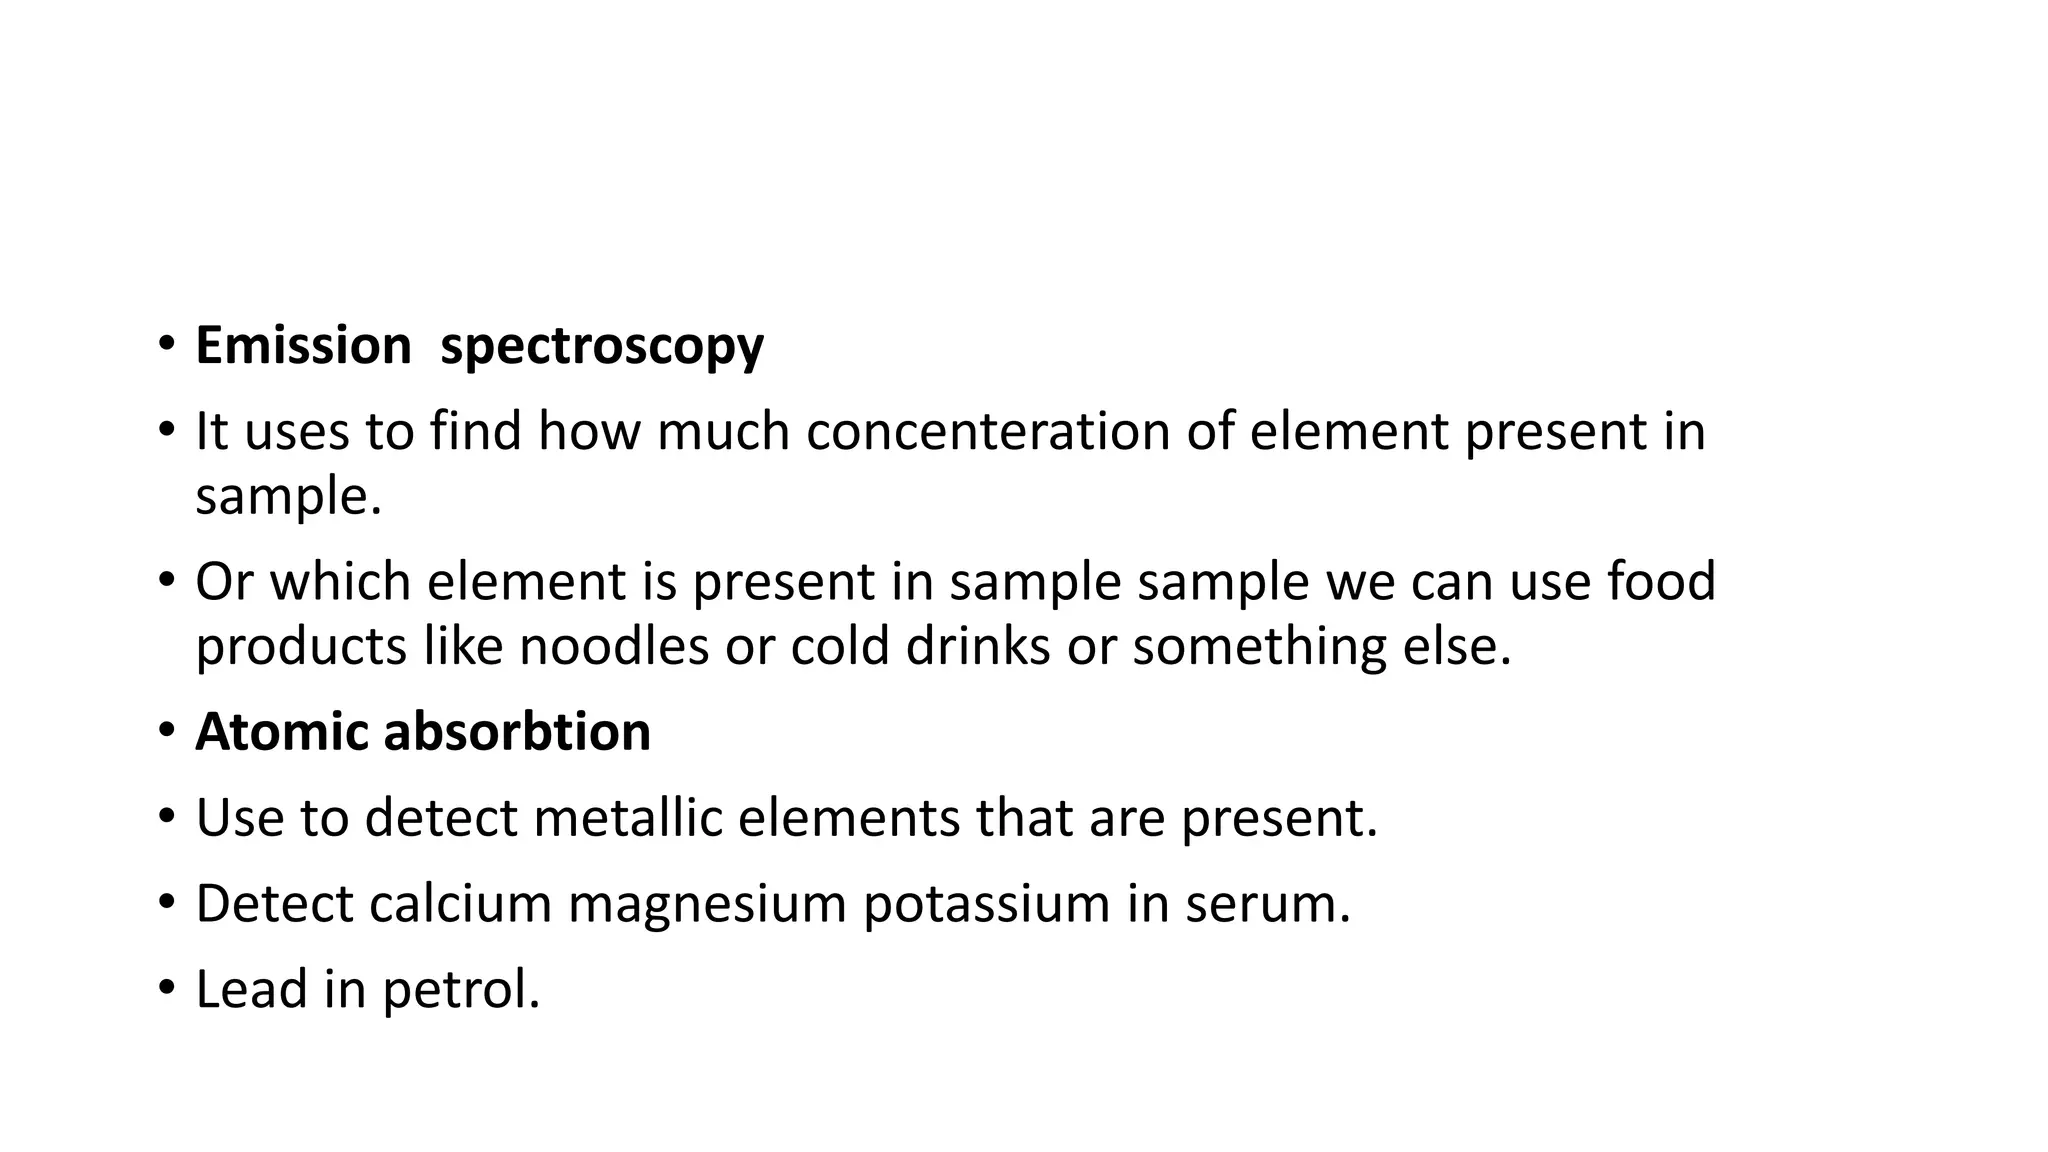
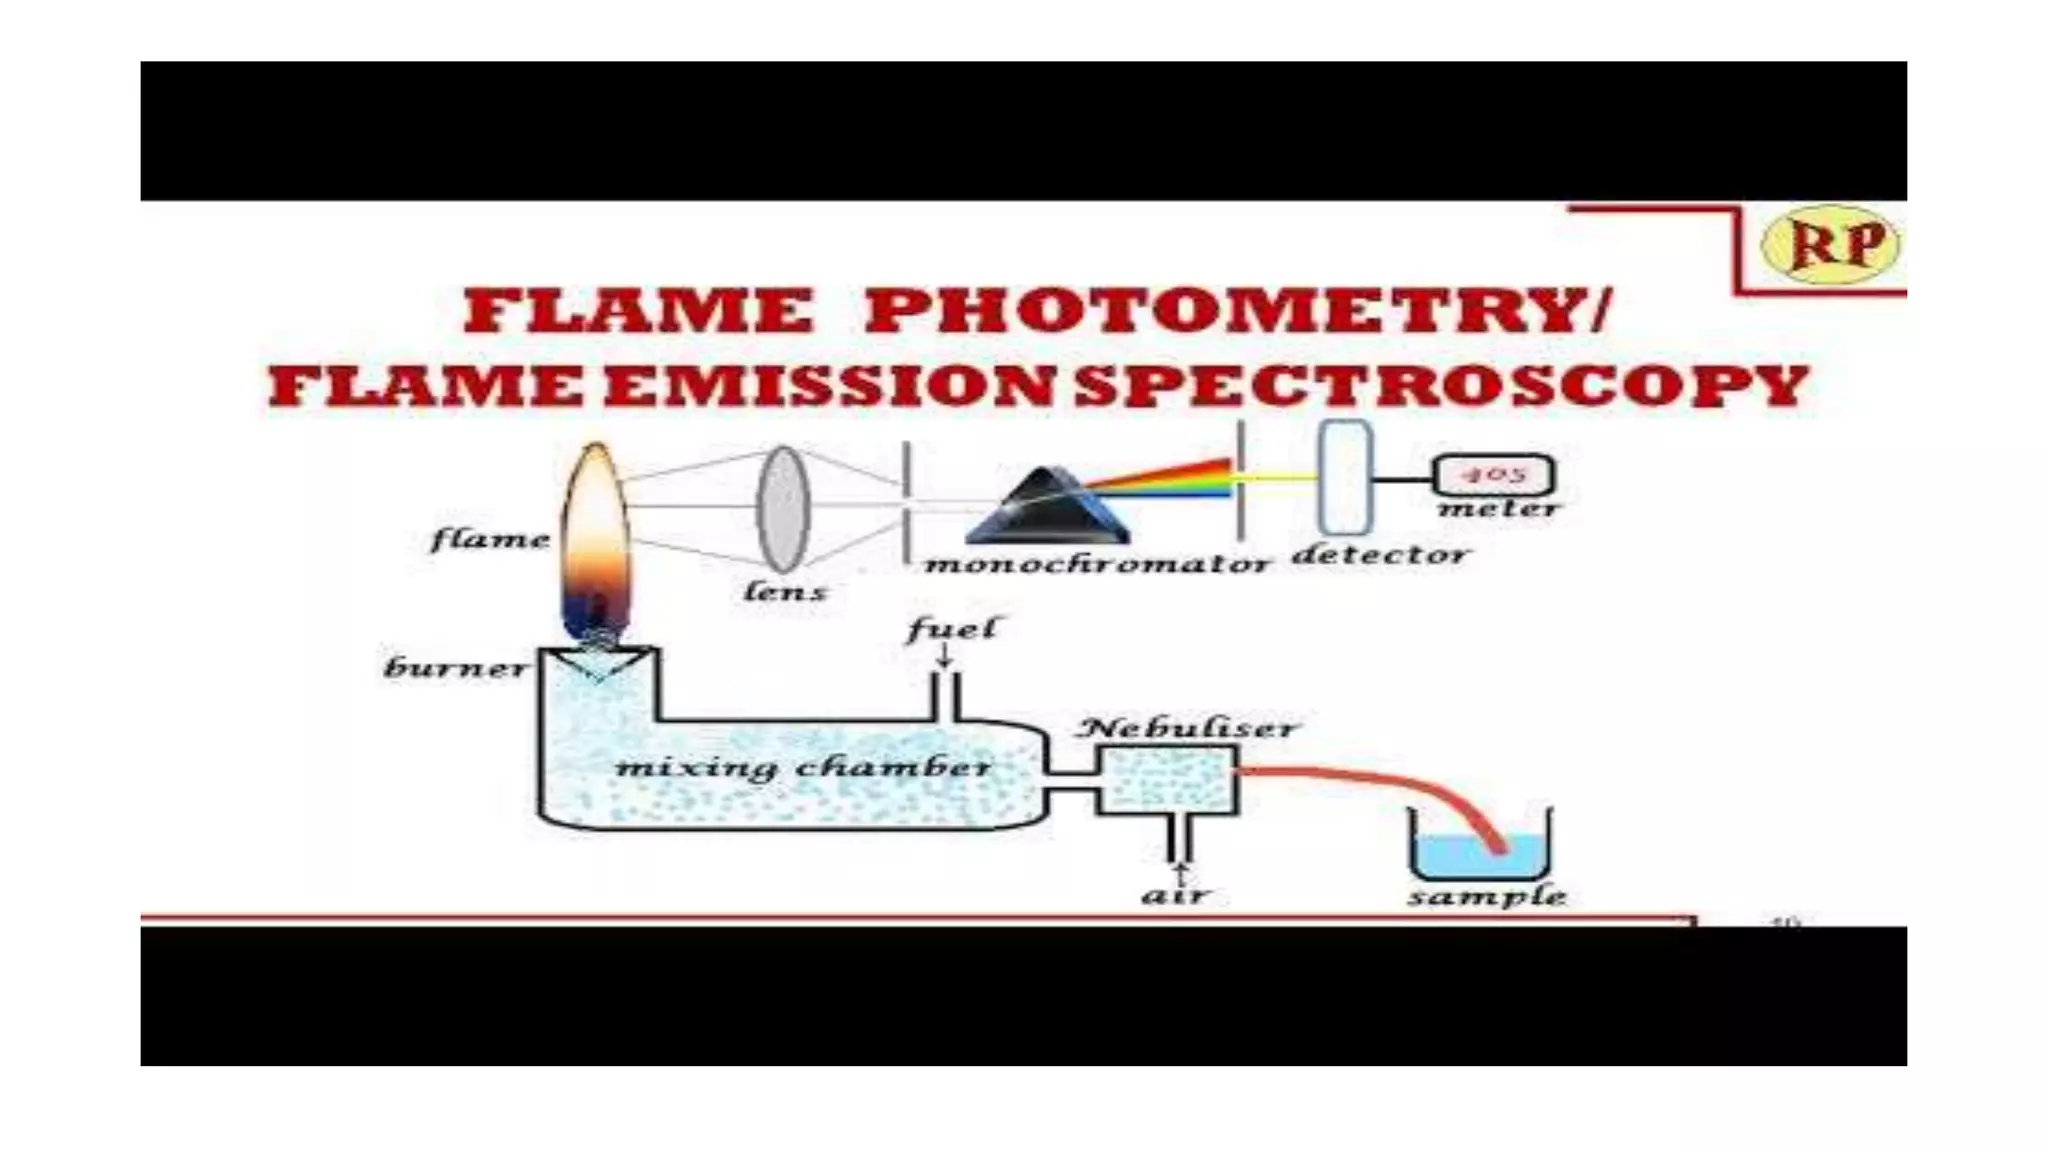
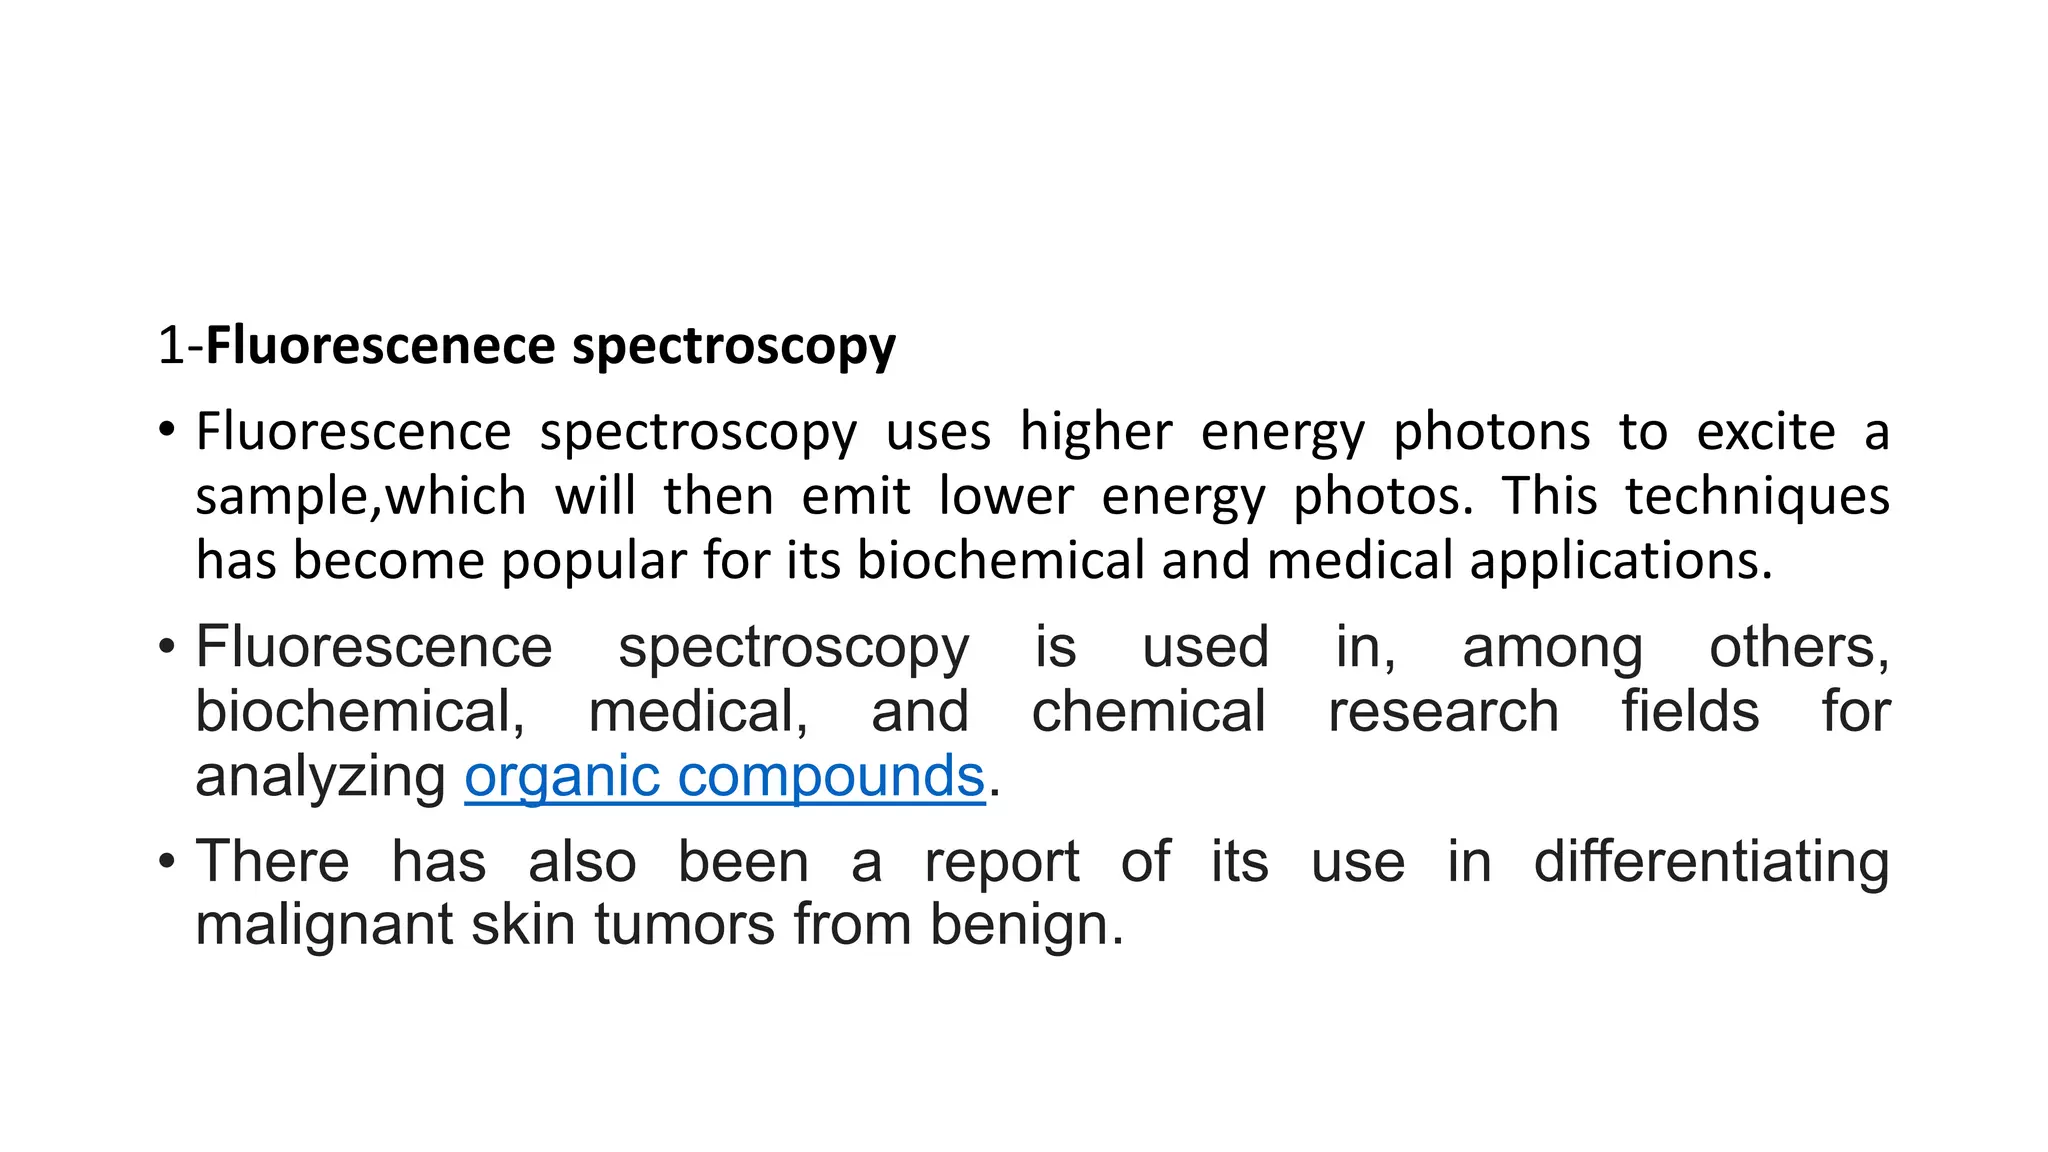
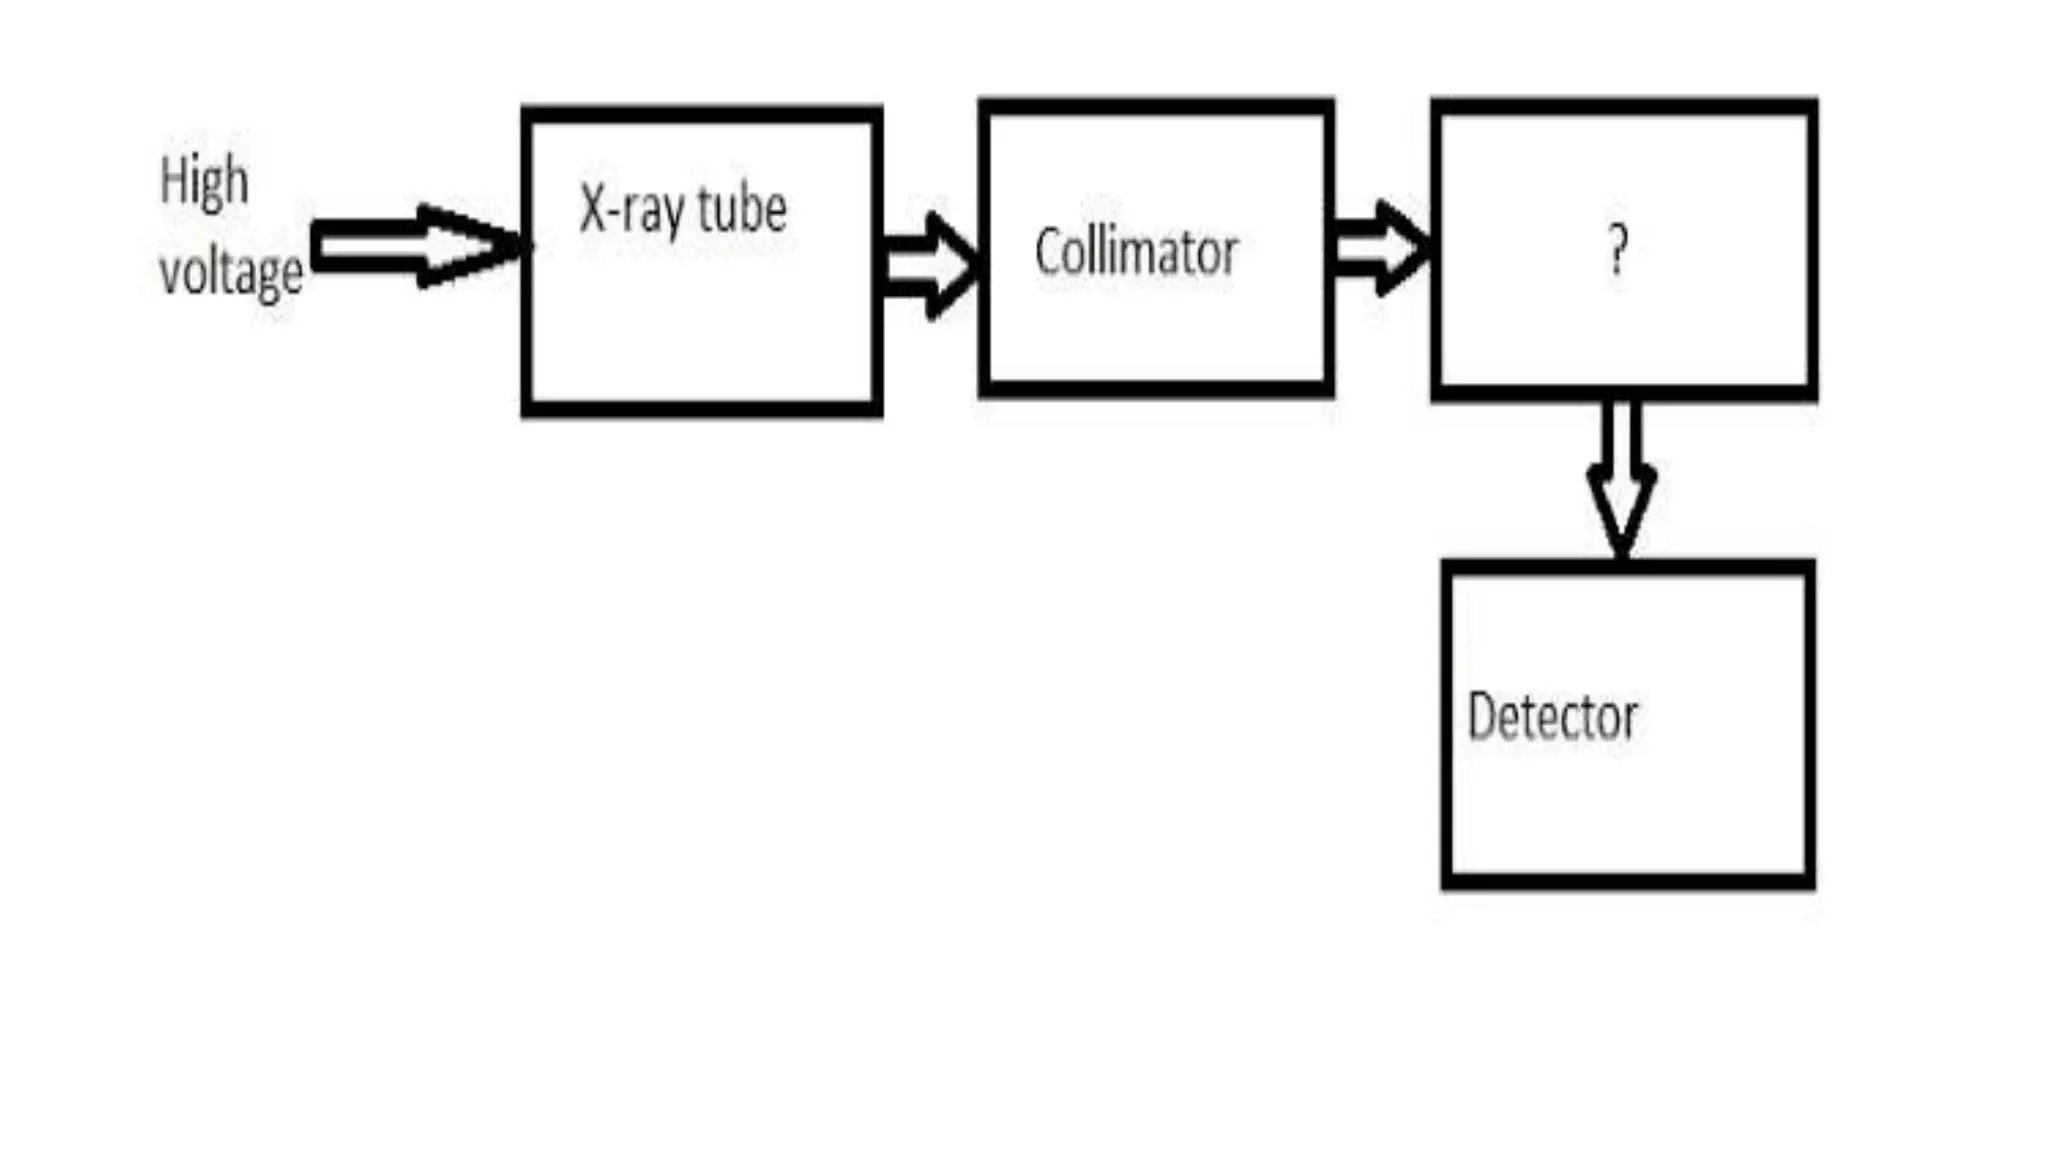
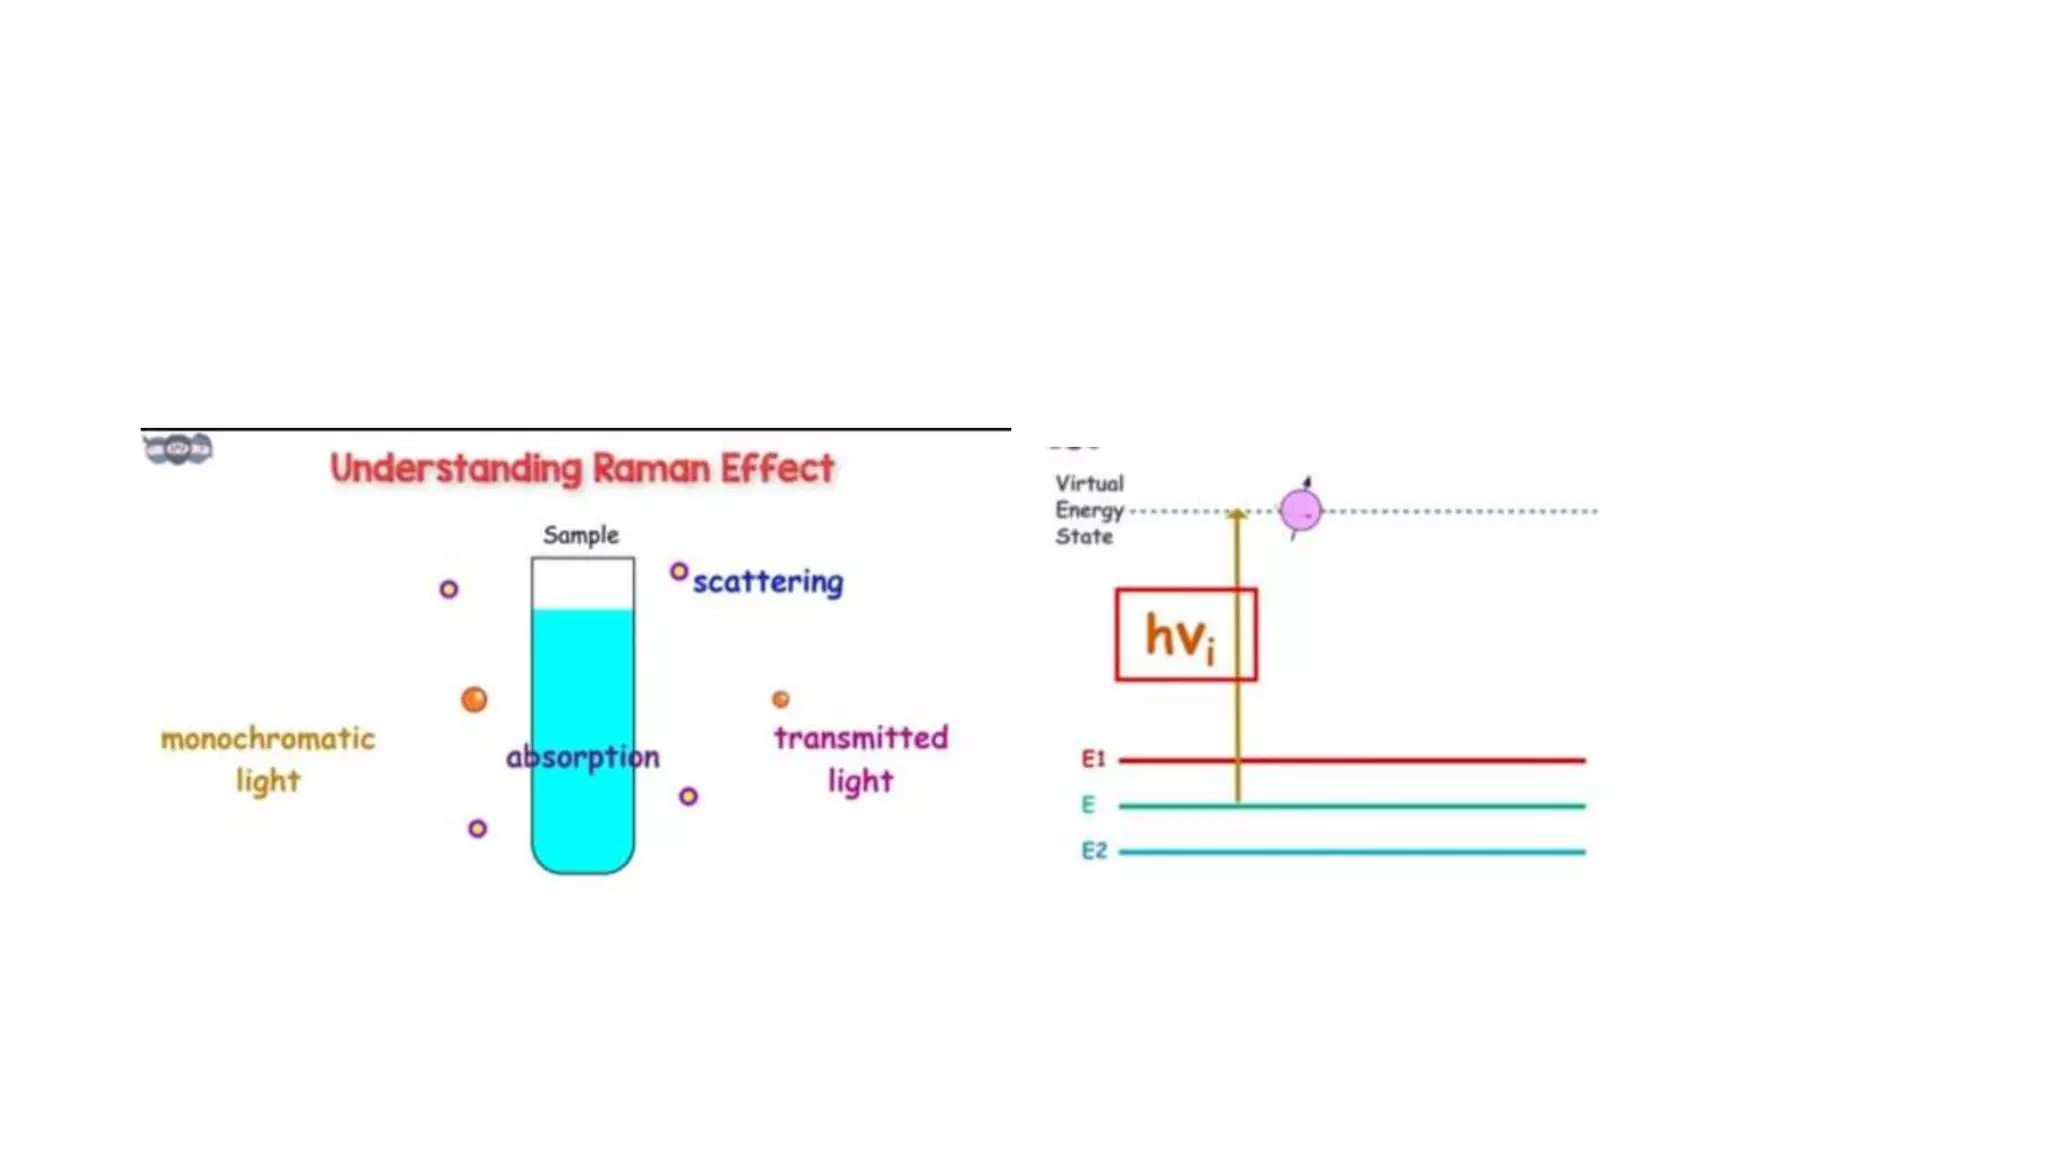
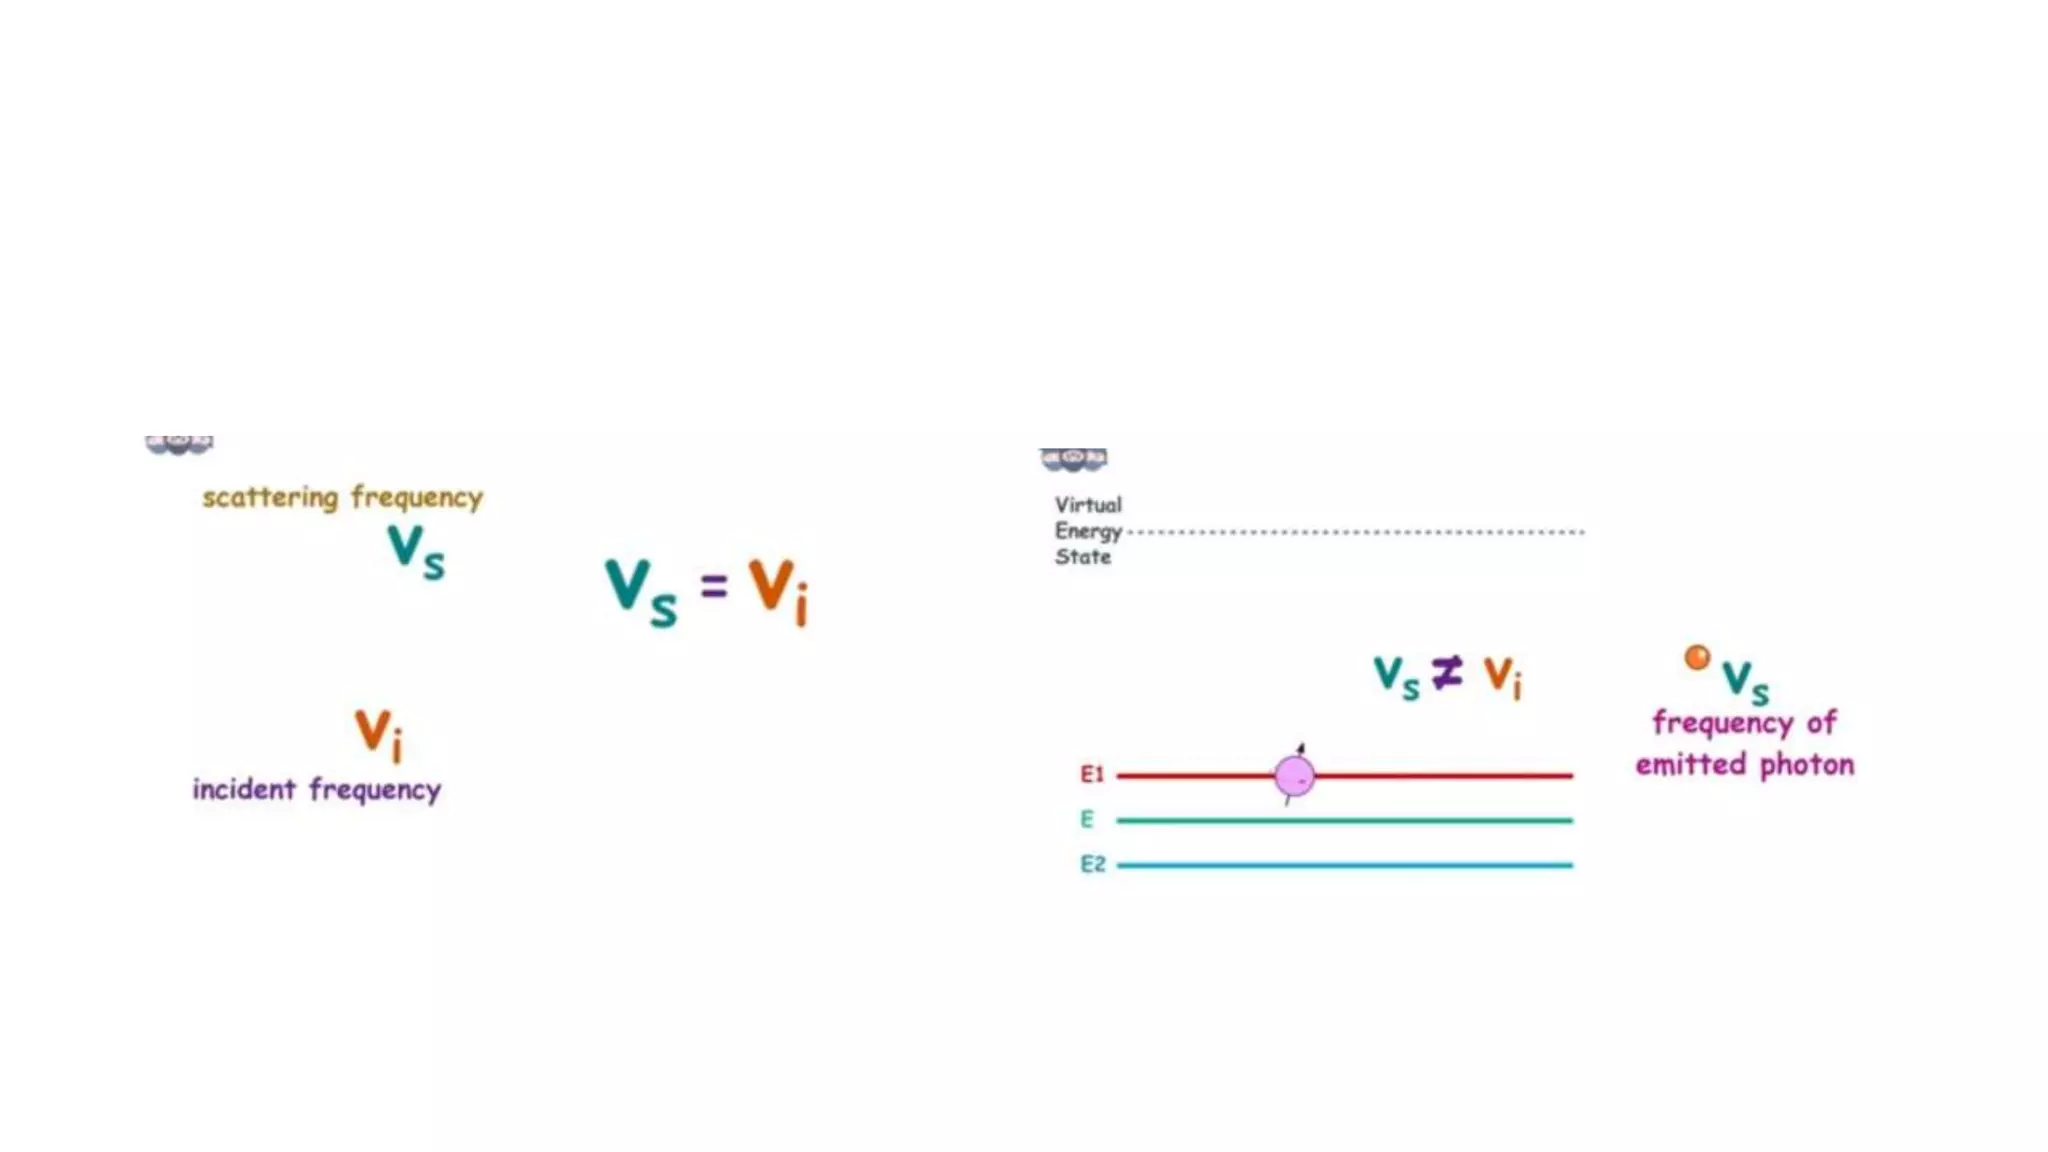
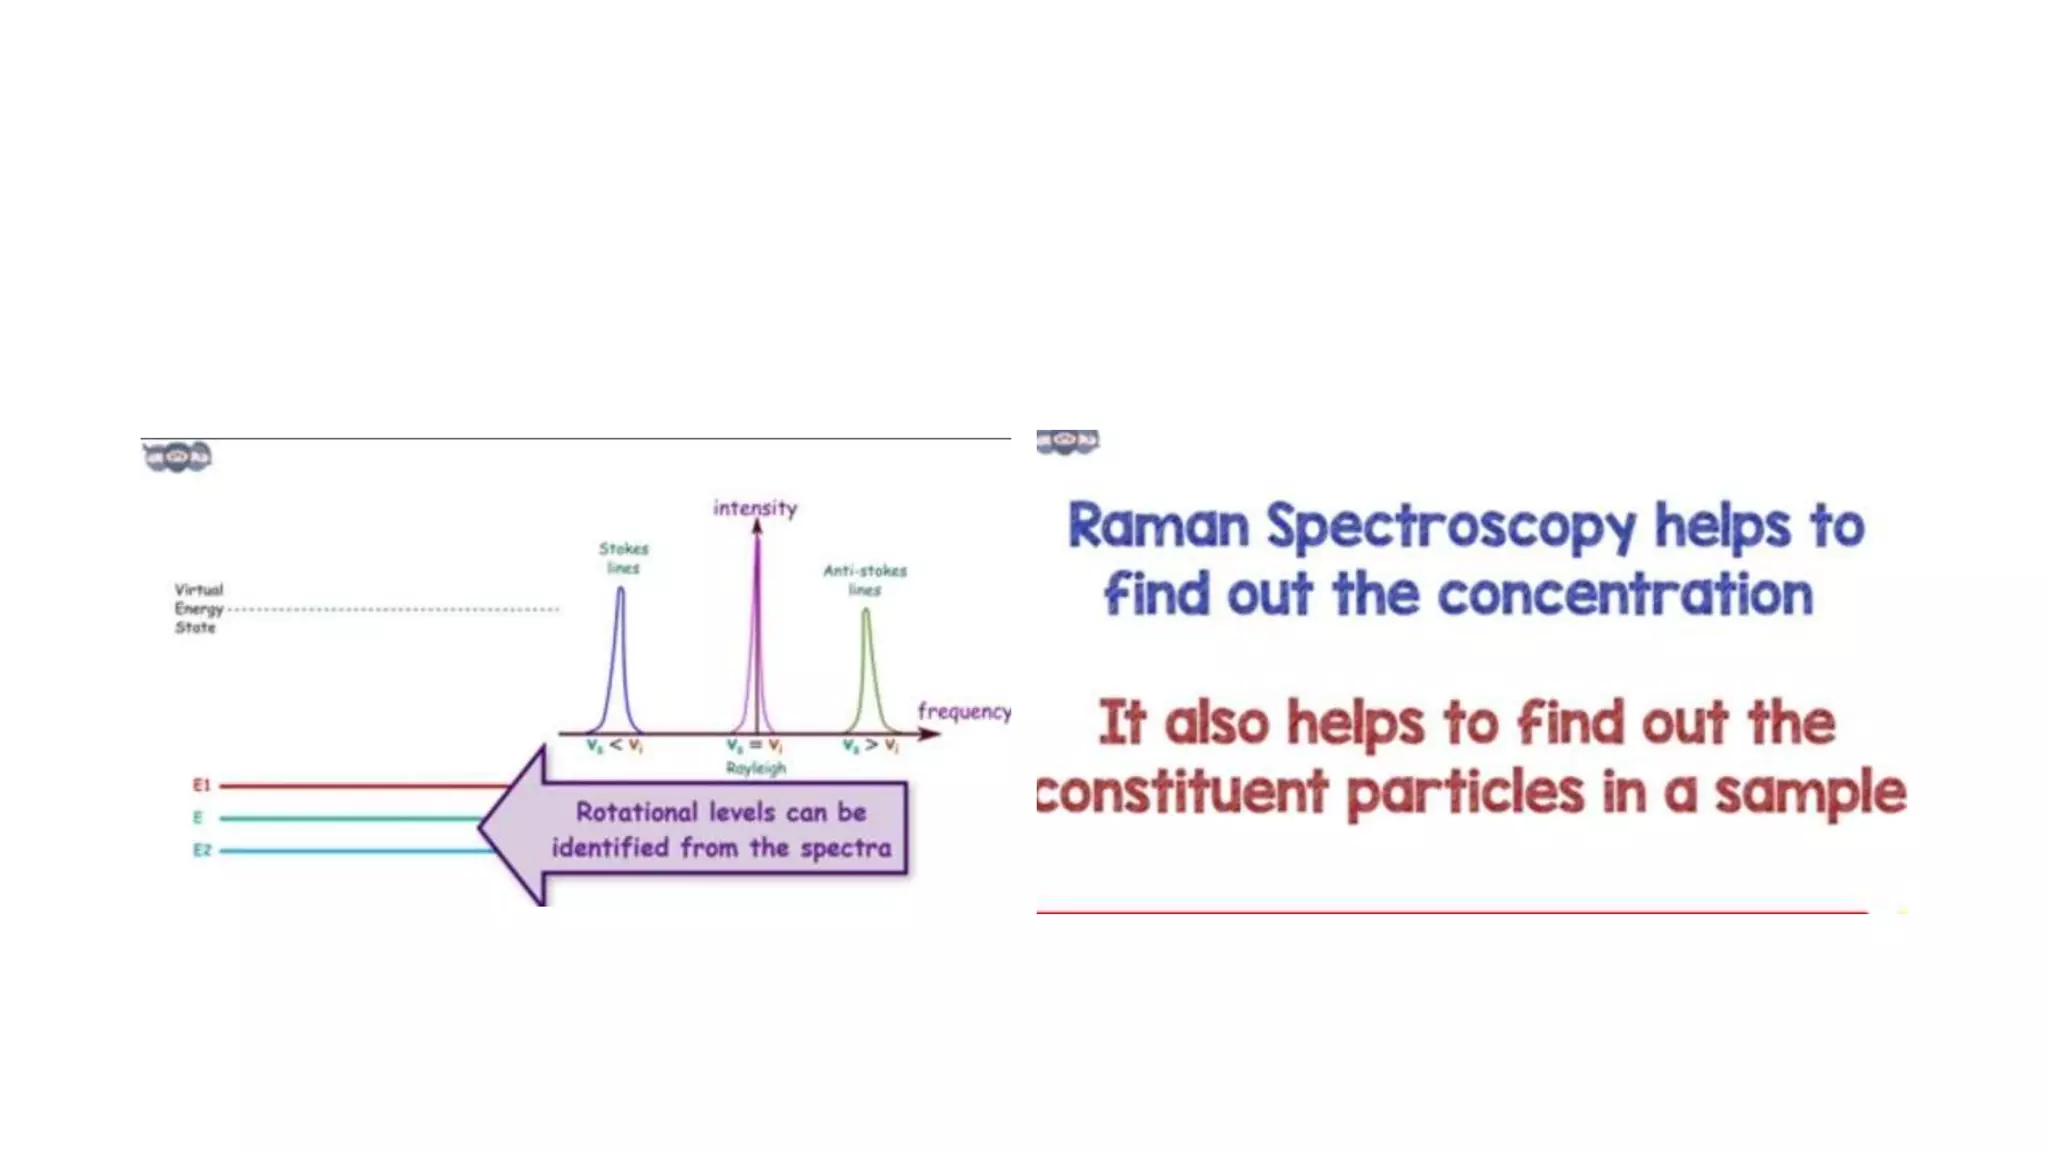
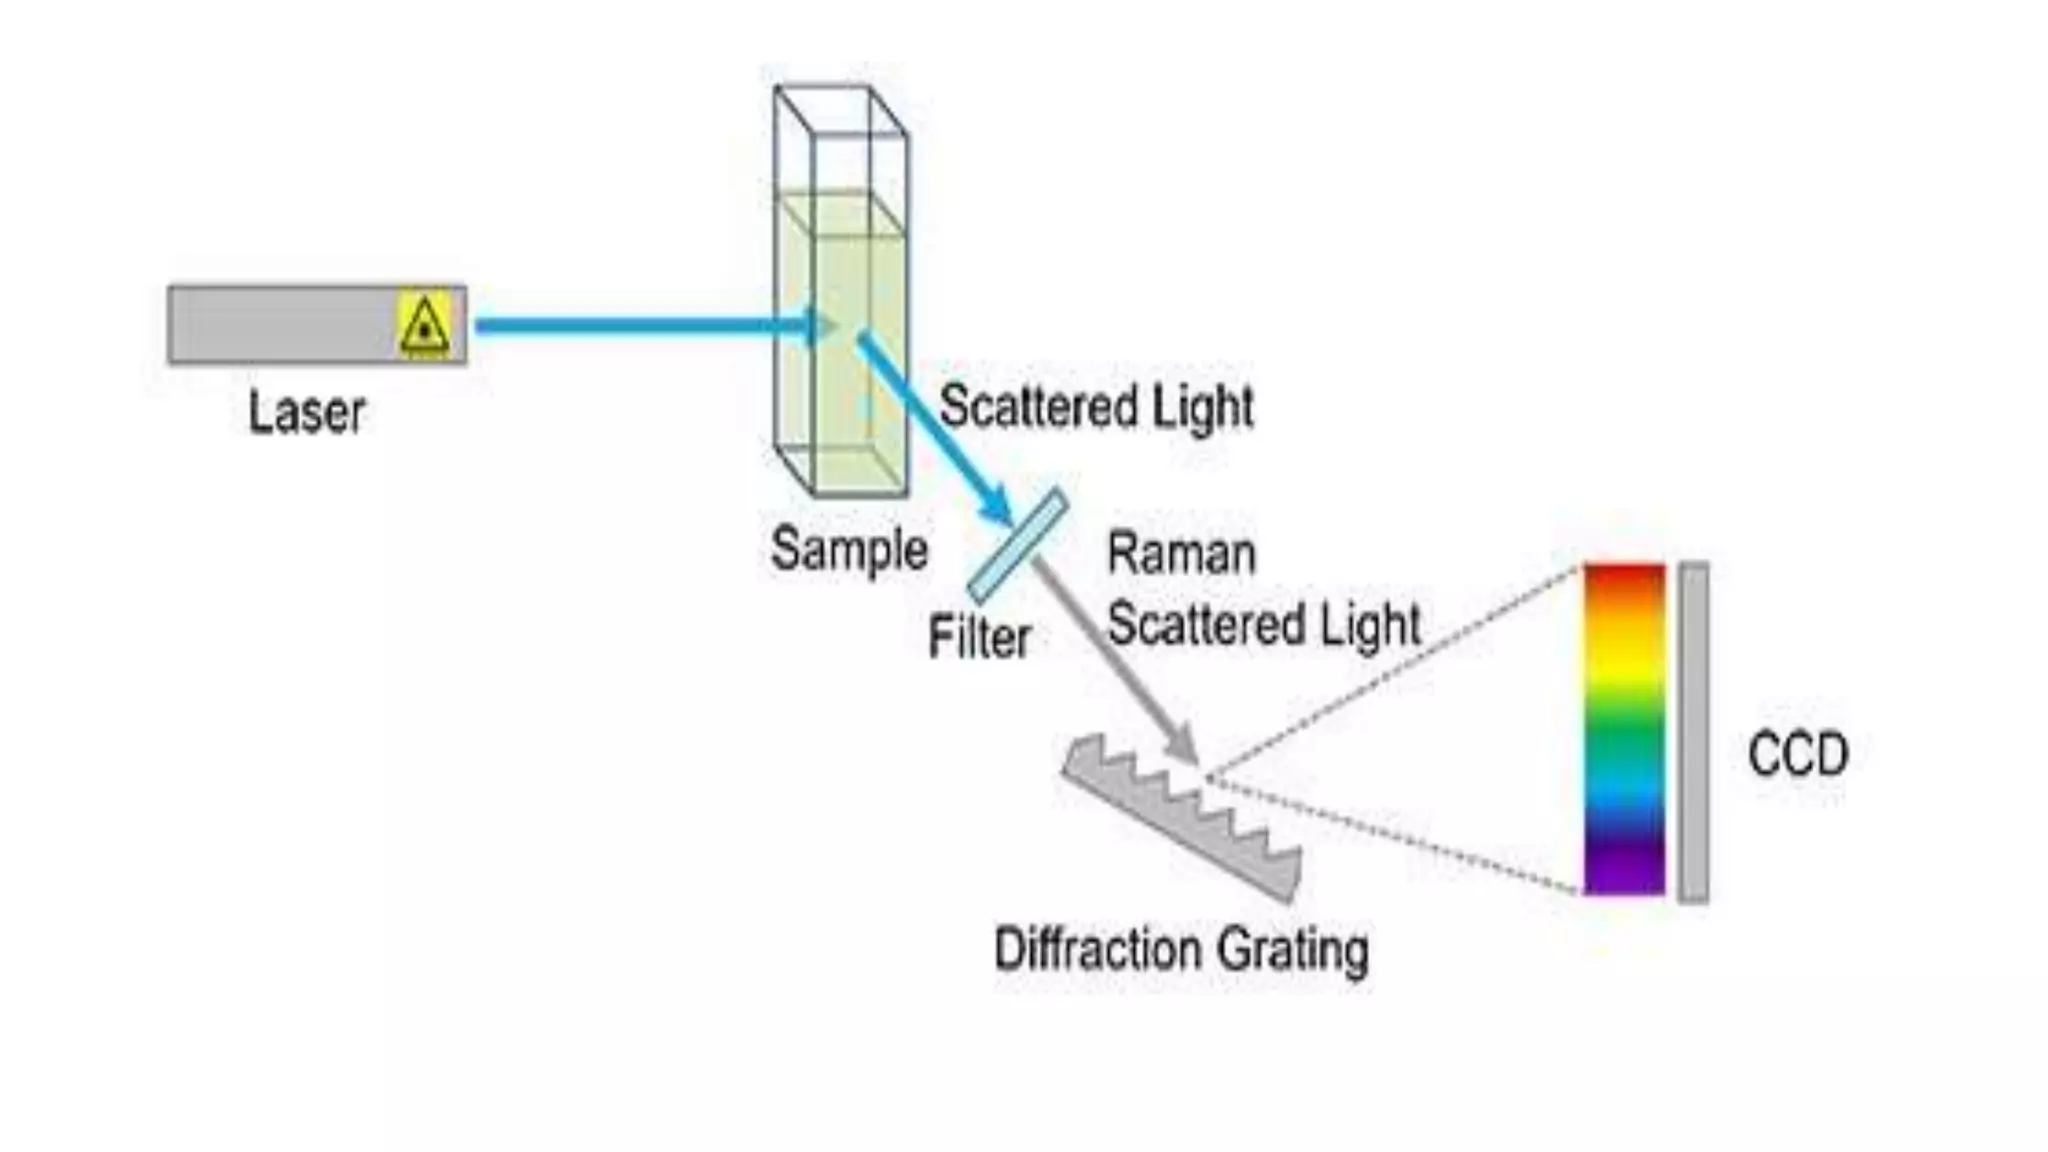
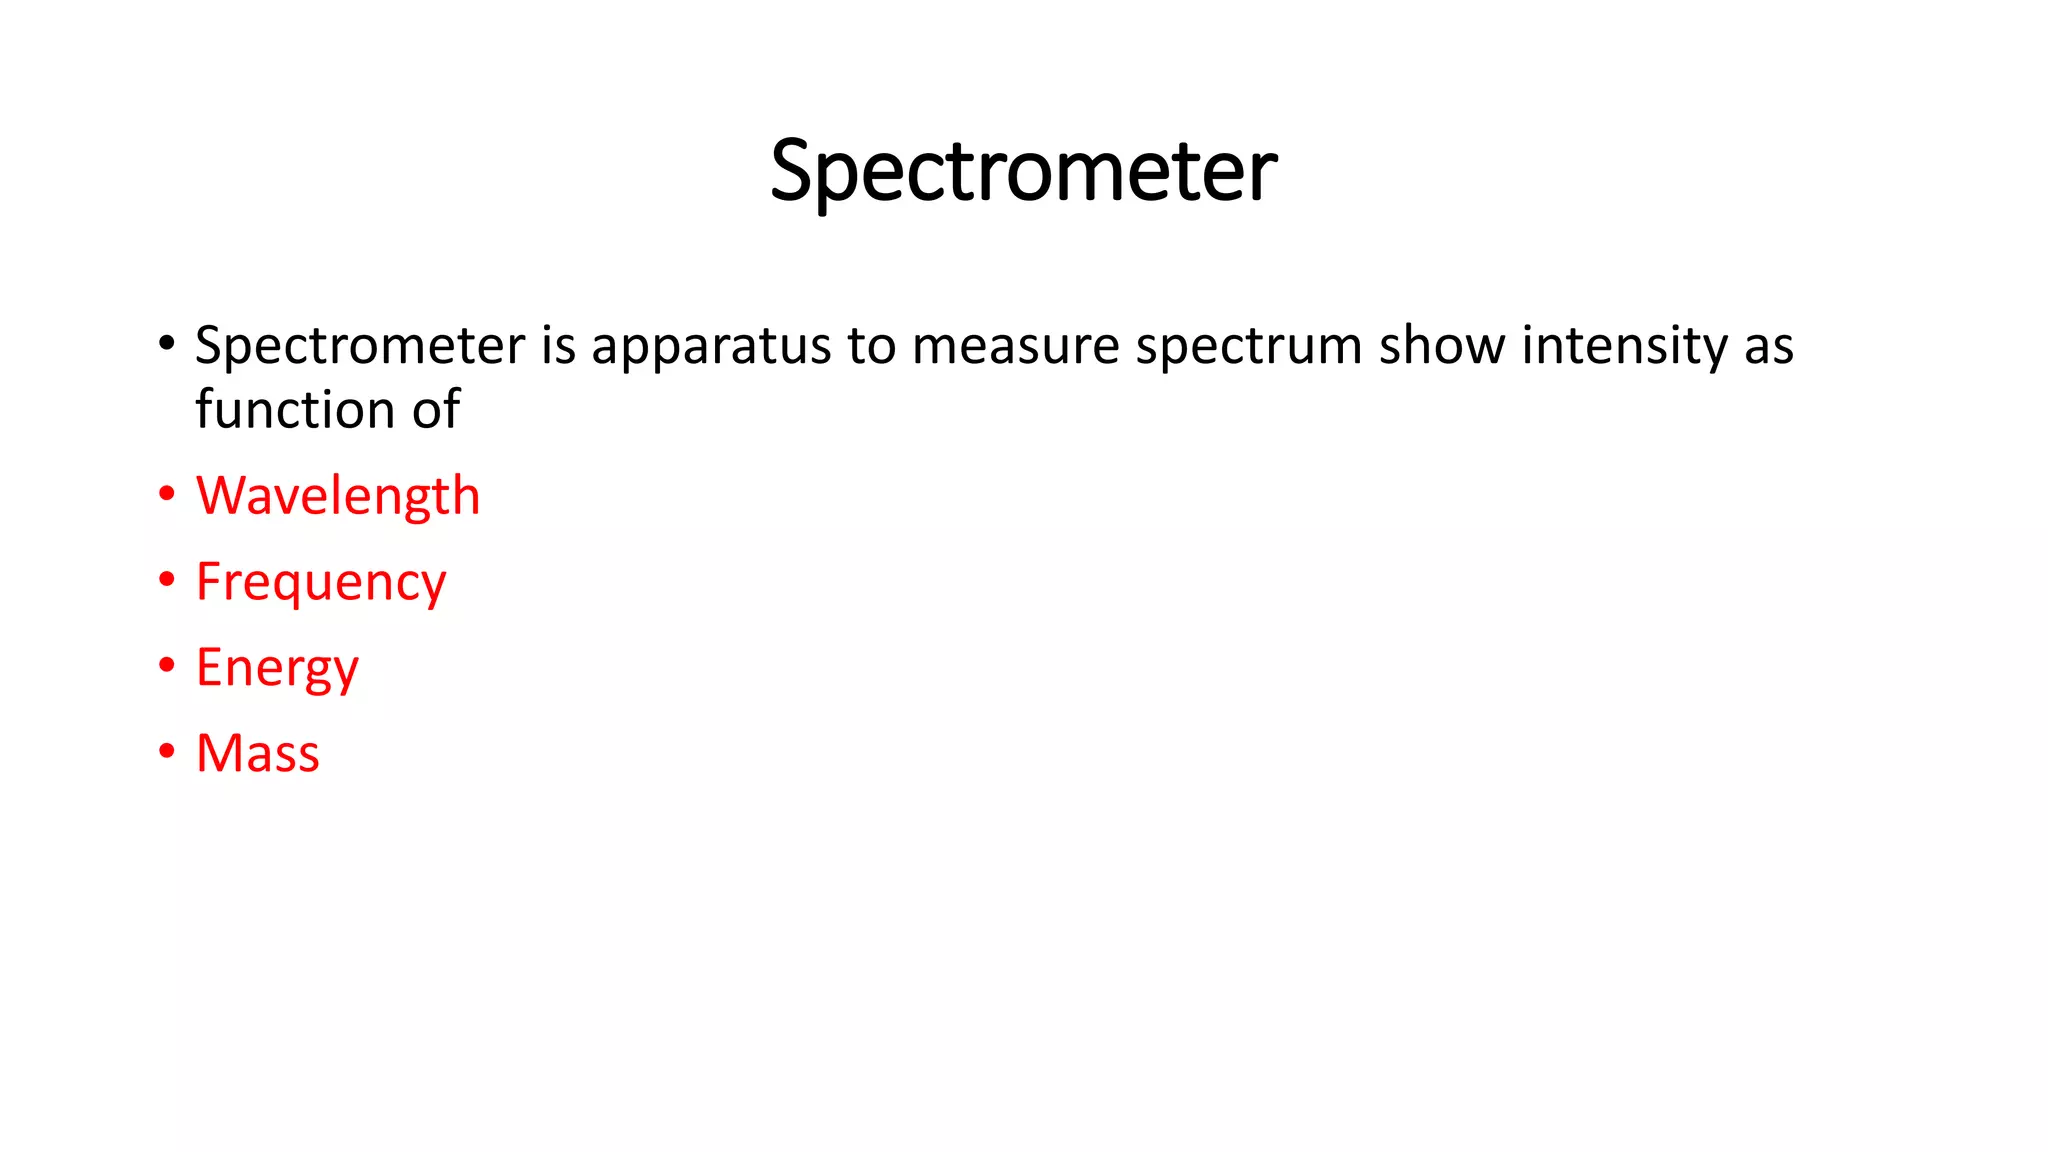
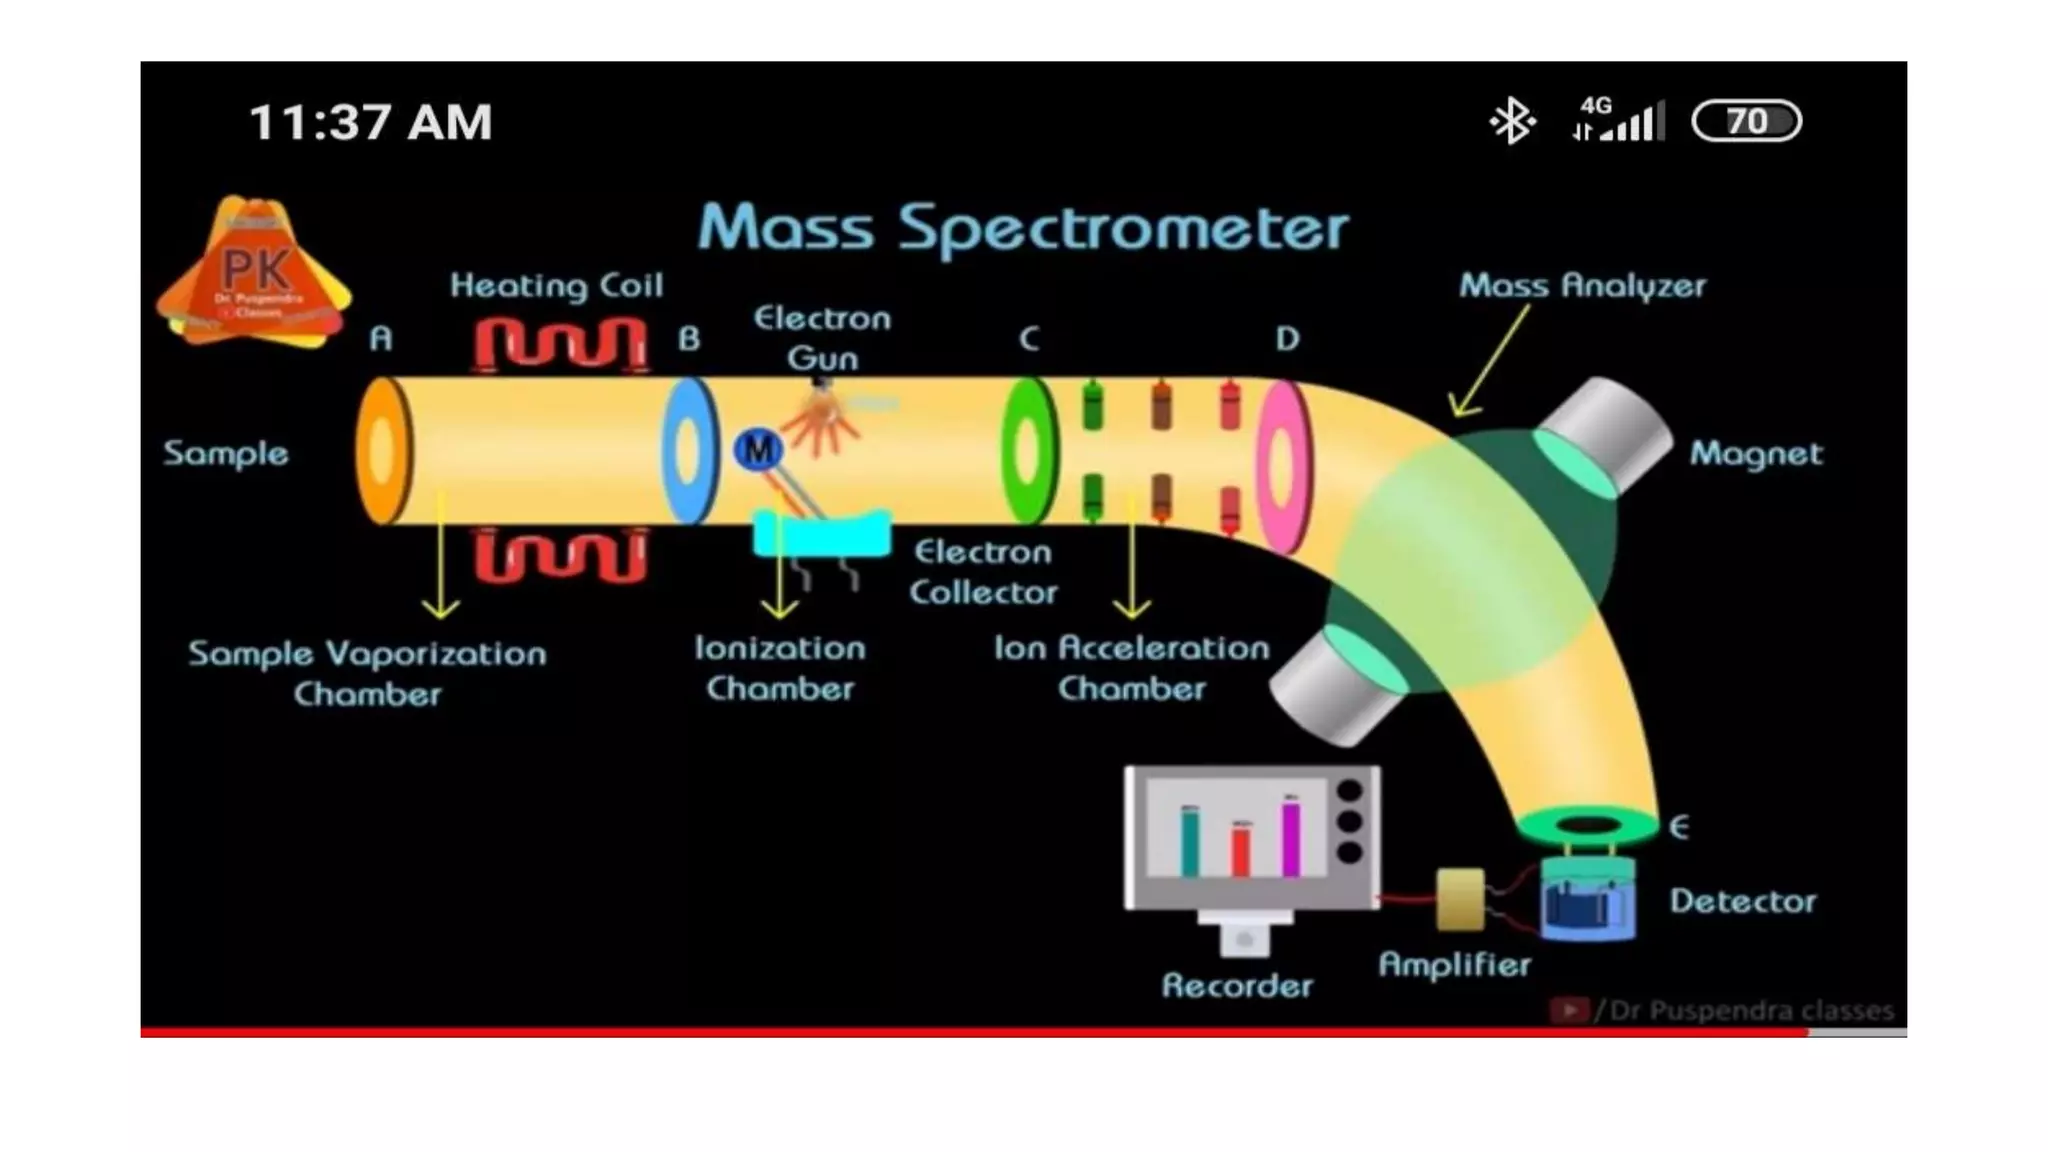
Spectroscopy
Presented by Nizad sultana
Spectroscopy
• Spectroscopy is the study of the interaction
between matter and electromagnetic radiation.
• Historically, spectroscopy originated through the study
of visible light dispersed according to its wavelength
by a prism
• The electromagnetic spectrum is the range of frequencies of
electromagnetic radiation and their respective wavelengths and photon
energies
Principle of spectroscopy
• The term "spectroscopy" defines a large number of
techniques that use radiation to obtain information on the
structure and properties of matter.
• The basic principle shared by all spectroscopic techniques is
to shine a beam of electromagnetic radiation onto a sample,
and observe how it responds to such a stimulus.
• The history of spectroscopy began with Isaac Newton's optics
experiments (1666–1672).
• Newton applied the word "spectrum" to describe the rainbow of colors
that combine to form white light and that are revealed when the white
light is passed through a prism.
• During the early 1800s, Joseph von Fraunhofer made experimental
advances with dispersive spectrometers that enabled spectroscopy to
become a more precise and quantitative scientific technique.
•Why we use spectroscopy
• Applications
• Spectroscopy is used as a tool for studying the structures
of atoms and molecules. The large number of wavelengths
emitted by these systems makes it possible to investigate their
structures in detail.
• Spectroscopy also provides a precise analytical method for
finding the constituents in material having unknown
chemical composition.
• In a typical spectroscopic analysis, a concentration of a few
parts per million of a trace element in a material can be detected
through its emission spectrum
How to classify spectroscopy
• Spectroscopy can be defined by the type of radiative energy involved.
The intensity and frequency of the radiation allow for a measurable
spectrum.
• Electromagnetic radiation is a common radiation type and was the
first used in spectroscopic studies.
• Both infrared (IR) and near IR use electromagnetic radiation, as well
asmicrowave techniques.
• Another way of classifying spectroscopy is by the nature of
the interaction between the energy and the material. These
interactions include absorption, emission.
IR Spectroscopy
• Range of electromagnetic spectrum that is used is Infrared
radiation.
• Infrared is makeup of different radiations.
• The measurement of the interaction of infrared radiation with
matter by absorption, reflection.
• Used to find functional group in molecules can liquid
gaseous forms.
• After absorbing energy molecules vibrate. Vibration of two typ
• Streching
1. Symetrical
2. Assymetrical
• Bending
1. Scissoring
2. Wagging
3. Rocking
4. Twisting
• Bonds show different vibrations at different
wavelengths.
• Different functional groups absorbs different
wavelength of light so show different peaks.
• Formula to find vibrations in linear molecules.
Spectrum
• Spectrum have two main regions.
• Absorbtion region:-
• Individual peaks we can identify easily.
• Fingerprinting region:-
• Multiple peaks
• We can’t identify easily
• But by matching with spectrum library.
• Represents bands of bending and stretching.
Applications
• To establish Identity of two compounds.
• To determine the structure of new compound from its functional
group.
• To determine nature of contaiminants in a sample.
• Some advanced physical properties of material.
• Vibrational energy depends upon following:-
• Mass of atom
• Strength of bonds and bond distance
• The arrangement of atom within molecule.
UV visible spectroscopy
• Why we need UV visible spectroscopy.
• We need to find concentration of different substances compounds
mixtures.
• It can also tell us about chemical groups but data is not reliable.
• Also use in kinetic study in enzymatic activity.
• Also known as colour emmitery.
• Determining molar concenteration
• Determining ppm
• Detector can be
• Photodiode
• PMT
• Photomultiplier
• Monochromator consists of
• 2 slits
• 1 prism
• First slit fall light to prism
• Second slit allow one wavelength of light to pass.
• Cuvette with organic compounds
or proteins.
• Proteins absorb wavelength if
260 NM.
• More protein more absorbtion.
• Less intensity of reflected light.
• I decrease.
• Transmitance ~ 1/absorbance
• Transmitance depends upon
concentration of molecule.
• Detector only detect
transmitance than how we
find absorbance.
• So we get graph.
• To convert a value from percent transmittance (%T)
to absorbance, use the following equation:
• Absorbance = 2 – log(%T)
• Example: convert 56%T to absorbance:
• 2 – log(56) = 0.252 absorbance units.
• Absorbance=10-1(concenteration× path length of cuvette)
• Concenteration less =transmitance more
• A=€ ×C×l
• If we know absorbance than can
calculate concenteration.
• C=A/€×l
Because absorbance and
concenteration does not have
linear relationship.
In order to know unknown sample
we need a linear graph.
NMR
• Nuclear magnetic resonance
• We determine chemical and physical properties of different organic
and inorganic molecules.
• Let say protein different atoms arrange in different ways.
• If we take example of hydrogen it consists of 1 proton and 1 electron.
• Proton is surrounded by electron.
• Proton spin it can behave as magnet.
• It is not just for Hydrogen also for other elements.
• So this proton behave as magnet
and it repel and try to rotate
other atom present near it.
• NMR machine creates magnetic
field.
• It directs this magnet in
whatever direction it is to stable
state.
• How it is going to help us in determination of of structures.
• It tells us about special arrangement of atom with respect to each
other.
• Cl -C-H2
• HCl-C-H
• These are two different structures but IR can’t differencite between
these two.
• But pattern of graph obtain help us to understand arrangements.
•Cl H-C-H CH3
•As Hydrogen arrange in electromagnetic field of NMR
less energy is required to change its direction because
it is shielded. But chlorine also present there it
attracts all atoms of carbon towards it so more energy
for Hydrogen alpha.
•For hydrogen beta less energy because chlorine
electronegative effect is less.
• Emission spectroscopy
• It uses to find how much concenteration of element present in
sample.
• Or which element is present in sample sample we can use food
products like noodles or cold drinks or something else.
• Atomic absorbtion
• Use to detect metallic elements that are present.
• Detect calcium magnesium potassium in serum.
• Lead in petrol.
• Nabolizer:-
• Convert solid sample to aerosols.
• Flame role:-
• Dissolution :-evaporate the solvent
• Vapourization:-solute convert to gas
• Atomization:-dissociation produce atoms
• Excitation of atoms.
• Emission of atoms.
• Emission release different wavelength of light so unique spectrum
obtained.
1-Fluorescenece spectroscopy
• Fluorescence spectroscopy uses higher energy photons to excite a
sample,which will then emit lower energy photos. This techniques
has become popular for its biochemical and medical applications.
• Fluorescence spectroscopy is used in, among others,
biochemical, medical, and chemical research fields for
analyzing organic compounds.
• There has also been a report of its use in differentiating
malignant skin tumors from benign.
• In the field of water research, fluorescence spectroscopy can
be used to monitor water quality by detecting organic
pollutants.
• Recent advances in computer science and machine learning
have even enabled detection of bacterial contaminaton of
water.
2- X-ray Spectroscopy:
• X-ray of sufficient frequencies interact with material and excite the
atoms contained. Excitation radiations are absorbed or evolved if vice
versa occurs. X-ray absorption and emission spectroscopy is used in
chemistry and material sciences to determine elemental competition
and chemical bonding.
• Very good and versatile techniques but a little complex. Overall X-ray
diffraction techniques is one that is used most widely for bond length
and angle measurements.
7- Raman spectroscopy:
• Raman spectroscopy; is a spectroscopic technique typically used to determine
vibrational modes of molecules, although rotational and other low-frequency
modes of systems may also be observed.
• Raman spectroscopy is commonly used in chemistry to provide a structural
fingerprint by which molecules can be identified.
Spectrometer
• Spectrometer is apparatus to measure spectrum show intensity as
function of
• Wavelength
• Frequency
• Energy
• Mass
• Optical spectrometer
• Mass spectrometer
• Time of flight spectrometer
Optical spectrometer
•Show intensity of light as function of wavelength
and frequency.
•The deflection is produced either by refraction in
a prism or diffraction in a diffraction grating.
Mass spectrometer
• It is analytic instrument is analytical instruments that is used
to:-
• Identify the amount and type of chemicals present in sample
by measuring the mass to charge ratio abundance of gas
phase ions.
Time of light spectrometer
• Determining the time of flight between two detectors
• If volocity is known masses can be determined.
•Thank you all

Spectroscopy techniques, it's principle, types and applications

  • 1.
  • 2.
    Spectroscopy • Spectroscopy isthe study of the interaction between matter and electromagnetic radiation. • Historically, spectroscopy originated through the study of visible light dispersed according to its wavelength by a prism • The electromagnetic spectrum is the range of frequencies of electromagnetic radiation and their respective wavelengths and photon energies
  • 3.
    Principle of spectroscopy •The term "spectroscopy" defines a large number of techniques that use radiation to obtain information on the structure and properties of matter. • The basic principle shared by all spectroscopic techniques is to shine a beam of electromagnetic radiation onto a sample, and observe how it responds to such a stimulus.
  • 6.
    • The historyof spectroscopy began with Isaac Newton's optics experiments (1666–1672). • Newton applied the word "spectrum" to describe the rainbow of colors that combine to form white light and that are revealed when the white light is passed through a prism. • During the early 1800s, Joseph von Fraunhofer made experimental advances with dispersive spectrometers that enabled spectroscopy to become a more precise and quantitative scientific technique.
  • 7.
    •Why we usespectroscopy
  • 8.
    • Applications • Spectroscopyis used as a tool for studying the structures of atoms and molecules. The large number of wavelengths emitted by these systems makes it possible to investigate their structures in detail.
  • 9.
    • Spectroscopy alsoprovides a precise analytical method for finding the constituents in material having unknown chemical composition. • In a typical spectroscopic analysis, a concentration of a few parts per million of a trace element in a material can be detected through its emission spectrum
  • 11.
    How to classifyspectroscopy • Spectroscopy can be defined by the type of radiative energy involved. The intensity and frequency of the radiation allow for a measurable spectrum. • Electromagnetic radiation is a common radiation type and was the first used in spectroscopic studies. • Both infrared (IR) and near IR use electromagnetic radiation, as well asmicrowave techniques.
  • 12.
    • Another wayof classifying spectroscopy is by the nature of the interaction between the energy and the material. These interactions include absorption, emission.
  • 14.
    IR Spectroscopy • Rangeof electromagnetic spectrum that is used is Infrared radiation. • Infrared is makeup of different radiations. • The measurement of the interaction of infrared radiation with matter by absorption, reflection. • Used to find functional group in molecules can liquid gaseous forms.
  • 17.
    • After absorbingenergy molecules vibrate. Vibration of two typ • Streching 1. Symetrical 2. Assymetrical • Bending 1. Scissoring 2. Wagging 3. Rocking 4. Twisting
  • 19.
    • Bonds showdifferent vibrations at different wavelengths. • Different functional groups absorbs different wavelength of light so show different peaks.
  • 20.
    • Formula tofind vibrations in linear molecules.
  • 22.
    Spectrum • Spectrum havetwo main regions. • Absorbtion region:- • Individual peaks we can identify easily. • Fingerprinting region:- • Multiple peaks • We can’t identify easily • But by matching with spectrum library. • Represents bands of bending and stretching.
  • 23.
    Applications • To establishIdentity of two compounds. • To determine the structure of new compound from its functional group. • To determine nature of contaiminants in a sample. • Some advanced physical properties of material.
  • 24.
    • Vibrational energydepends upon following:- • Mass of atom • Strength of bonds and bond distance • The arrangement of atom within molecule.
  • 25.
    UV visible spectroscopy •Why we need UV visible spectroscopy. • We need to find concentration of different substances compounds mixtures. • It can also tell us about chemical groups but data is not reliable. • Also use in kinetic study in enzymatic activity. • Also known as colour emmitery. • Determining molar concenteration • Determining ppm
  • 27.
    • Detector canbe • Photodiode • PMT • Photomultiplier • Monochromator consists of • 2 slits • 1 prism • First slit fall light to prism • Second slit allow one wavelength of light to pass.
  • 28.
    • Cuvette withorganic compounds or proteins. • Proteins absorb wavelength if 260 NM. • More protein more absorbtion. • Less intensity of reflected light. • I decrease. • Transmitance ~ 1/absorbance • Transmitance depends upon concentration of molecule.
  • 29.
    • Detector onlydetect transmitance than how we find absorbance. • So we get graph.
  • 30.
    • To converta value from percent transmittance (%T) to absorbance, use the following equation: • Absorbance = 2 – log(%T) • Example: convert 56%T to absorbance: • 2 – log(56) = 0.252 absorbance units. • Absorbance=10-1(concenteration× path length of cuvette) • Concenteration less =transmitance more • A=€ ×C×l
  • 31.
    • If weknow absorbance than can calculate concenteration. • C=A/€×l Because absorbance and concenteration does not have linear relationship. In order to know unknown sample we need a linear graph.
  • 32.
    NMR • Nuclear magneticresonance • We determine chemical and physical properties of different organic and inorganic molecules. • Let say protein different atoms arrange in different ways. • If we take example of hydrogen it consists of 1 proton and 1 electron. • Proton is surrounded by electron. • Proton spin it can behave as magnet. • It is not just for Hydrogen also for other elements.
  • 33.
    • So thisproton behave as magnet and it repel and try to rotate other atom present near it. • NMR machine creates magnetic field. • It directs this magnet in whatever direction it is to stable state.
  • 35.
    • How itis going to help us in determination of of structures. • It tells us about special arrangement of atom with respect to each other. • Cl -C-H2 • HCl-C-H • These are two different structures but IR can’t differencite between these two. • But pattern of graph obtain help us to understand arrangements.
  • 36.
    •Cl H-C-H CH3 •AsHydrogen arrange in electromagnetic field of NMR less energy is required to change its direction because it is shielded. But chlorine also present there it attracts all atoms of carbon towards it so more energy for Hydrogen alpha. •For hydrogen beta less energy because chlorine electronegative effect is less.
  • 37.
    • Emission spectroscopy •It uses to find how much concenteration of element present in sample. • Or which element is present in sample sample we can use food products like noodles or cold drinks or something else. • Atomic absorbtion • Use to detect metallic elements that are present. • Detect calcium magnesium potassium in serum. • Lead in petrol.
  • 39.
    • Nabolizer:- • Convertsolid sample to aerosols. • Flame role:- • Dissolution :-evaporate the solvent • Vapourization:-solute convert to gas • Atomization:-dissociation produce atoms • Excitation of atoms. • Emission of atoms. • Emission release different wavelength of light so unique spectrum obtained.
  • 41.
    1-Fluorescenece spectroscopy • Fluorescencespectroscopy uses higher energy photons to excite a sample,which will then emit lower energy photos. This techniques has become popular for its biochemical and medical applications. • Fluorescence spectroscopy is used in, among others, biochemical, medical, and chemical research fields for analyzing organic compounds. • There has also been a report of its use in differentiating malignant skin tumors from benign.
  • 42.
    • In thefield of water research, fluorescence spectroscopy can be used to monitor water quality by detecting organic pollutants. • Recent advances in computer science and machine learning have even enabled detection of bacterial contaminaton of water.
  • 43.
    2- X-ray Spectroscopy: •X-ray of sufficient frequencies interact with material and excite the atoms contained. Excitation radiations are absorbed or evolved if vice versa occurs. X-ray absorption and emission spectroscopy is used in chemistry and material sciences to determine elemental competition and chemical bonding. • Very good and versatile techniques but a little complex. Overall X-ray diffraction techniques is one that is used most widely for bond length and angle measurements.
  • 45.
    7- Raman spectroscopy: •Raman spectroscopy; is a spectroscopic technique typically used to determine vibrational modes of molecules, although rotational and other low-frequency modes of systems may also be observed. • Raman spectroscopy is commonly used in chemistry to provide a structural fingerprint by which molecules can be identified.
  • 50.
    Spectrometer • Spectrometer isapparatus to measure spectrum show intensity as function of • Wavelength • Frequency • Energy • Mass
  • 51.
    • Optical spectrometer •Mass spectrometer • Time of flight spectrometer
  • 52.
    Optical spectrometer •Show intensityof light as function of wavelength and frequency. •The deflection is produced either by refraction in a prism or diffraction in a diffraction grating.
  • 53.
    Mass spectrometer • Itis analytic instrument is analytical instruments that is used to:- • Identify the amount and type of chemicals present in sample by measuring the mass to charge ratio abundance of gas phase ions.
  • 55.
    Time of lightspectrometer • Determining the time of flight between two detectors • If volocity is known masses can be determined.
  • 56.